

Stock Market Updates for August, 2024
23rd August, 2024
Avoiding Pitfalls: Key Considerations Before Investing in Momentum Stocks
The urge among investors to earn faster returns leads to a search for multi-bagger stocks, which can quickly double or triple the investment value. The potential for such rapid price appreciation lies in the small-cap stocks that are in the growth phase of their business cycle. The P/E ratio of the Nifty Small 250 index has surged more than 30% from 23.2 to 31.2 in the past year. The soaring premium valuation of smaller companies in the Indian equity market reflects investors’ keen interest in chasing growth. However, do the stellar return prospects outweigh the risks associated with such investments?
No.
"A company’s share price is said to reflect the present value of expected future after-tax cash flows.”
Breaking down this statement is crucial for analyzing investment decisions in growing companies to achieve risk-adjusted returns.
The phrase “present value” requires us to consider the time value of money. This means that a rupee spent today is more valuable than a rupee earned in the future. The value of money depends upon interest rates and people’s perception of the future.
If the interest rates in the economy are rising then the cost of capital for business will rise. It will become difficult for companies to raise capital and service debt. If people’s perception of the future is gloomy then they will be reluctant to spend. The perception can be affected by any war, economic recession, job loss, etc. If they are not spending then it will be difficult for growth companies to sustain their momentum. All this can have an impact on the way growth companies are valued.
The word “expected” denotes uncertainty and the possibility of chance. The anticipated increase in industry size and the company’s future growth plans carry the risk of uncertainty, and events may not unfold as planned. Market dynamics in a growing industry are constantly evolving, and technological disruption cannot be ruled out. A higher-order book carries execution risks, and heavy capital expenditure contributes to operating expenses, while revenue growth depends on several factors.
The term “after-tax” implies that government policies and budgetary allocations for a particular industry could change. For instance, taking a tough stand, the government imposed the highest GST rate on online gaming activities. Additionally, recent remarks by the Honourable Union Commerce and Industry Minister, expressing concern over the surge in e-commerce transactions, illustrate this point.
Regarding “cash flows”, we must consider a growing company’s continuous need for investment in fixed and working capital from its earned profits. Committing substantial expenses to R&D might not be feasible for a smaller company, and if such an investment is made, its realization remains an uncertain future outcome.
As one market legend famously said, “It is important which stock I buy, but it is more important at what price I buy.” Thus, we cannot ignore the valuation aspect when pursuing growth. The PEG ratio (P/E ratio divided by the growth rate of EPS) or multi-stage discounted cash flow (DCF) methods can be used for valuation.
Often, investors overlook the risk-adjusted required rate of return and valuation parameters when investing in shares of a growing company experiencing upward momentum. However, such pursuit of growth can compromise the margin of safety, increasing the risk of significant losses. Herd bias can influence rationality in investment decisions, leading to potentially costly mistakes.
Investors should always make decisions cautiously, even in a bull market, and follow a disciplined investing approach to avoid sharp price declines and to build a long-term compounding portfolio.
Technical Outlook
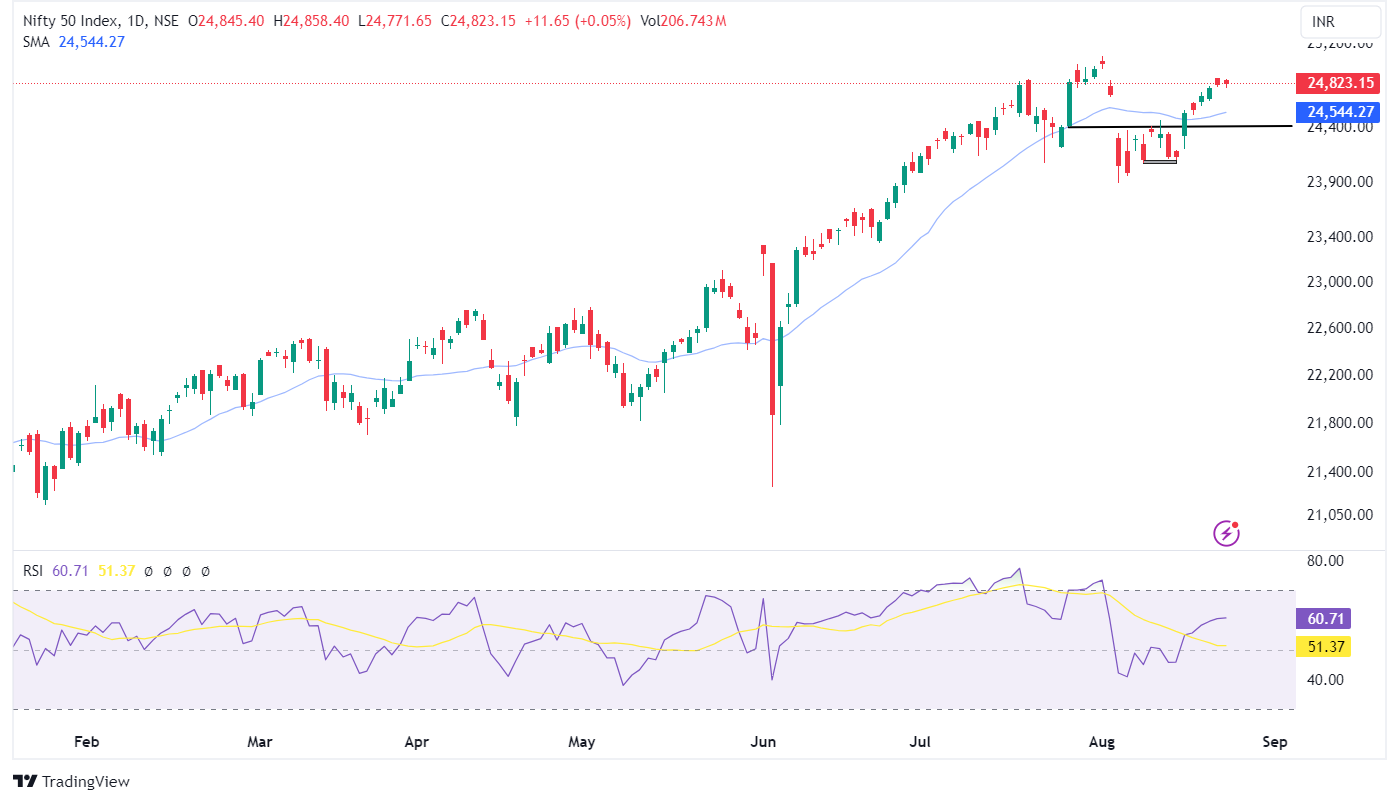
Nifty enjoyed a steady week, gaining 1.15% compared to the previous week to close at 24,823. Nifty remains comfortably above its 20-day moving average and continues to establish a pattern of higher highs and higher lows on the daily chart. A double bottom formation suggests a potential trend reversal, with gradual upward movement underway.
Global markets maintained a positive tone, further boosting sentiment in the domestic market. The daily RSI now holds above the 60 level, strengthening Nifty’s primary uptrend. The key support remains at 24,500, while 25,000 presents an immediate resistance; a breakout above this could push the index toward the 25,150-25,220 range.
The India VIX has declined by 5.90% to 13.55, reflecting reduced volatility. Overall, Nifty is expected to trade sideways with a positive bias.
16th August, 2024
India Inc: Key Takeaways from Q1FY25 Earnings Season
As we conclude the Q1FY25 earnings season, a detailed analysis indicates a steady landscape with subdued topline growth. The Bank and Auto stocks within the Nifty 50 demonstrated noteworthy performance by exceeding the Nifty 50’s overall sales growth. However, the underperformance of the Infrastructure, Pharmaceuticals, and Metal stocks within Nifty 50 tempered the earnings growth to a modest 3%. This article will explore these results in detail, highlighting key insights from the earnings season.
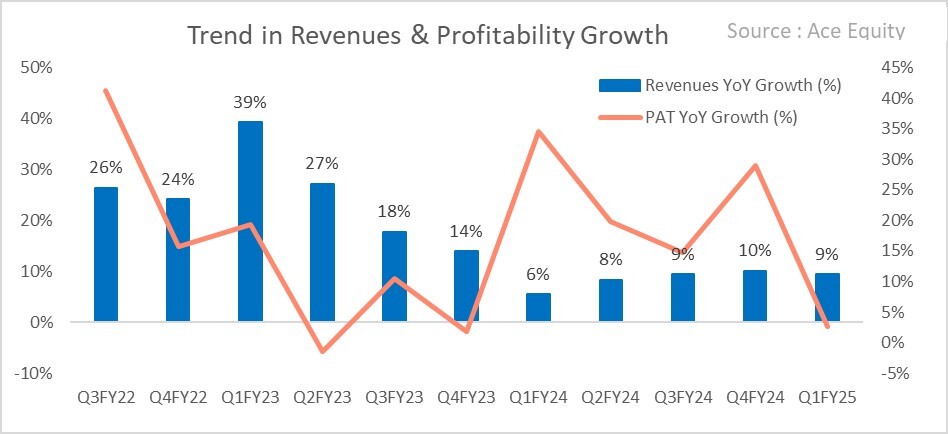
Over the past five quarters, average revenue and net profit growth have been 9% and 20%, respectively. In Q1FY25, revenue growth remained steady at 9%, but net profit growth was lower at 3%. This reflects steady revenue growth, although there are indications of a slowdown in profitability.
In Q1FY25, real estate companies showed significant year-on-year growth in both revenue and profitability, surpassing other sectors. Banks and automobile companies also delivered consistent performance in sales and profitability, while the pharmaceutical sector displayed a substantial increase in profitability.
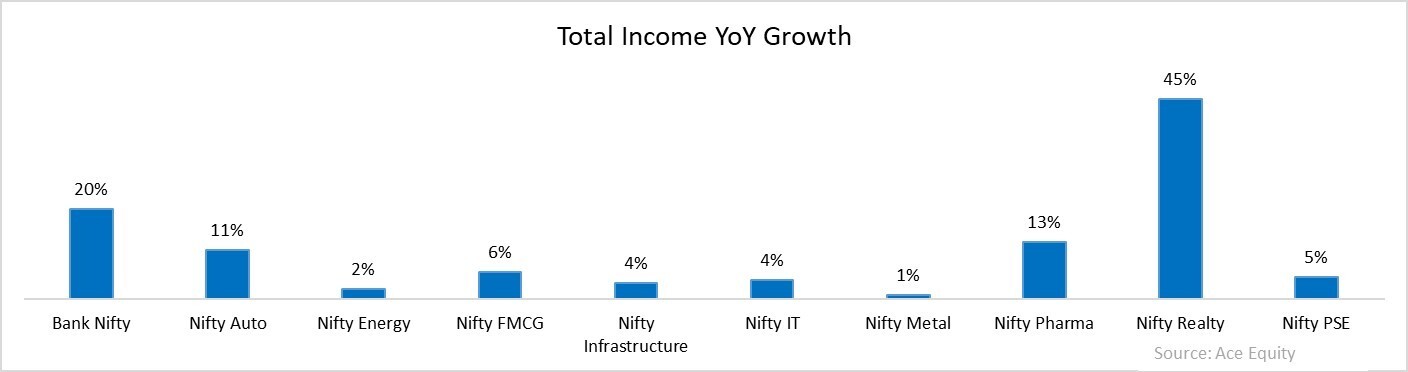
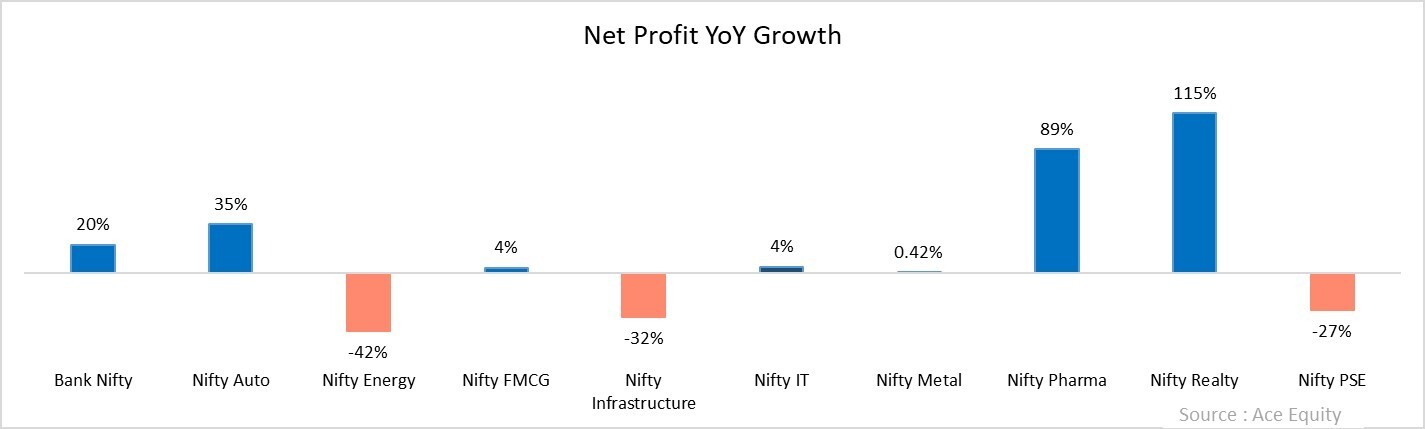
Indian public and private banks reported year-over-year increases in total income and PAT during Q1FY25. Business momentum remained strong during the quarter, with moderate growth in lending. Leading banks witnessed sequential growth. Although the banks displayed growth in their advances, deposit growth remained sluggish, presenting a key concern for them. Net Interest Margins (NIMs) remained stable, with private banks continuing to report higher NIMs compared to PSU banks. Non-performing assets (NPAs) declined across both segments, reflecting improved asset quality. However, the banks faced pressure due to the sluggish performance of their Current Account & Saving Account (CASA) deposits.
The automotive sector had a strong quarter, with all companies reporting annual sales growth and most witnessing a surge in profit after tax. This growth was mainly driven by sales of two-wheelers, three-wheelers, and commercial vehicles, although passenger vehicles and tractors did not meet expectations. The sector expects moderate growth, supported by the government's efforts to boost rural consumption and disposable income.
Indian IT giants have displayed resilience amid macroeconomic uncertainties. Major IT firms have exceeded market expectations, indicating robust performance and sequential growth across major markets. Despite profit and margin pressures, revenue growth remains strong, showcasing the sector’s potential.
The pharmaceutical sector maintained its strong performance, with profit after tax marking an impressive surge of 89% and total income rising by 13% year-on-year. Most of the companies have reported their best-ever quarterly results. The notable boost in profitability was driven by higher profit margins, controlled costs, expanded export opportunities in the US, and a change in the product mix.
In the real estate sector, mid-cap companies achieved significant sales growth, while large-cap companies faced a decline in annual sales. Despite this, most real estate companies reported higher profitability, driven by increased leasing activity and expansion into new areas.
The FMCG sector saw moderate revenue and marginal earnings growth. Government initiatives to boost employment and rural consumption suggest potential for future improvement in this sector.
On the other hand, the Nifty Energy and Nifty PSE sectors underperformed, with flat revenue and declining profitability.
Technical Outlook
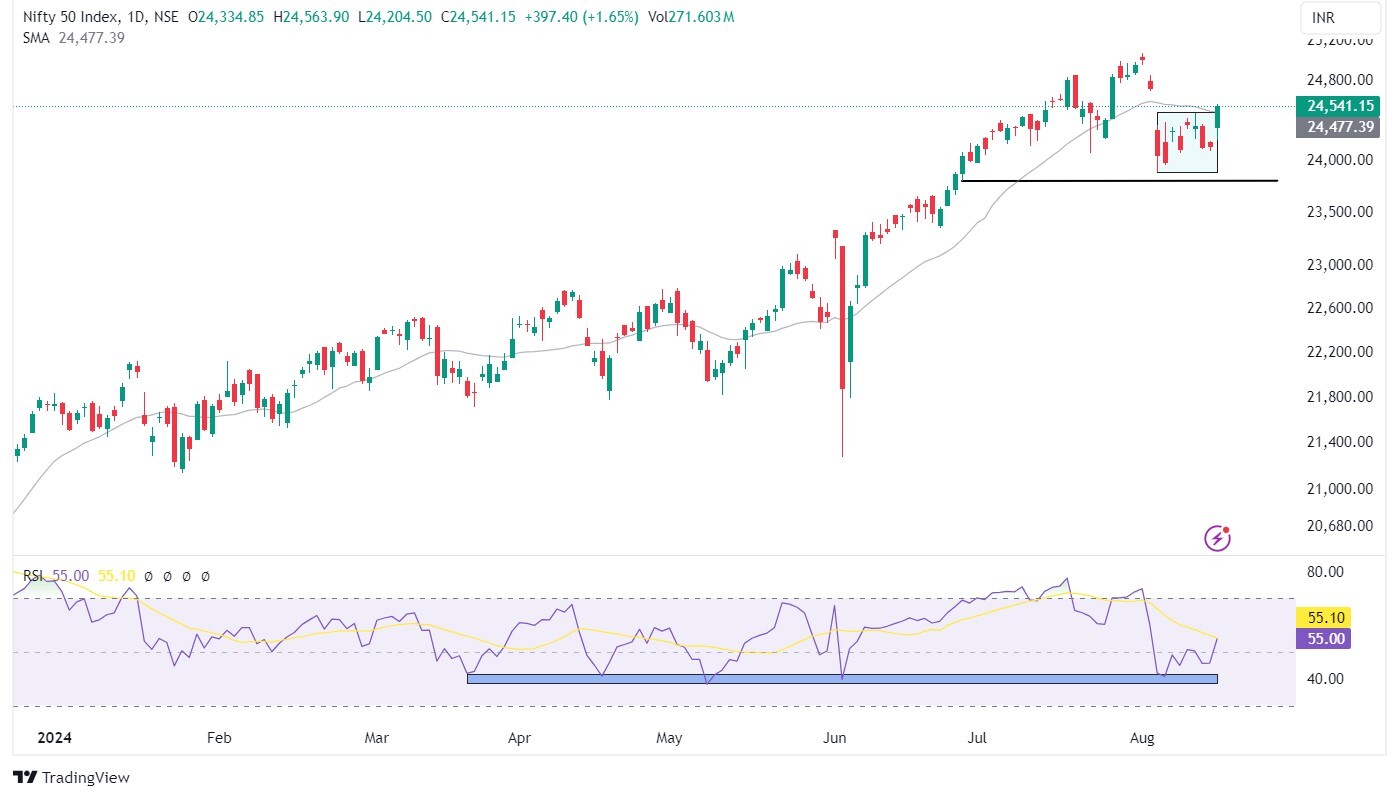
Nifty experienced a volatile week, ending at 24,541, up 0.71% for the week. The index regained its position above the 20-day moving average after a period of consolidation. Nifty is sustaining above the 50% retracement level, indicating that the oversold territory has now been accounted for.
The daily RSI has recovered from lower levels and settled at 55. Nifty’s primary trend remains positive on the weekly time frame. Strong support is seen at 24,100, while 24,950 serves as a hurdle; a breakout above this level could extend the rally toward the 25,150-25,220 zone.
The global market remains neutral to positive, while the domestic market has followed the trend. India VIX currently stands at 14.40, remaining below the 15 mark. Overall, Nifty is anticipated to trade sideways with a positive bias.
2nd August, 2024
An Investing Strategy for Tax-Hiked Environment
Tax! Tax! Tax! Everybody in town is talking about the hike in Long Term Capital Gains (LTCG) & Short-Term Capital Gains (STCG) and its impact on their portfolio. But let me remind you, still many people in the market are lured by quick profits and are of the view that actively trading can help them generate better returns.
Reality is far from it. You can make better returns by staying invested for the long run. Let me show you this with the help of an example.
A financial asset like shares or mutual funds if held for more than a year is termed as long term and gains arising from the sale of such asset is charged an LTCG and anything held less than a year is levied STCG. LTCG over and above the gains of Rs. 1.25 lakh was raised to 12.5% from 10% in the recent Union Budget. STCG was raised to 20% from 15%.
Now let’s do the math:
Let’s assume one is consistently generating an annual return of 14% on his capital by trading actively each year for a period of 20 years. He reinvests the net gains he makes to his initial capital by paying STCG of 20% each year. This is what his net take home income looks like after paying taxes STCG after 20 years.
| Particulars | Amounts (In Rs.) |
| Initial Investment | 1,000,000 |
| Short term capital gains | 9,197,341 |
| Total Tax paid @ 20% every year | 1,839,468 |
| Net Take Home after Taxes | 8,357,873 |
Now let us see the other boring method of “buy and hold” way of investing. Here he is holding this asset for the entire period of 20 years right from start to end. This is what his net gains will look like after paying LTCG.
This asset can be anything a portfolio of carefully selected stocks, index or a mutual fund. Whatever he chooses it compounds at a reasonable rate of 14% on a yearly basis for 20 years. Now let’s see how the stats look:
| Particulars | Amounts (In Rs.) |
| Initial Investment | 1,000,000 |
| Final Value @ 14% CAGR | 13,743,490 |
| Long term capital gainsevery year | 12,743,490 |
| Total Tax paid @ 12.5% | 1,577,311 |
| Net Take Home after Taxes | 1,21,50,554 |
Even after paying an LTCG of Rs 15.77 lakh the net take home after 20 years is a whopping 45% higher than what you would have made by short-term trading. Mind you the STCG you pay is only Rs 2.46 lakh higher than LTCG. Then why this difference?
It is because of compounding. By paying taxes at regular intervals, you are losing out on the power of compounding that you can get each year.
If you include transaction costs then the profits in trading would decrease further. If one has to meet the returns generated by the boring method, the CAGR of short-term trading should be 16.62%. This would still not include the transaction costs, time and effort that you will have to devote for trading.
Based on the above computations it is clear that being active in the market is not as rewarding as being just passively invested in the market. Even if the taxes are hiked an investor can always be in an advantageous position, then a trader in the long run.
Now the question that would arise in your mind is how can you select a portfolio of stocks for 20 years. Nobody knows with certainty what will happen two quarters down the line then how one can predict who will be the winners 20 years forward.
That’s where a mutual fund or an index fund can help you. An active mutual fund will pick stocks which show potential and will replace the ones which falter. An index fund will also do the same but its frequency is less.
With this approach you get the power of compounding combined with the power of adaptability to make superior returns.
Technical Outlook
_1722603407.png)
Nifty reached the 25,000 milestone, reaching a high of 25,078. The Nifty closed the day at 24,718, down 0.47% for the week.
This dip mirrors slight weaknesses observed in global markets, contributing to the domestic market's pullback at the week's end.
The Nifty slipped below the 23.6% Fibonacci retracement level which is placed around 24,840, while the 20-day moving average remains near 24,600. However, the primary trend remains strong as long as the Nifty stays above the support level 24,450.
In the near term, the Nifty may consolidate within the 24,500-25,000 range before making any significant directional move. The India VIX, currently at 14.32, poses a potential risk of increased volatility if it surpasses the 15 mark, which could disrupt the prevailing bullish sentiment. Sector rotation may also drive market movements in the short term.
 Easy & quick