Stock Market Updates for March, 2024
28th March, 2024
Time for a Fresh Rally in Midcaps and Smallcaps
Despite a consolidation phase in the Indian markets, the Nifty Smallcap 100 and Nifty Midcap 100 have remained resilient. Following substantial rallies of around 27% and 25% respectively from November 2023 to January 2024, these indices took a breather in the last two months. However, it might be time for a fresh leg of rally in these indices in April.
But why do I say so?
Since 2010, the Nifty Smallcap 100 and the Nifty Midcap 100 have embodied a bullish run in the month of April. This trend has been characterized by consistent upward movements in these indices, marking April as a particularly favorable period for investors eyeing small and midcap stocks.
The Nifty Smallcap 100, for instance, has recorded positive gains in 11 out of the 14 years. Such a track record makes April tied with December for the highest number of positive movements. Similarly, the Nifty Midcap 100 has shown a bullish streak, gaining ground on 11 occasions, trailing only behind October in terms of frequency.


What makes April even more noteworthy is not just the frequency of positive movements, but also the magnitude of the returns. In terms of average returns, April emerges as the most lucrative month for both of these indices. While the Nifty Smallcap 100 registers an impressive average return of 4.44%, the Nifty Midcap 100 yields a 3.27% gain, outperforming every other month by a considerable margin.
Despite the talk about the smallcap and midcap rally in the last 2 years and concerns about their valuations, it’s intriguing to observe that this trend has been significantly driven by earnings growth. As the market anticipates the upcoming quarterly results, any unexpected surprises in the form of better-than-expected earnings growth could fuel the rally.
However, it's important to note that while historical trends can provide valuable insights, they do not guarantee future performance. Thus, investors should exercise caution and avoid investing in companies with lower-quality metrics such as balance sheet strength, cash flow robustness, or management credibility. Given the high valuations of benchmark indices, expected lower liquidity due to potential sidelining by Foreign Institutional Investors (FIIs), and increased regulatory scrutiny, investing in stocks without solid earnings backing could be similar to skating on thin ice.
Technical Outlook
_1711623695.png)
In the past week, the Nifty50 showed a notable upswing of 1.04%, closing at 22,326.90. The index surpassed its previous strong resistance of 22,220 and inched higher with strong momentum. The rally was supported by all sectors, with only Nifty IT ending lower by 3.1% for the week. Notably, even the midcap index exhibited a strong recovery with renewed strength in the broader Indices.
This rally was largely fueled by the US market which boosted the confidence in the domestic market. The decline in India VIX, a measure of market volatility, enhanced the bulls resulting in a positive market outlook.
Technically, the Nifty50 maintains its position above the 20 and 50 Simple Moving Averages (SMA) with the Relative Strength Index (RSI) standing around 57 levels. The support level has now shifted higher towards 22,000 followed by 22,100 while the next resistance stands around 22,750 levels.
22nd March, 2024
Silver Can Outshine Your Portfolio
Two weeks ago I wrote about adding gold to your portfolio. This week it has surged to new all-time highs. Gold is not alone in its rally it is likely to be joined by silver too.
Silver presents a compelling investment option in the present macro-economic environment, volatile and broadly overvalued equity market.
This white-grey metal offers robust protection against inflation as well as downside risks due to its high utility and store of value. While its price often moves in tandem with gold, silver tends to be more volatile. With the current uptrend in silver’s price, it is also expected to reach at all-time high level soon.
India is a net importer of silver, ranking among the top five countries in global silver consumption. While silver imports in the country reached a record 9,450 tonnes in 2022, they declined to 3,475 tonnes in 2023 due to a higher base effect and post-lockdown stockpiling. However, optimism among traders in 2024 suggests a potential rebound in demand leading to higher imports.
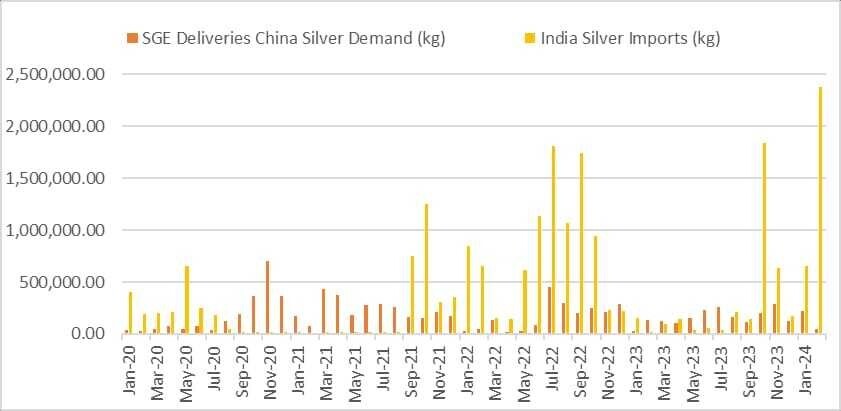
In February 2024 India imported a record level of 2,200 metric tons (70.7 million ounces) of physical silver. Over half of the silver demand comes from industry as it has highest electrical and thermal conductivity of all metals. Buoyance in sectors like solar, semiconductor chips and development of electric vehicles which use lithium-ion-batteries are going to stimulate industrial demand and lead to price appreciation of silver.
Apart from this, in the recently concluded Federal Open Market Committee (FOMC) March meet interest rates have been kept unchanged at 5.25-5.50%, but the Fed Dot Plot suggests a possibility of three rate cuts later in 2024. This has led to surge in the demand for safe heaven assets worldwide. Many central banks have also started to pile up precious metals in their portfolio.
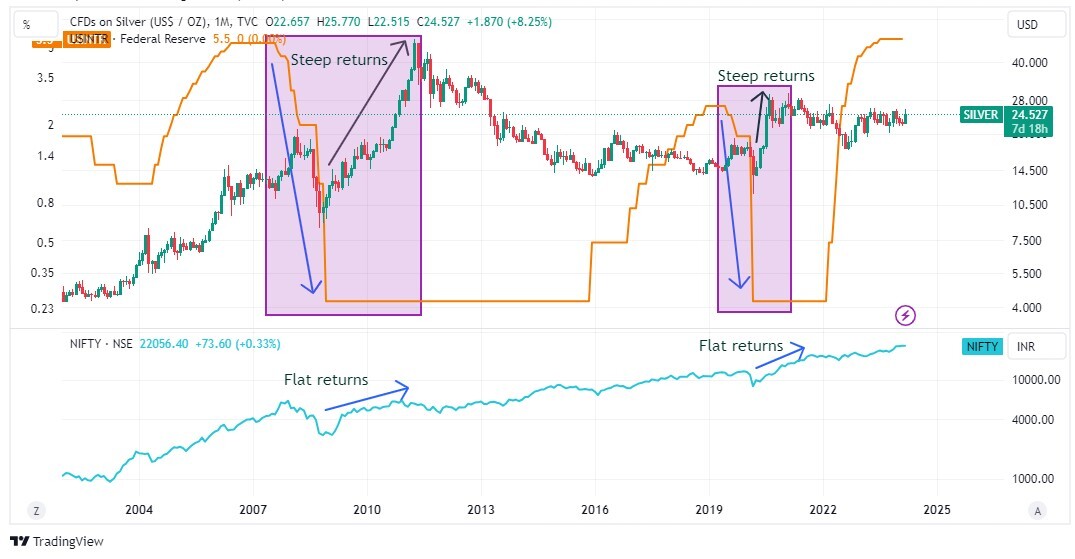
Silver has historically demonstrated a negative correlation with interest rates, a rate cut will possibly lead to increase in silver price. Market is forward looking. It has already started discounting future rate cuts leading to a surge in silver prices.
The chart depicting historic movement of silver CFD and US Fed Interest rate is presented below:
If we compare absolute returns of silver in INR with the NIFTY 50 index price returns over 1 year, 2 year and 3 years post rate cut, we get the following position:
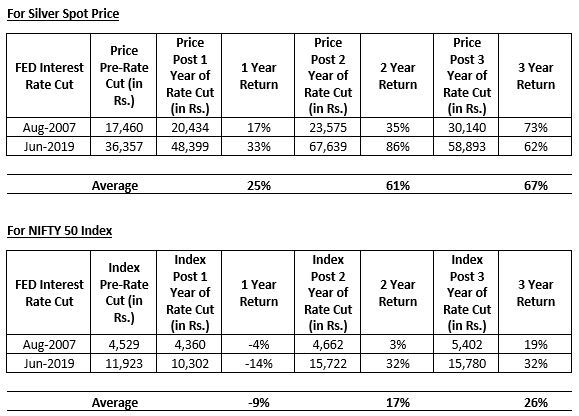
We can acknowledge that in each instance silver has outperformed the returns of NIFTY 50 index.
Silver prices also demonstrate an inverse relationship with US Dollar. A strengthening dollar often correlates with lower silver prices, and vice versa. With US Interest rates already at its peak the dollar has limited chances of strengthening from here. Applying the purchasing power parity logic if the value of USD decreases, then to purchase same quantity of silver more money needs to be spent, thus a rise in silver price.
_1711109654.png)
Last but not the least is the silver price itself. Silver is trading more than 50% below it’s all time high of US$ 49.8/ounce marked in 2011. In rupee terms silver is trading near all-time highs simply because of rupee depreciation. You can imagine what would happen if silver fires up in international markets.
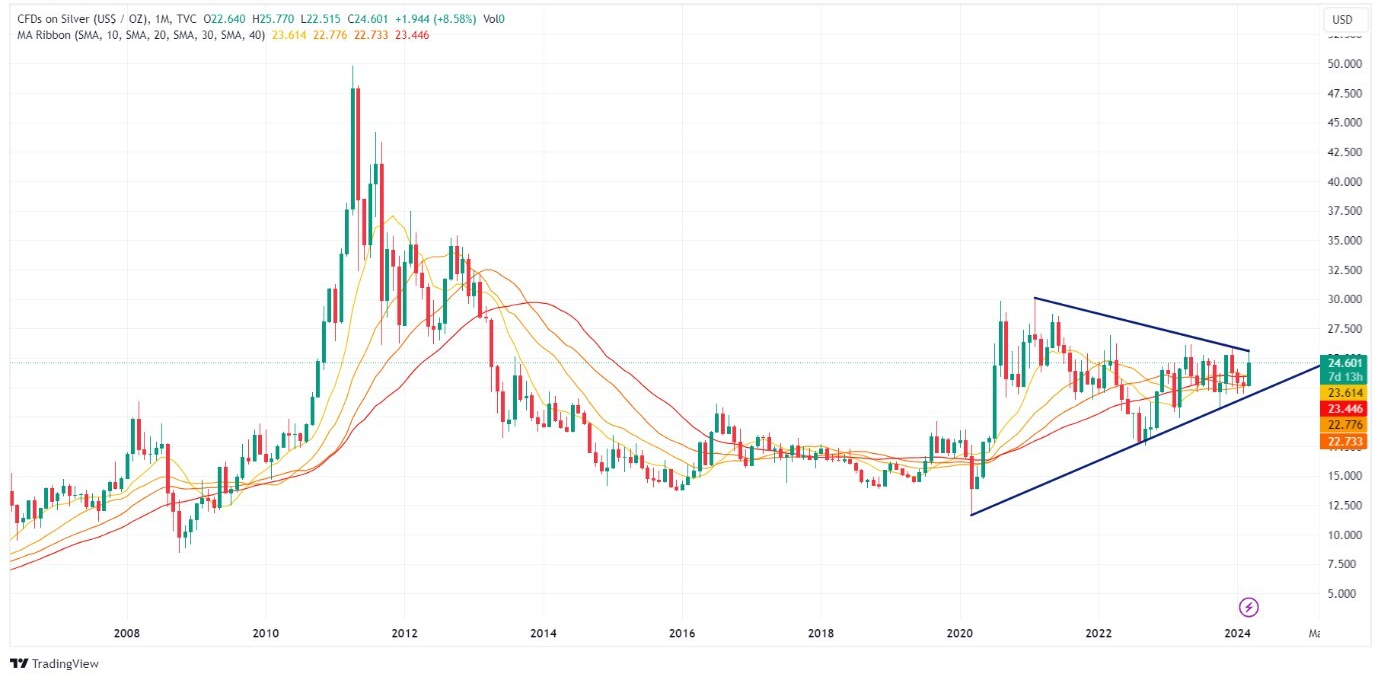
Considering all of the above points it seems it is ripe to add silver to your portfolio.
Technical Outlook
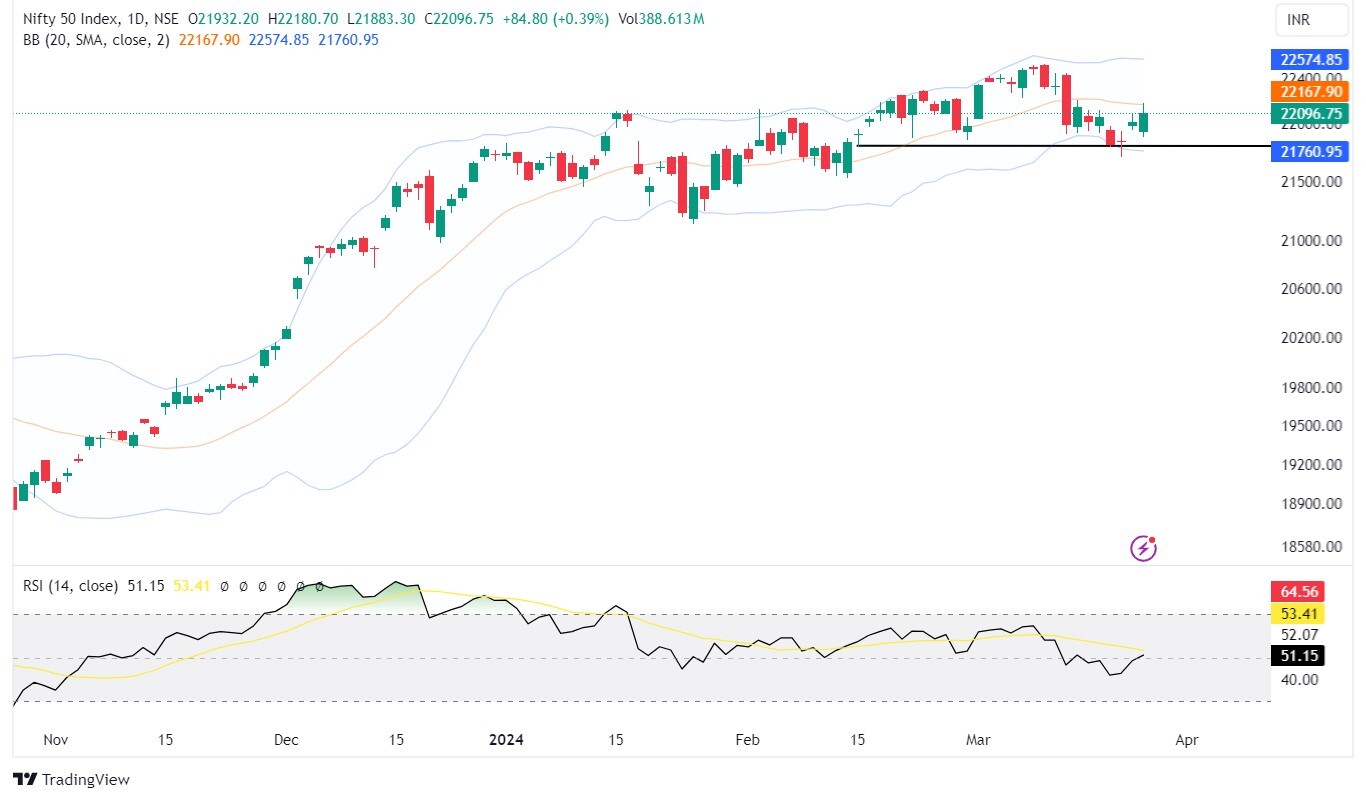
The Nifty recovered from lower levels, ending with a gain of 0.33% at 22,096.75 in the last week.
All the sectors participated in the upward movement except Nifty IT which tumbled nearly 6%. This rally was largely fuelled by the US market reaching record highs, boosting confidence in the domestic market.
Technically Nifty rebounded from the lower Bollinger band and managed to close above the 50-day moving average (DMA) and closing well above the crucial 22,000 level further strengthened the bullish sentiment. The Relative Strength Index (RSI) also recovered from lower levels and is now holding steady at around 50 levels, indicating a balanced market sentiment.
The decline in India VIX, a measure of market volatility, enhanced the bulls resulting in a positive market outlook.
Looking ahead, major support for the Nifty is expected around the 21,800 level while resistance is seen around 22,350 for the upcoming week. The specific performance in stocks will play a crucial role in driving the market's direction in the coming days.
15th March, 2024
What Wounded Investors Must Do Now
Indian Stock Market has witnessed a massive fall in the last one month. The selling pressure has aggravated this week especially in the broader market stocks which is not reflected in the benchmark indices Nifty and Sensex.
Nifty is down only 2.35% from its all-time high of 22,526. However, when you look beneath the hood you know what’s ailing the market.
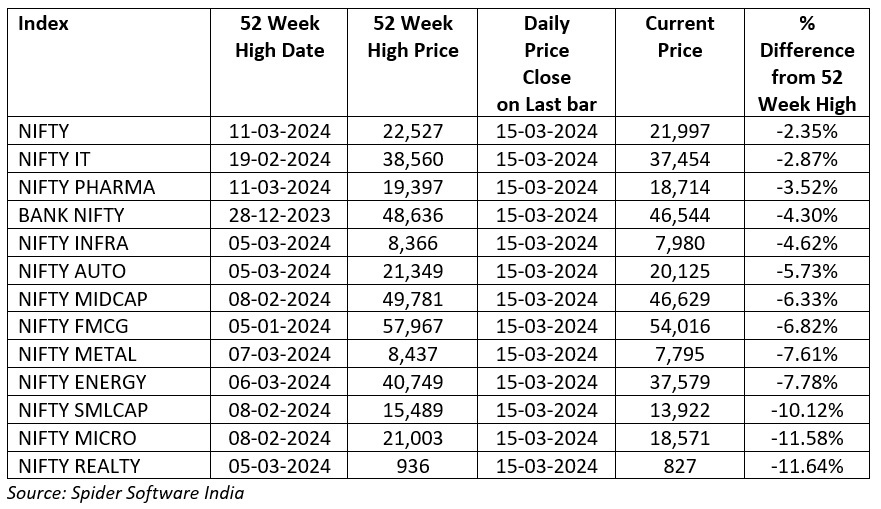
Nifty Smallcap index tracks the top 251 to 500 companies by market capitalisation and Nifty Microcap index tracks the top 501 to 750 companies. These indices are down 10% and 11% from their 52 week highs. Individual stocks in these indices are down much more. Stocks from these indices are where retail investors generally have maximum exposure. If you are wondering what to do now that your portfolio is deep in the red then here’s a template you could follow.
A stock which falls more than 20% from its highs is considered to be in a bear market. Technical definitions aside…a stock that falls 20% will need to move up 25% to recover losses. As the fall increases further chances of recovering these losses become thin. You need a 100% gain to recover a 50% fall…you get it right.
You can keep a threshold of 20% fall from the highs. If a stock in your portfolio has fallen more than 50% from its highs then it’s time to eat the humble pie and book your losses.
Here’s what the data of top 746 companies by market capitalisation suggests…
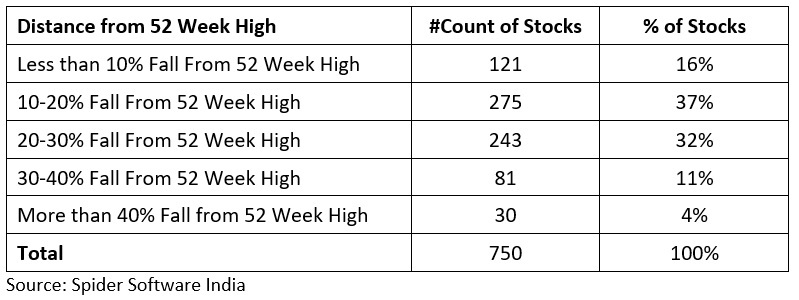
Out of 750 top stocks only 121 stocks are currently trading within 10% of their 52 week highs. This is 16% of the total. If majority of the stocks you hold are in this bucket then you are the lucky one. Continue to hold them in your portfolio. These are the likely candidates to lead the next up move.
275 stocks are currently trading within 10-20% of their 52 week highs. This is 37% of the total. Stocks from this bucket do stand a fair chance to bounce back and lead from the front. But one must watch out for stocks which slip below the 20% mark.
There are a total of 243 stocks which are down anywhere between 20-30%. These are the ones which have just accepted defeat. It’s better to exit these before the damage increases.
A total of 81 stocks have slipped between 30-40% from their 52 week highs. These stocks were probably under pressure much ahead of the other stocks. They are already in a down trend and shorting candidates for bears on a bounce back.
Finally, 30 stocks are down more than 40% from their highs. If you hold any of them then it’s best to exit them at the first instance. These are probably not seeing the light at the end of the tunnel any time soon.
Now this isn’t a foolproof way to remove the weeds from your portfolio. It won’t guarantee best results. But this is good enough for common retail investors to decide what to do with their portfolio.
Professionals look at several other factors apart from % fall from 52 week highs to decide what to do with stocks in portfolio. But retail investors don’t have all the time and resources to do the same. Hence, this would be a better and easily applicable framework.
Technical Outlook
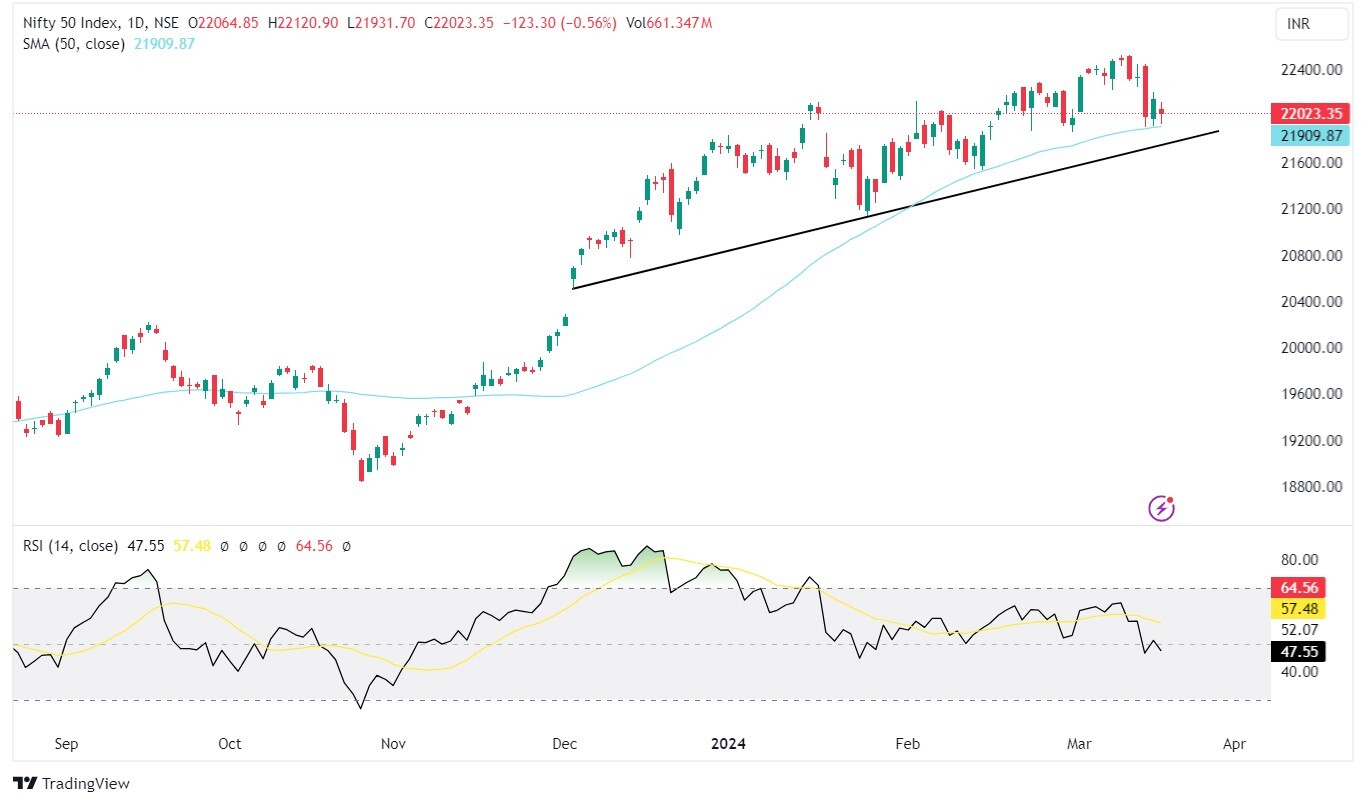
The Nifty concluded the week at 22,023, marking a decline of 2.09% during the previous week. Most of the sectors have collapsed, with Nifty PSE, CPSE, and Realty being the worst hit, declining by nearly 9-10% in just one week while Nifty IT ended with a gain.
In the daily time frame, Nifty fell below the rising trendline and the 20-day moving average (DMA). The 22,000 level remains a crucial threshold, as bulls aim to maintain this level while bears attempt to push the index below it.
The next important support level remains at 21,800 followed by the 21,700 level with resistance placed at 22,350.
It is worth noting that the primary trend has slowed down but has not yet changed.
The US Indices also appear to be in an overbought zone, indicating a potential correction. Investors are mindful of this situation. The impact was felt in small and mid-cap segments affecting market sentiment. However, FMCG and IT may perform well after experiencing excessive sell-off, and a healthy pullback is anticipated in the upcoming sessions.
7th March, 2024
Invest In Gold In 2024 For Turbocharged Returns
The word “Gold” buzzes in everyone’s mouth as its prices are soaring daily and with the ongoing wedding season, everybody is re-evaluating the decision of buying gold. It not only glitters when used as an ornament but also extends its charm to strengthen the portfolio of an investor.
Since this Valentine's Day, the bullion has risen by almost 4.9% breaking the previous highs of US$ 2065.6 per ounce, and is gearing up for a further up move.
Despite such a move, investors can still plan to add this yellow metal to their portfolio for these X reasons at the moment:
Fed initially increased interest rates to curb inflation and made gold unattractive. This resulted in investors moving to other fixed-income instruments as they offered better yields. But now it seems the party is over for bonds.
The below ratio chart displays Gold (US$/OZ) over the US 10-year Government Bonds Yield. The ratio is currently placed near 10 year lows. This indicates that the days of underperformance of Gold and rising bond yields could end soon. Gold could outperform bond yields from here.
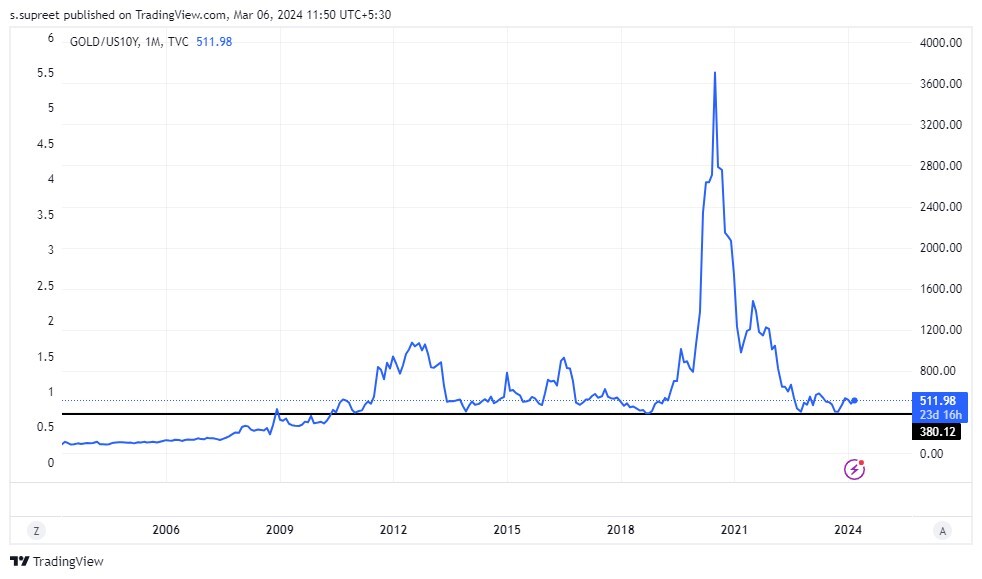
In the current economic scenario, expectations of imminent interest rate cuts by the Fed have ignited a rally in gold prices, signaling a shift in market sentiment towards the precious metal. The trend of rate cuts and the gold price rally has been fascinating.
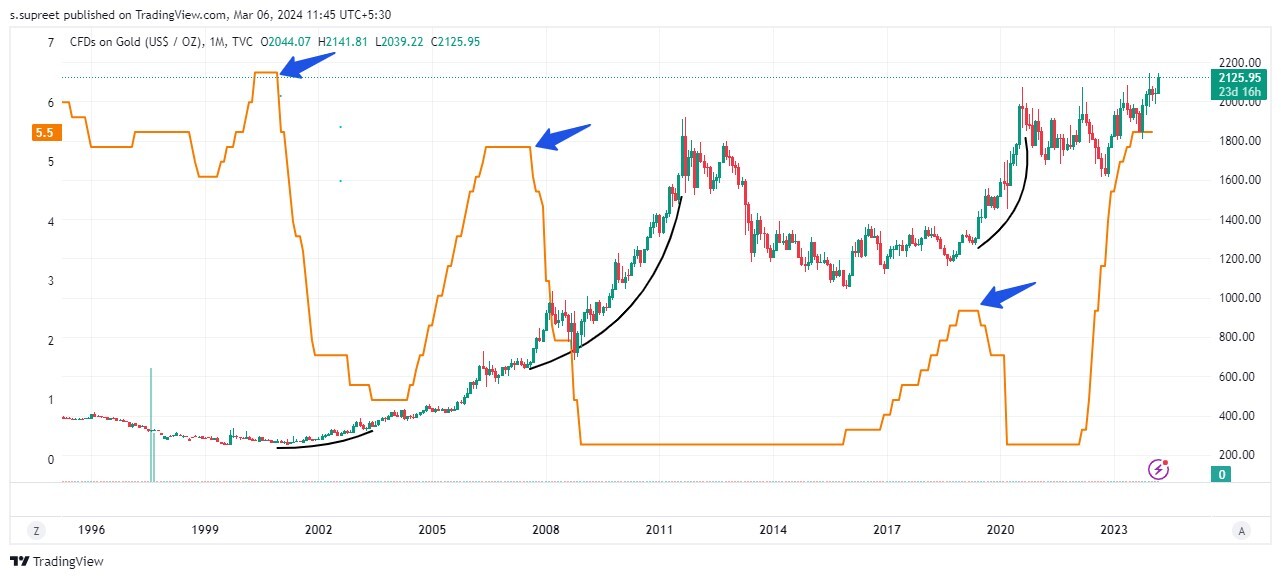
Here’s how gold prices in US $ terms reacted to the rate cuts in different time frames:
_1709811062.png)
Interestingly, the same data when presented in INR terms the returns are even more elevated.
_1709811060.png)
*Prices for Dec-00 are considered from World Gold Council data.
**Prices from MCX-Gold
Let us now check whether Sensex has delivered such kind of returns during the same period.
**Prices from MCX-Gold
Let us now check whether Sensex has delivered such kind of returns during the same period.
_1709811061.png)
Certainly, there is a clear indication that the Sensex has consistently lagged in returns compared to gold, and this difference is substantial across various periods.
As mentioned earlier the gold rally of just 4.9% in a few trading days is just a sign of bigger things to come.
The dollar index and the price of gold are inversely proportional to each other. Interest rate cuts make the dollar-denominated assets less appealing - weakening the dollar index. As a result, investors start diverting their funds to these stable assets propelling the prices higher.
The below chart confirms the nature of the relationship between gold and the dollar Index:
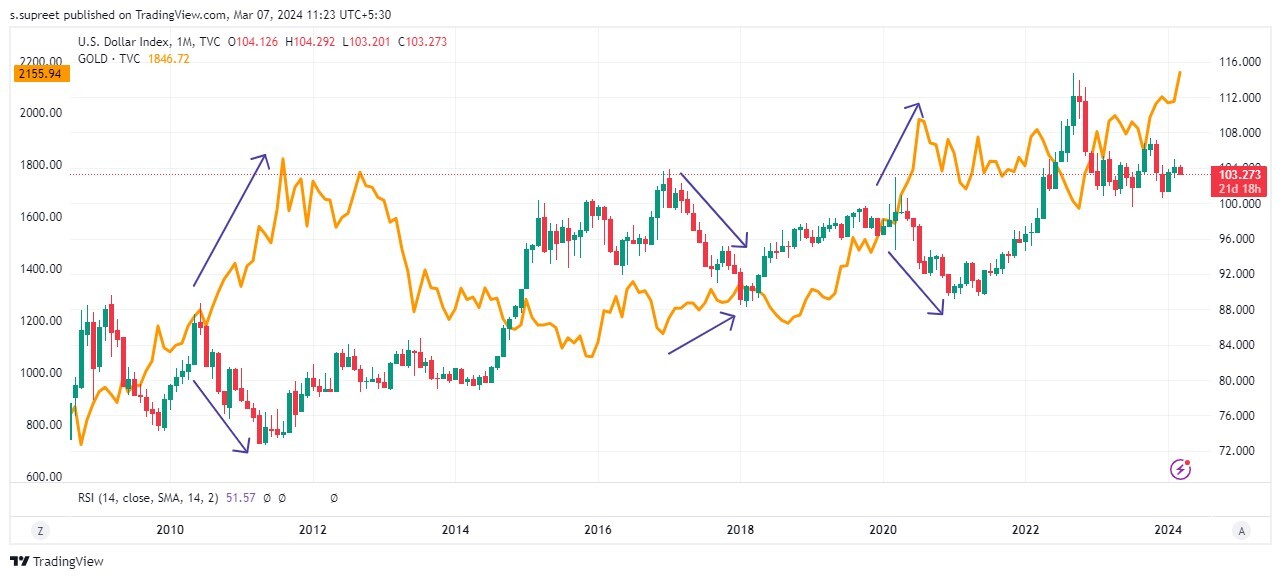
Additionally, the geopolitical unrest across the countries is making investors flock to safe-haven assets like gold. Regardless of currency fluctuations or election-related uncertainties, gold serves as a hedge for investments.
Even globally the Central banks are increasing their gold reserves significantly. The decisions of these institutions to buy/sell gold impact the metal's price and serve as an indicator of broader economic sentiments.
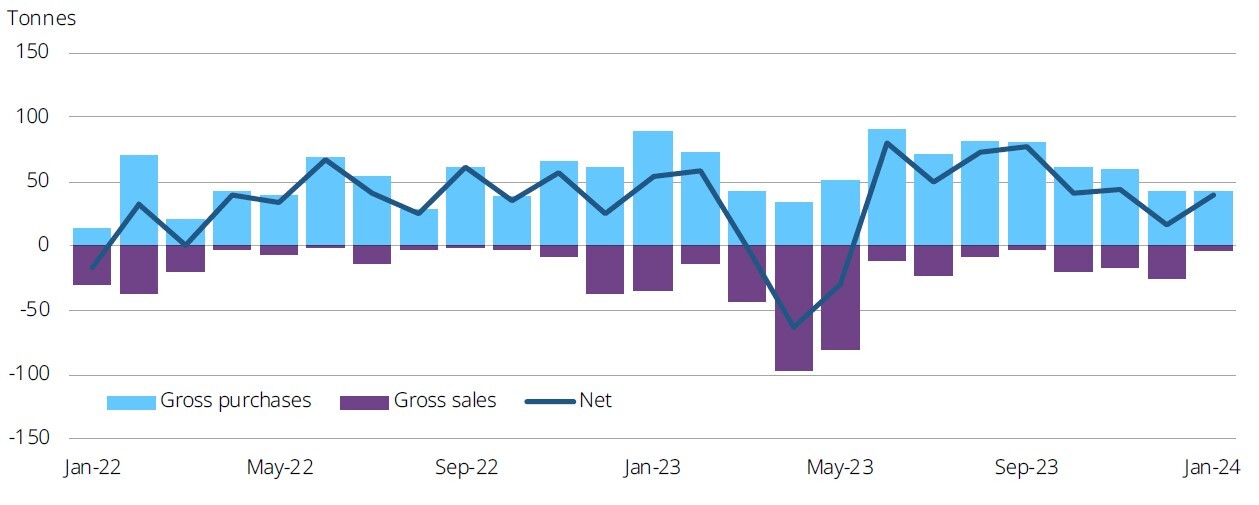
*Data to 31 January 2024 where available.
Source: IMF IFS, respective central banks, World Gold Council
Source: IMF IFS, respective central banks, World Gold Council
Growing demand for gold in industries like space, healthcare, and semiconductor manufacturing, beyond its traditional use in jewelry, is expected to rise significantly. This expanding industrial demand may strain the gold supply, potentially impacting its prices.
Amidst global economic uncertainties, gold emerges as a beacon of stability and opportunity. Its in-built characteristics provide a hedge against inflation, geopolitical tensions, and currency fluctuations making it a prudent choice for investors seeking to safeguard their wealth and achieve financial freedom. Investors must add gold to their portfolio as this is the best time to add some glitter to their portfolio.
Technical Outlook
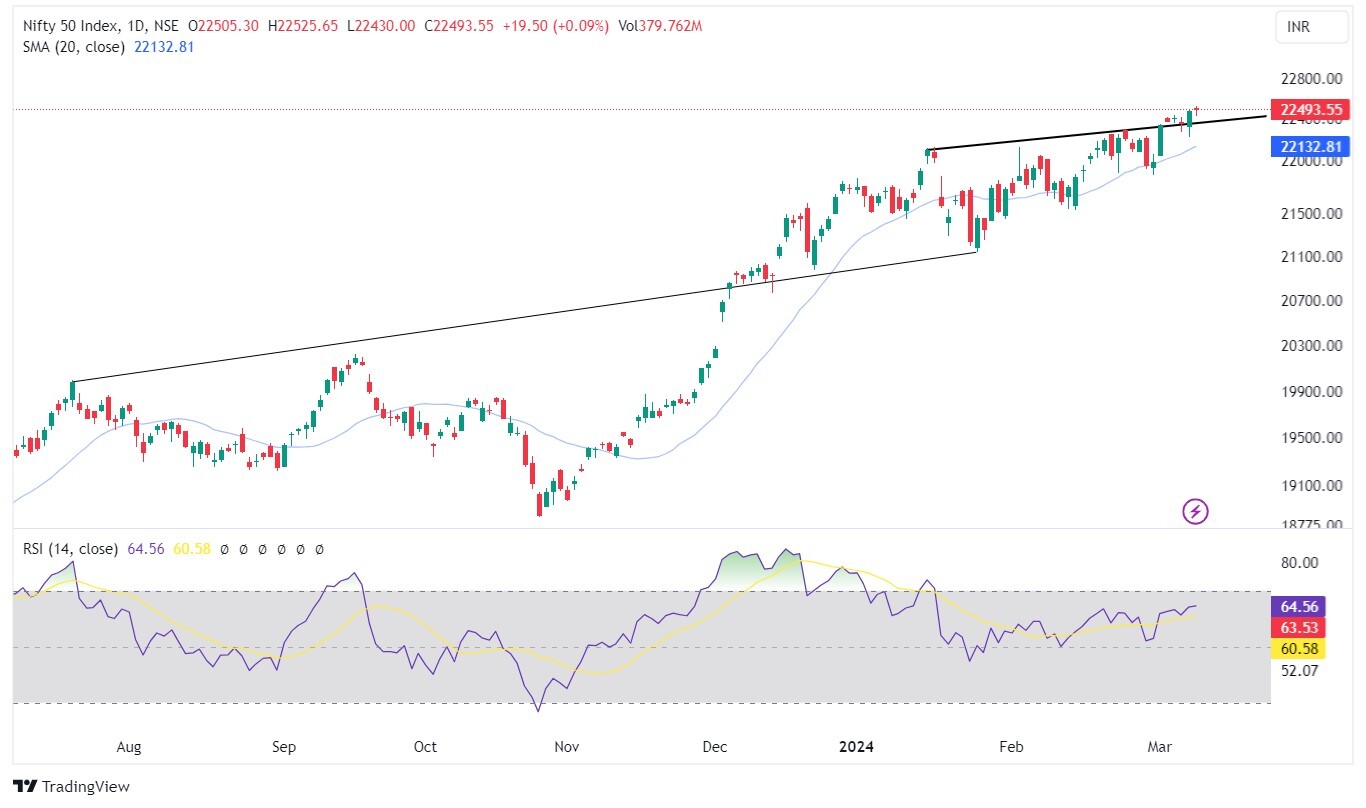
Nifty maintained its supremacy in the past short week, securing a 2.26% gain to close at 22,493.55. Notably, all sectors contributed to this upswing while Nifty Metal, PSU Bank and PSE surged the most. The robust global market especially the US Indices, bolstered the domestic bullish sentiment. However, caution is advised regarding mid and small-cap stocks as they have remained subdued.
Technically, Nifty continues to form higher highs and higher lows and is holding above its key moving averages. The RSI is gradually rising and holding the 64 level, highlighting the positive momentum. The support remains at 22,200 levels while resistance remains at 22,700 followed by 22,850 levels.
This strong bull market implies that any dip can be viewed as a buying opportunity, and though the primary trend may slow down, a significant change is not imminent.
This is a strong bull market; any dip can be used as a buying opportunity. The primary trend might slow down but it is unlikely to reverse soon.
1st March, 2024
Time to Switch Over to Risk-off Mode!
Jason Zweig quoted in his book The Intelligent Investor…The market is a pendulum that forever swings between unsustainable optimism (which makes stocks too expensive) and unjustified pessimism (which makes them too cheap).
The Intelligent Investor is the one who knows when to take risks and buy shares when there is pessimism…and avoid risk and sell shares when there is optimism.
After COVID, markets were in a risk-on mode fueled by cheap liquidity. Low interest rates prompted investors to give up safe assets and take risks to earn higher returns. The valuations too went through the roof.
However, it seems that now it’s time to switch back to risk-off mode. Here’s a ratio chart of MCX Gold to CNX 500 which is at an interesting juncture.
Gold is a proxy for safety or risk-off mode while CNX 500 is a proxy for the broader markets and risk-on mode.
When the ratio is falling it means we are in a risk-on mode as equities are outperforming gold. When the ratio is rising it means we are in risk-off mode as gold is outperforming the broader market index.
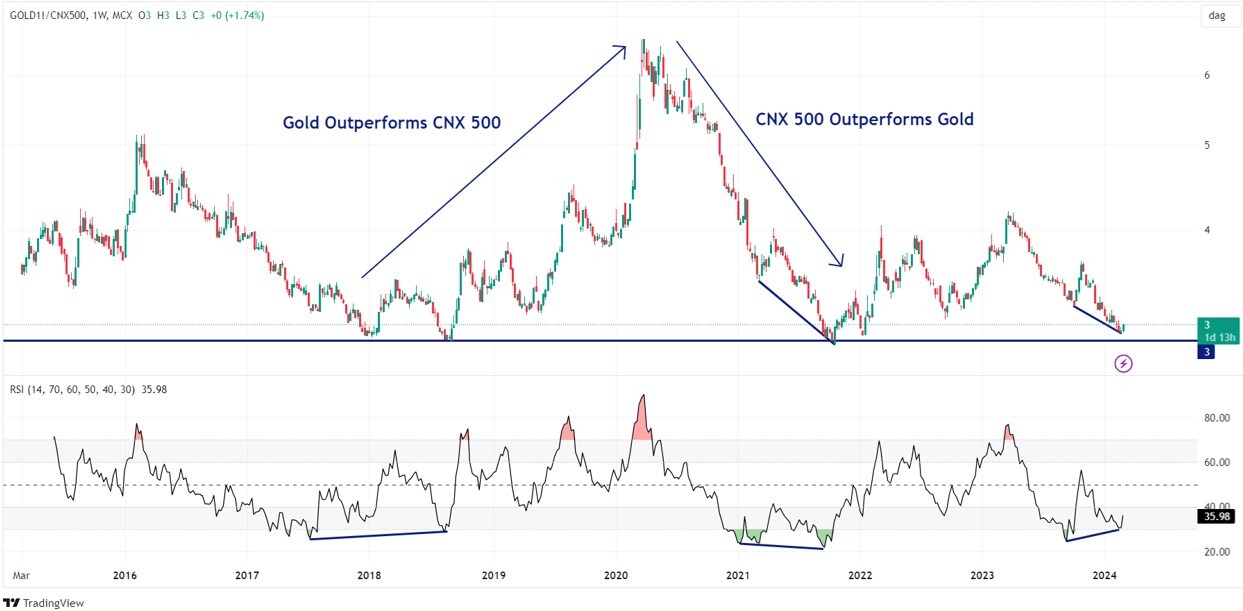
This ratio is currently placed near an all-time low of 3. It means that the chances of reversal in the ratio are high. The weekly RSI is also showing divergence.
We are now entering a phase with higher volatility due to elections. Valuations in the broader market too are not very comfortable.
Small-cap & Midcap have shown significant performance since Covid lows, especially over the last year. Currently, both Nifty Small & Midcap indices are at their highest price-to-book levels seen in a decade. Below is the Price to book value ratio chart of the Nifty small-cap 250.
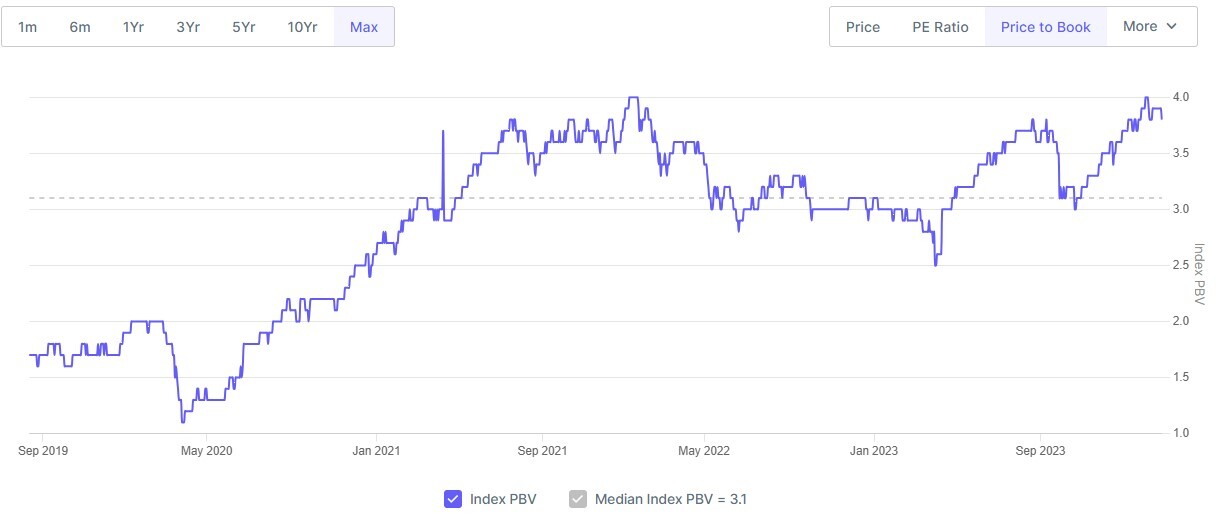
During a “risk-on” environment, small-cap and mid-cap stocks are preferred by investors which pushes up their valuations. When the investors expect uncertainty in the market they switch from aggressive sectors like small and mid-cap to defensive sectors like Pharma and FMCG.
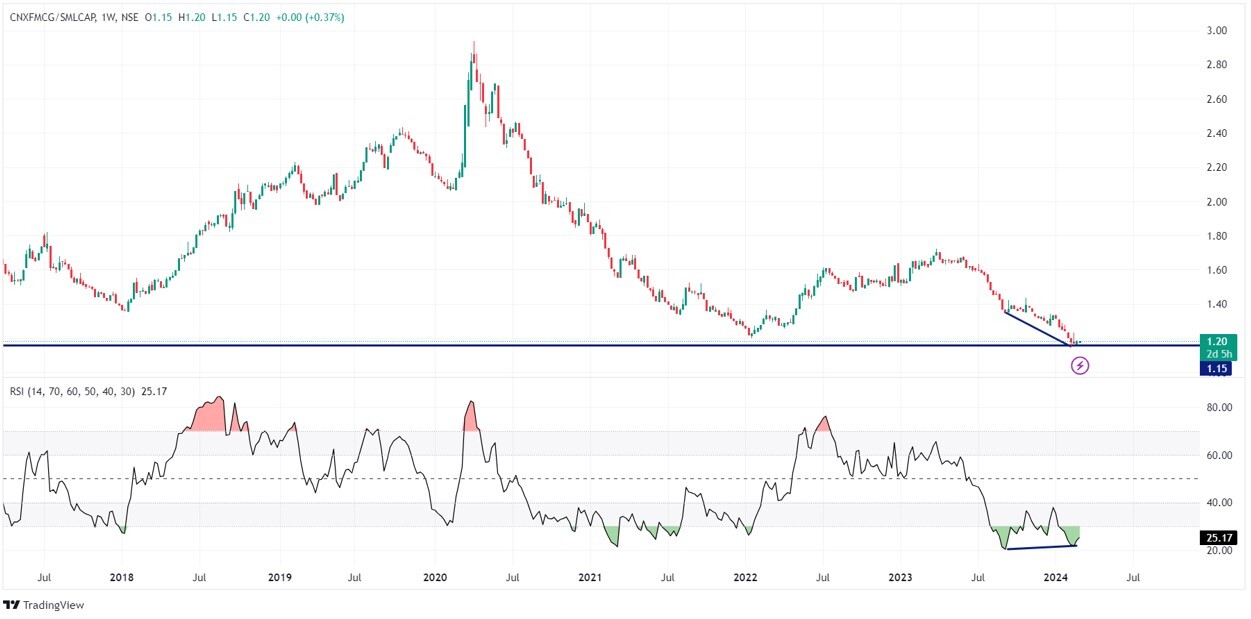
Now here’s a ratio chart of Nifty FMCG to BSE Small-cap. The FMCG index has underperformed the BSE small-cap index since April 2020.
The ratio is now taking support at its 10-year low. This indicates that the defensive FMCG index might outperform the aggressive small-cap index. The RSI indicator also shows that the ratio is at an oversold level. It is forming a bullish divergence which suggests a reversal in ratio might be due.
And that’s not all in the past 14 years, the average returns of Nifty FMCG from March to July is 14.26% which is higher than the Nifty 50, S&P BSE Midcap, and S&P BSE Small-cap index returns of 7.19%, 9.18% & 10.70% respectively. In the past 7 out of 14 years, Nifty FMCG has outperformed Nifty 50, S&P BSE Midcap, and S&P BSE Small-cap index during the March to July months.
% Returns from March to July in each Calendar Year
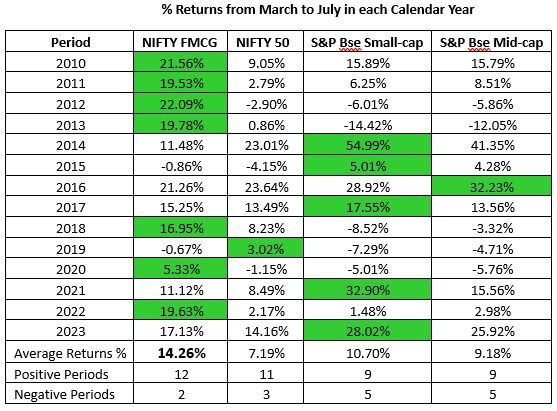
This indicates that if the markets switch over to risk-off mode now then FMCG stocks are likely to beat small-cap & midcap stocks.
Looking at the upcoming general election in India market is likely to be volatile. During such uncertain times, investors must switch over to risk-off mode and prefer safer asset classes like FMCG, gold, government securities, and large-cap companies with low beta.
Technical Outlook
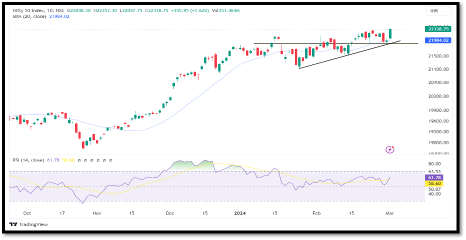
Nifty continued its upward trajectory, registering a gain of 0.57% in the previous week and hitting a new high of 22,353. On a month-on-month basis, Nifty saw a 1.18% surge in February. The Index surged last Friday, propelled by India's 8.4% Q3 GDP growth which catalyzed the sideways market.
The RSI stands firmly at the 61 level, indicating a balanced market. Support is placed at 22,050 levels while resistance is noted at 22,550 followed by 22,650 levels.
Technically, the Nifty's primary trend remains positive concluding the third consecutive week with gains. Despite Nifty IT's underperformance, the overall sector has shown rotational participation. However, mid and small-cap stocks have remained undertone, prompting caution against excessive exposure to them.

 Easy & quick