

Stock Market Updates for May, 2024
24th May, 2024
Nifty Poised for Bullish Run in the Next Month!
Foreign Institutional Investors (FIIs) have been consistently selling in the Indian markets, withdrawing their funds for 11 consecutive days. In fact, in May’24 alone, they have pulled out Rs.27,938 crores, marking the highest monthly outflow since January’23.
But, how are Indian markets affected by this?
Historically, it has been observed that whenever FIIs have net withdrawn for 10 or more consecutive days, the Indian markets tend to fall. Since 2010, there have been 24 instances where FIIs have pulled out money for 10 or more successive days during which the Nifty50 index has fallen 17 times. However, the markets have held the ground considerably this time, falling only 0.80%.
Amongst these 24 instances, there are 13 instances where the Nifty50 index remained stable, i.e. delivering a positive return or falling not more than 2% despite the relentless FII selling. The table below enumerates these instances, consecutive days of outflows, total outflow, and the Nifty returns during this period.
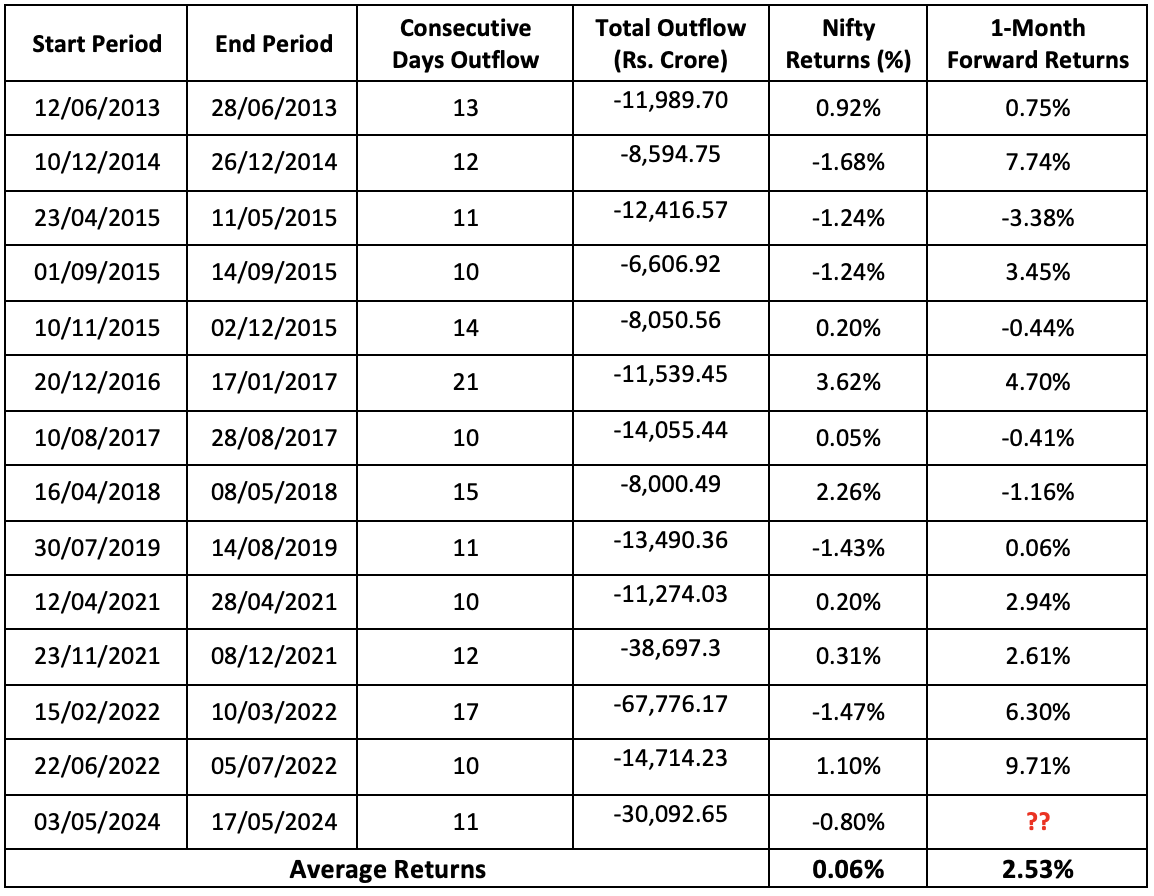
On further analysis, we find that whenever FIIs have withdrawn for 10 or more days and the Nifty50 index has remained stable, it has delivered an average one month forward return of 2.53%.
Furthermore, since the beginning of the 21st century, there have been four Lok Sabha general elections in India, occurring in the years 2004, 2009, 2014, and 2019. An analysis of the Nifty50 index's performance following the announcement of election results reveals a noteworthy trend. The data, summarized in the table below, indicates that the Nifty50 generally experiences a rally after election results are announced, with a notable exception in the year 2004.
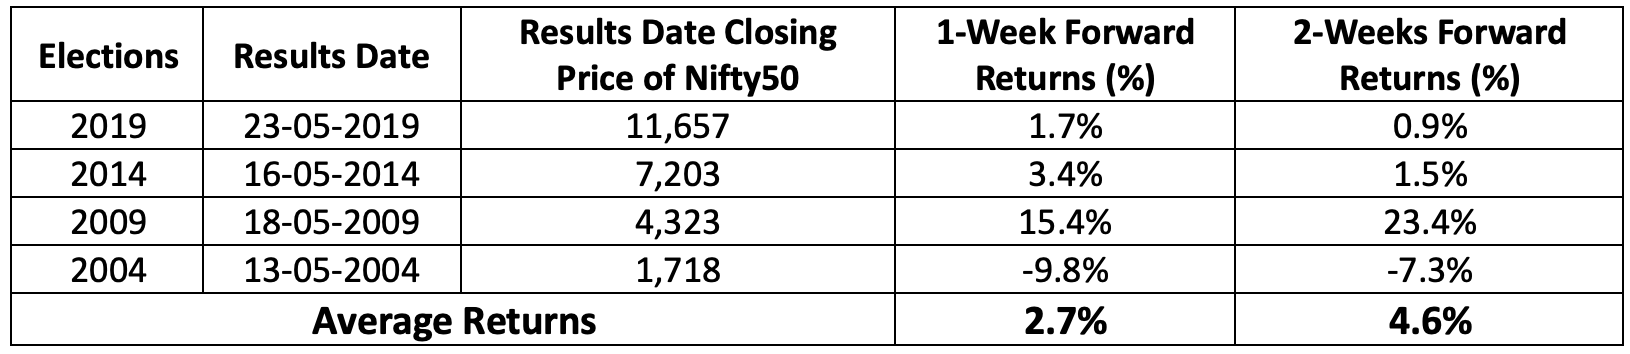
On average, the Nifty50 has delivered 1-week and 2-week forward returns of 2.7% and 4.6%, respectively. This period also coincides with our analysis of the Nifty50 rising after a period of relentless FII selling. It remains to be seen how much the Nifty50 rallies this time around.
Technical Analysis:
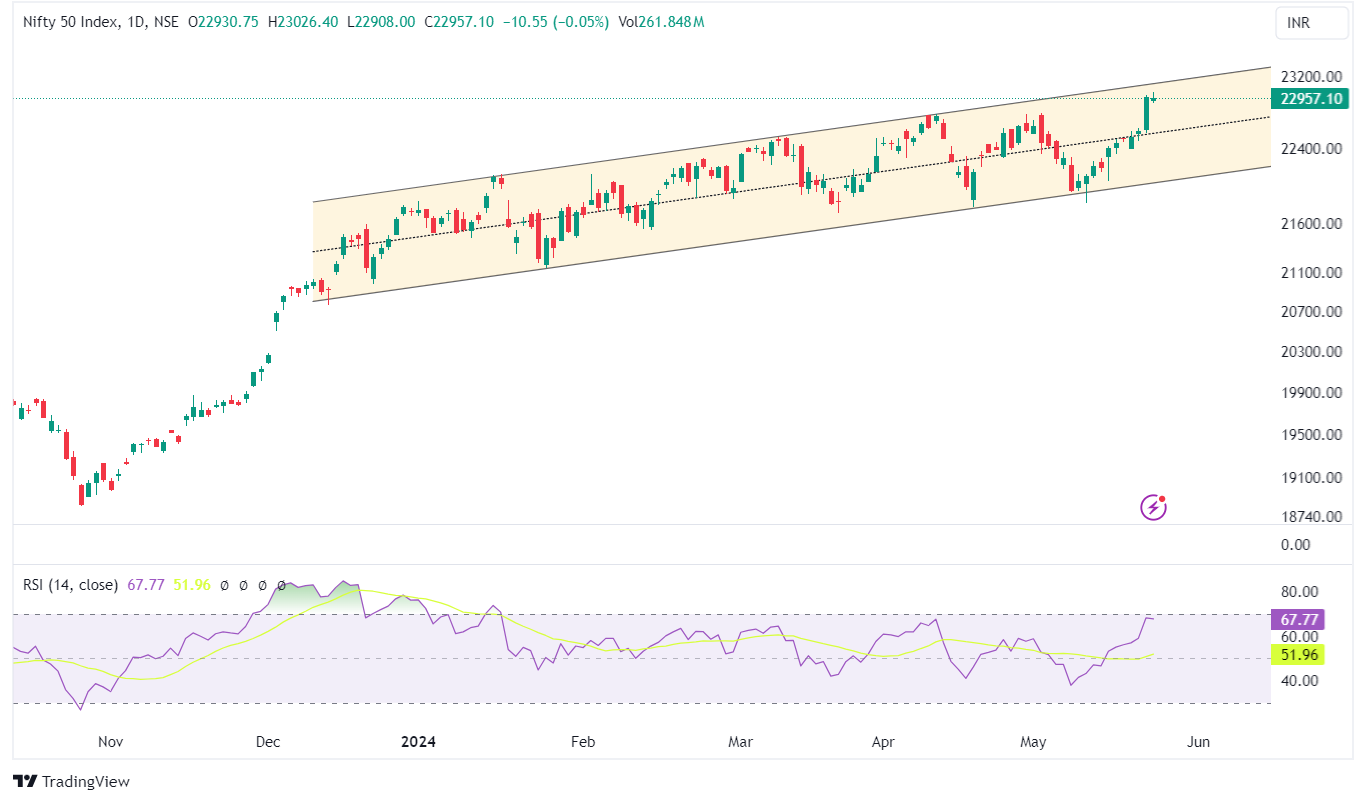
The Nifty50 reached an all-time high of 23,026, marking a positive week as it surpassed the major hurdle of 22,800 to end the session at 22,957, gaining nearly 2% for the week. The robust performance of US and European markets acted as a catalyst for the domestic market's surge.
The India VIX, known as the fear gauge, ended at 21.79, a 6.16% increase over the week, marking the fourth consecutive week of rising VIX levels. Nifty CPSE emerged as the best-performing sector with a gain of 4.83%.
Nifty formed a bullish candle with an open-low same pattern on the weekly chart. Looking ahead, Nifty has strong support at the 22,600 level, and any minor pullback could present a buying opportunity around the 22,700-22,800 levels.
17th May, 2024
Trading Journal - The Most Underrated Risk Mitigation Technique
This week Finance Minister Nirmala Sitharaman was addressing brokers in BSE. She appealed to the exchanges to maintain stability and mitigate systemic risk to protect the retail investor. The regulators have done a fantastic job of protecting the investors. But the onus shouldn’t be theirs alone. As a responsible individual, you too must do a few things to protect yourselves.
The trading journal is an indispensable way to enhance one’s trading skills. It helps you systematically record all trades, which helps you identify your strengths and weaknesses, analyze trades, and create a strategy that will make you profitable. For every professional trader, a trading notebook is an essential tool that provides an organized method for evaluating and enhancing trading performance.
Here are some key advantages of maintaining a trading journal.
- It gives a complete picture
Maintaining a trading journal gives you a complete view of your performance by recording entries, exits, and positional sizing. With the comprehensive view, you can thoroughly examine your trading practices and tactics, making sure no aspect is missed.
- It helps plan and execute your trades easily
Trading journal help you to plan your trades by writing down predetermined entry and exit points. This planning lowers the possibility of mistakes by ensuring that every trade is carried out by a well-considered strategy.
- It helps identify what works and what doesn’t
Examining past trades helps to understand what works and what doesn’t in the market. Identify your winning strategy pattern and try to improve it by using various possible ways. This continuous feedback loop is essential to improving overall performance and your trading strategies.
- It helps keep your emotions in check
A crucial component of successful trading is emotional restraint. A trading journal will help you to identify your emotional triggers that cause an impulse action. It gives an opportunity to overcome your triggers and making logical trading decisions facilitated by emotional control.
- It helps you develop a system
Developing a robust trading system is necessary to survive and become profitable in trading. You can create a customized trading system as per your strengths and preferences with the aid of a data-driven approach.
Now you must have understood why maintaining a trading journal is necessary, I will give you a step-by-step guide to making a trading journal.
- Determine your trade in advance
Failing to plan is planning to fail. So, before entering into any trade it is essential to have a predetermined plan. Your trading strategy should have fixed entry and exit criteria, along with risk management guidelines, and profit targets. A well-thought-out plan acts as a road map, guiding you through the market's ups and downs.
- Record trade details
After executing the trade, one must record the date and time, entry and exit, positional size and stop loss (to keep a track of the risk you are willing to take), trade rationale, and outcome of the trade in a trading journal. This detailed record serves as the raw data for analyzing your trading performance in future. It lets you spot trends, track progress, and gradually improve your tactics.
- Note down your emotional and psychological factors while trading
It is essential to record your emotional and psychological behavior during every trade. Note your feelings (e.g. greed, fear, anxiety, confidence) and the factors that influenced your mindset (e.g., market volatility, personal stress). Understanding your emotions while trading helps in identifying triggers that lead to impulsive or irrational decisions. Upon identification of the patterns, one can find his/her way to overcome them.
- Consistent Analysis for Continuous Improvement
Frequent evaluations offer a methodical means of evaluating your performance. Continuous improvement requires reviewing your trading journal regularly. Every week, every two weeks, or every month, set aside time just to review your trades. Identify the pattern in your successful and unsuccessful trades. Evaluate the trades on the basis of risk reward, and win ratio, and compare yourself if you are beating the index or not. Identify effective techniques and improve them.
- Improve Performance Based on Past Data
The objective of keeping a trading journal is to leverage the information gathered to enhance performance going forward. Use the past data to identify different strategies that work in different market conditions. You can improve the consistency and profitability of your trading methods by methodically implementing these ideas.
If you start preparing a trading journal then I can assure you that your trading performance will improve. You will reduce your risk and improve your probability of success in markets and launch you on a journey to ace the index.
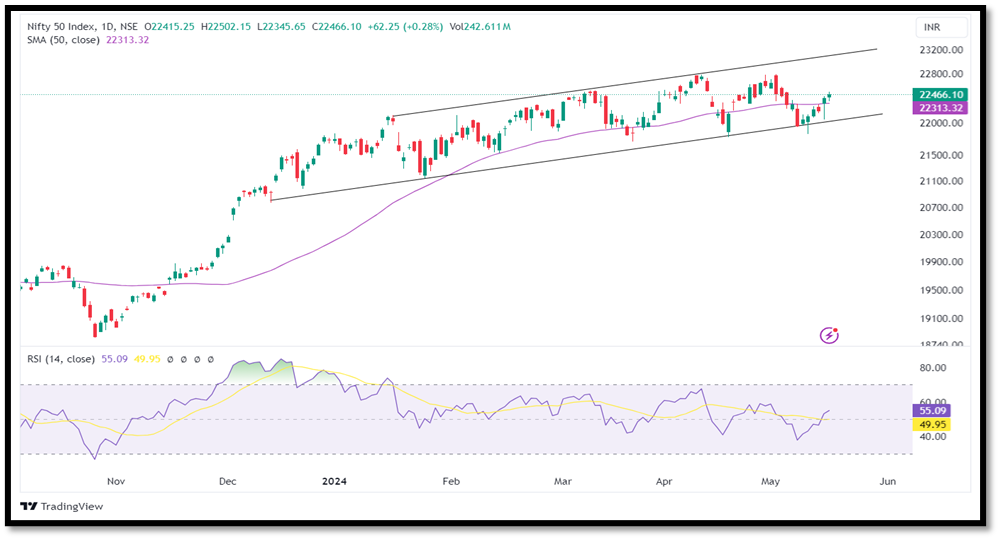
After making a low of 21,821.05 on Monday, the Nifty recovered throughout the week and ended the session at 22,466.10, gaining 1.86% for the week. The India VIX, known as the fear gauge, climbed nearly 7.17% to 19.80 over the week, yet there was notable participation from midcap and small-cap stocks.
Sector-wise, in the past week, Nifty Realty and Metal emerged as the best-performing sector with a gain of 6.60% & 6.47% respectively, while Nifty FMCG remained subdued, declining by 0.38%.
The Nifty has formed a piercing pattern on the weekly chart, strengthening the bullish momentum. On the daily chart, Nifty held above the 20-day and 50-day moving averages (DMA).
Looking ahead, Nifty has support at 22,200, followed by 22,050, while resistance is at 22,650, followed by the all-time high of 22,794.70.
10th May, 2024
Time to Take Chips Off the Table
Investing in markets and playing Poker has lot of similarities in terms of risk-taking, strategy, and uncertainty. In both, participants make decisions based on incomplete information, trying to anticipate and react to the actions of others. Both involve managing risk and adjusting tactics as the situation evolves.
In both poker and stock markets, taking chips off the table is crucial for managing risk and securing profits. In poker, when you're ahead, it's essential to "cash in" some of your winnings by withdrawing chips from the game.
Similarly, in stock markets, taking profits off the table involves selling a portion of your holdings when prices are favorable. This action not only crystallizes gains but also reduces exposure to market downturns or unexpected events.
Ultimately, both in poker and stock markets, the importance of taking chips off the table lies in maintaining a healthy balance between risk and reward. It's about securing gains while they're available and preserving capital to withstand inevitable downturns or setbacks.
I believe this is the right time to take some chips off the table. Considering the prevailing risks in the markets, I believe it would be better if investors reduce their exposure.
Some of these same data points are now hinting that the risk on the downside is high and it would be better to reduce exposure. Let’s check out these data points one by one.
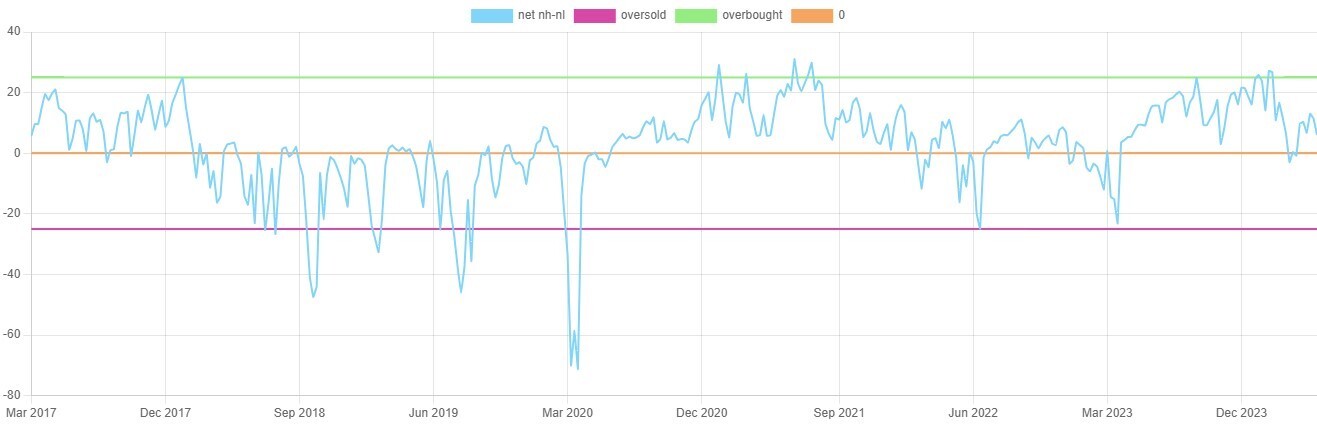
Here's a chart showing the net percentage of NSE stocks hitting new highs versus new lows. From a peak of 27.15% on February 5, 2024, the percentage of stocks reaching new highs has dropped significantly to just 6.02% by May 6, 2024. This means that even though the index has continued to rally and hit new highs the broader market stocks are unable to clock new highs. This is a sign of weakness.
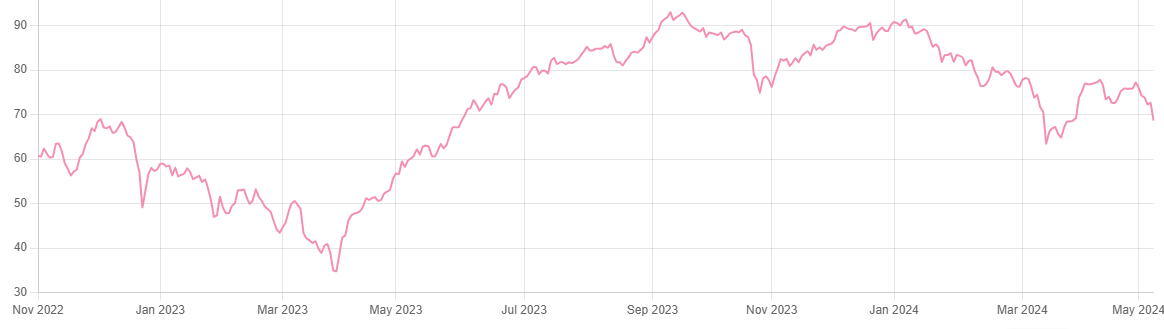
Here’s another data point. The percentage of stocks trading above their 200-day exponential moving average (EMA) has also dropped significantly, from a high of 91.42% on January 5, 2024, to currently below 69%. The 200 Day EMA is considered as a long-term indicator to gauge the trend of individual stocks.
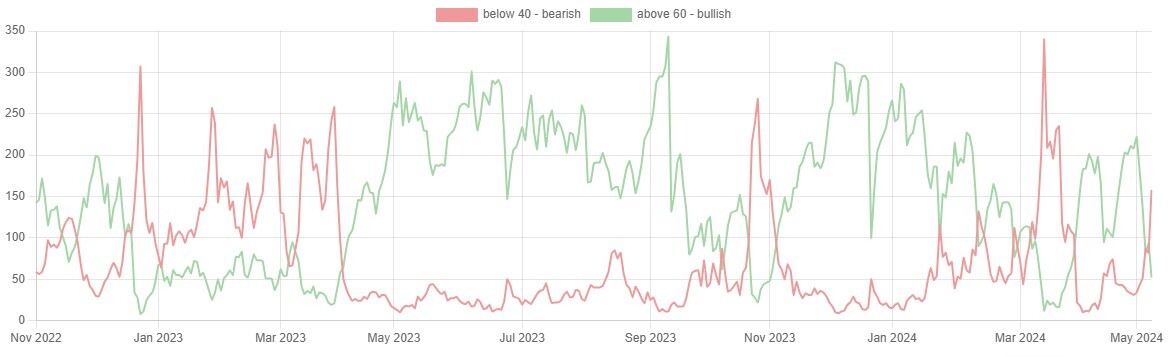
Let’s look at one more data point. Relative Strength Index (RSI) is a popular indicator used by many to identify whether or not a stock is in momentum. A stock is considered to be in bullish momentum if its RSI is above 60 and bearish momentum if its RSI is below 40.
There is a notable surge in the CNX 500 stocks trading below their respective 40 RSI. As of 9 May the number of stocks trading below 40 RSI was 158 compared to 52 stocks trading above 60 RSI.
The benchmark index has only fallen 3-4% from its life time highs. However, the data points mentioned above indicates underlying weakness suggesting that risk of staying long in the market is high.
So, what to do now?
Sell everything and run?
No, not at all.
Professionals would hedge their exposure by taking a position in futures and options. If you are a retail investor who don’t prefer this then one could shift to defensive stocks like FMCG and Pharma or cash out from risky stocks and move some portion to debt instruments.
Technical Outlook
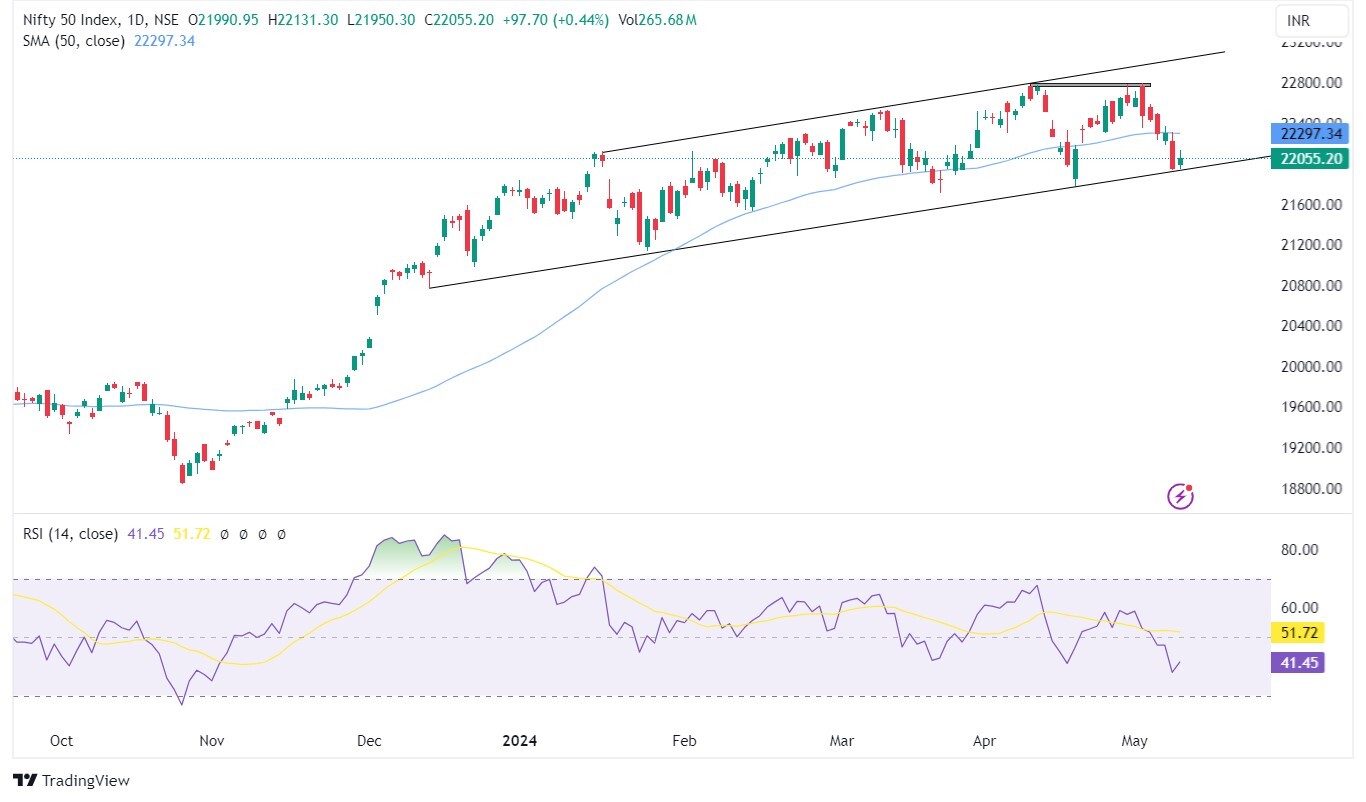
The Nifty oscillated over a broad range fluctuating nearly more than 650 points and concluded at 22,055.20, down by 1.87% for the week.
While the global market remained stable, it was the domestic market that remained fragile. The India VIX (18.47) has risen by nearly 26.37% in a week, highlighting the rising uncertainty in the market.
Nifty's breach of the crucial 22,000 support level has opened the door to further declines. The previous swing low of 21,777 remains the next important support level.
The negative divergence in daily RSI now exerts a notable impact on price action. The 20 DMA is tilting down and is on the verge of crossing the 50 DMA on the downside if it does, the market may experience a more intense sell-off.
The market might see minor pullbacks in the coming session but unless the index crosses the major resistance of 22,300 the short-term trend would remain weaker.
3rd May, 2024
A Step-by-Step Guide to Assess Corporate Governance for Retail Investors
Many novice investors tend to invest in shares solely based on price charts, where they miss a fundamental risk assessment factor. In recent months, there have been a few instances where stocks have fallen by double-digit percentages in a day on account of regulatory action.
Upon buying the equity share, investors effectively entrust their funds to management for the company's operations. Therefore, it is crucial to ensure that management decisions prioritize the best interests of shareholders, which underscores the importance of assessing good corporate governance within the company.
The separation of management and ownership within the company structure gives rise to an agency problem — the conflict of interest between the company's management and its stockholders. In numerous past instances, management decisions have prioritized personal benefit over minority shareholders' interests. Subsequently, when news surfaces revealing possible mismanagement within the company, share prices plummet.
To mitigate such risks, investors should scrutinize the following reports, which are indicators of corporate governance:
1. Secretarial Audit Report: This report highlights applicable laws and regulations, as well as significant events affecting the company's affairs, including any breaches of law or regulatory notices issued to the company.
2. Statutory Audit Report: In addition to expressing an opinion on the fairness of financial statements, this report may include a section on Key Audit Matters, emphasizing matters deemed crucial by the auditor and communicated with management and the Board of Directors. Emphasis of matter and Material Uncertainty over Going Concern paragraphs may also be included if necessary.
3. Internal Audit Report: This report evaluates the adequacy and operating effectiveness of internal controls within the company. However, management may restrict the scope of internal audits.
4. Corporate Governance Section of the Annual Report: This section outlines the composition of the Board of Directors, including the mix of independent and non-executive directors, managerial remuneration, the presence of a risk management committee, and its responsibilities, as well as the codes, policies, and frameworks deployed within the company.
5. Related Party Transactions: This report discloses transactions with entities in which management has a significant interest, ensuring transactions are conducted at arm's length prices and that there is no misallocation of company resources.
6. Legal and Regulatory Notices Filing with Stock Exchanges: Companies disclose notices received from regulatory authorities, detailing violations, supervisory actions, penalties imposed, and their impact on the company's operations. Additionally, the outstanding litigation section in offer documents provides details of ongoing cases against the company and its promoters.
Considering correspondence and notices from regulatory authorities becomes even more critical when investing in the Banking and Financial Services Sector, where public funds are at stake in the form of deposits, and the ability to conduct business depends solely on regulatory licenses.
Companies should establish robust policies and procedures to safeguard entity assets, including stringent internal controls for sensitive operations and a maker-checker supervision mechanism. These practices enhance investor confidence in management's ability to generate higher earnings, potentially resulting in the company being assigned a higher P/E multiple by the market. Furthermore, companies with good corporate governance practices may receive higher credit ratings, making fundraising activities easier.
An investor focused on long-term investments should never overlook lapses in corporate governance. Conversely, by closely monitoring the aforementioned indicators of corporate governance, investors with risk taking ability may identify potential management lapses and strategically take short positions ahead of market movements to their advantage.
Just as a prudent driver prioritizes safety, a savvy investor prioritizes corporate governance checks in investment decisions.
Technical Outlook
_1714737657.jpg)
The previous week, the Nifty index displayed a wide range of movements, showcasing considerable volatility. Despite reaching a new high at 22,795, profit booking led to a moderate gain, closing the week at 22,476, up 0.25%. The domestic market exhibited resilience even amidst a weaker global sentiment.
Nifty holds above the 50-day Simple Moving Average (SMA) while the Relative Strength Index (RSI) remains above the crucial 50 levels indicating positive momentum in the market.
However, a double top formation on the daily chart suggests potential short-term weakness. The Fibonacci retracement levels at 22,285 and 22,165 are anticipated to provide crucial support levels for the market in the coming week.
Sectorally, the Nifty PSE sector emerged as the top performer, surging by an impressive 3.94%. Conversely, the Nifty IT sector experienced a decline of 2.25%.
Short-term investors should be cautious due to the rising India VIX (14.62).
 Easy & quick