Stock Market Updates for October, 2024
31st October, 2024
AFPI Sell-Off and Market Corrections: Temporary Dip or New Trend?
After crossing the 26,000 milestone, the Nifty index experienced a downturn, falling by over 2,000 points from its peak within just one month, and is now trading below the 100-day simple moving average. In analyzing whether this decline signals the onset of a market downtrend and a shift to bearish sentiment among investors, we examined the market forces driving this selling pressure. As expected, Foreign Portfolio Investors (FPIs) are at the forefront.
As of October 29th, FPIs had net outflows on 19 out of the 20 trading days this month, totalling over Rs. 85,000 crores, with an average daily outflow exceeding Rs. 4,200 crores. Several key factors contribute to this consistent withdrawal, including uncertain macroeconomic conditions, the escalation of geopolitical conflicts, the outcome of the U.S. presidential election and the impact of new government policies on businesses, interest rate cuts, increasing demand for safe-haven assets, and the premium valuations of Indian equities versus deep value in Chinese equities.
However, unlike previous instances, the market is no longer heavily dependent on FPI flows, thanks to the rise of domestic institutional investors and the sustained inflow of domestic savings into the equity market through systematic investment plans (SIPs), alongside increased individual participation in the stock market. Throughout this recent FPI sell-off, domestic institutional investors and individual investors have largely been the counter-parties to these trades, leveraging the high liquidity available. This liquidity trend is expected to continue due to the surge in new investment accounts and demat accounts, coupled with declining bank deposit growth.
Selling pressure becomes a severe risk when all market participants rush to liquidate their holdings, but the current situation is far from such a scenario. Also, we need to note that markets do not move in one direction indefinitely; after a record rally, some correction and consolidation are healthy for resilience and can help pave the way for new targets.
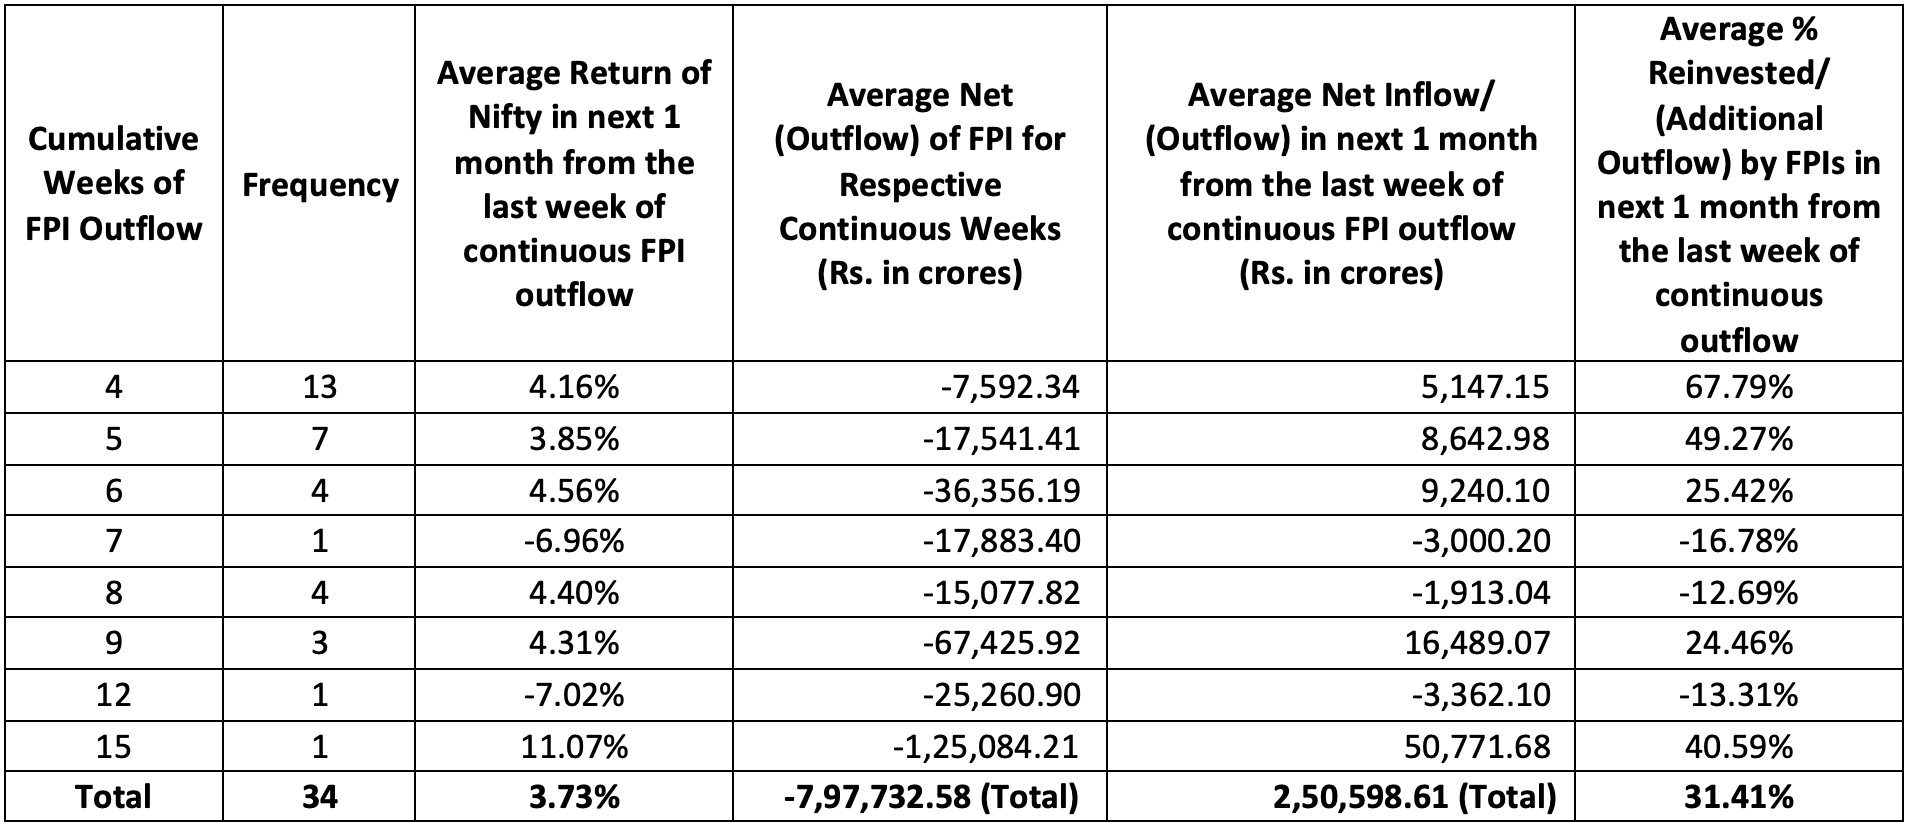
The table below shows the data of continuous FPI net outflows from the Indian equity market. This time, FPIs have been making net outflows for four consecutive weeks, and with the end of this week, it is likely to extend to five weeks.
Since the year 2000, there have been 34 instances where FPIs made net outflows for four or more consecutive weeks. On average, the Nifty has delivered positive returns of over 3.73% in a month following the end of the last week of outflows, with the market regaining over 30% of the investments withdrawn by FPIs in just a month.
(Note - Considered SEBI’s Final FPI Data)
Case 1: With Global Financial Crisis and Covid Period
Case 2: Without Global Financial Crisis and Covid Period
So it might look gloomy that the FPI’s have sold more than Rs 1 lakh crore worth of stock. However, history shows that their entries are also swift and they plough back more than one third of the amount withdrawn in the first month of their re-entry.
25th October, 2024
A Pullback is Possible in Nifty
The recent downturn in the Nifty 50 has raised concerns amongst market participants. Historically, the Nifty has shown a pattern of retracing to its moving averages before resuming its uptrend. However, we are currently witnessing a more pronounced decline, with the index dropping below its 100-day moving average. This has prompted questions about whether the market’s current fall is the start of a deeper trend down the hill or simply a flash in the pan before the uptrend resumes.
Now let’s try to figure it out with the help of some data. Nifty has declined for 4 weeks in a row. This is a rare occurrence. An analysis of all such past occurrences from 2010 reveals an optimistic outlook.
Historically, when the market has corrected by 5% or more over four consecutive weeks, the Nifty has shown strong forward returns over the subsequent months. The table displays the 1-month, 3-month, and 6-month forward returns along with the probability of a positive outcome
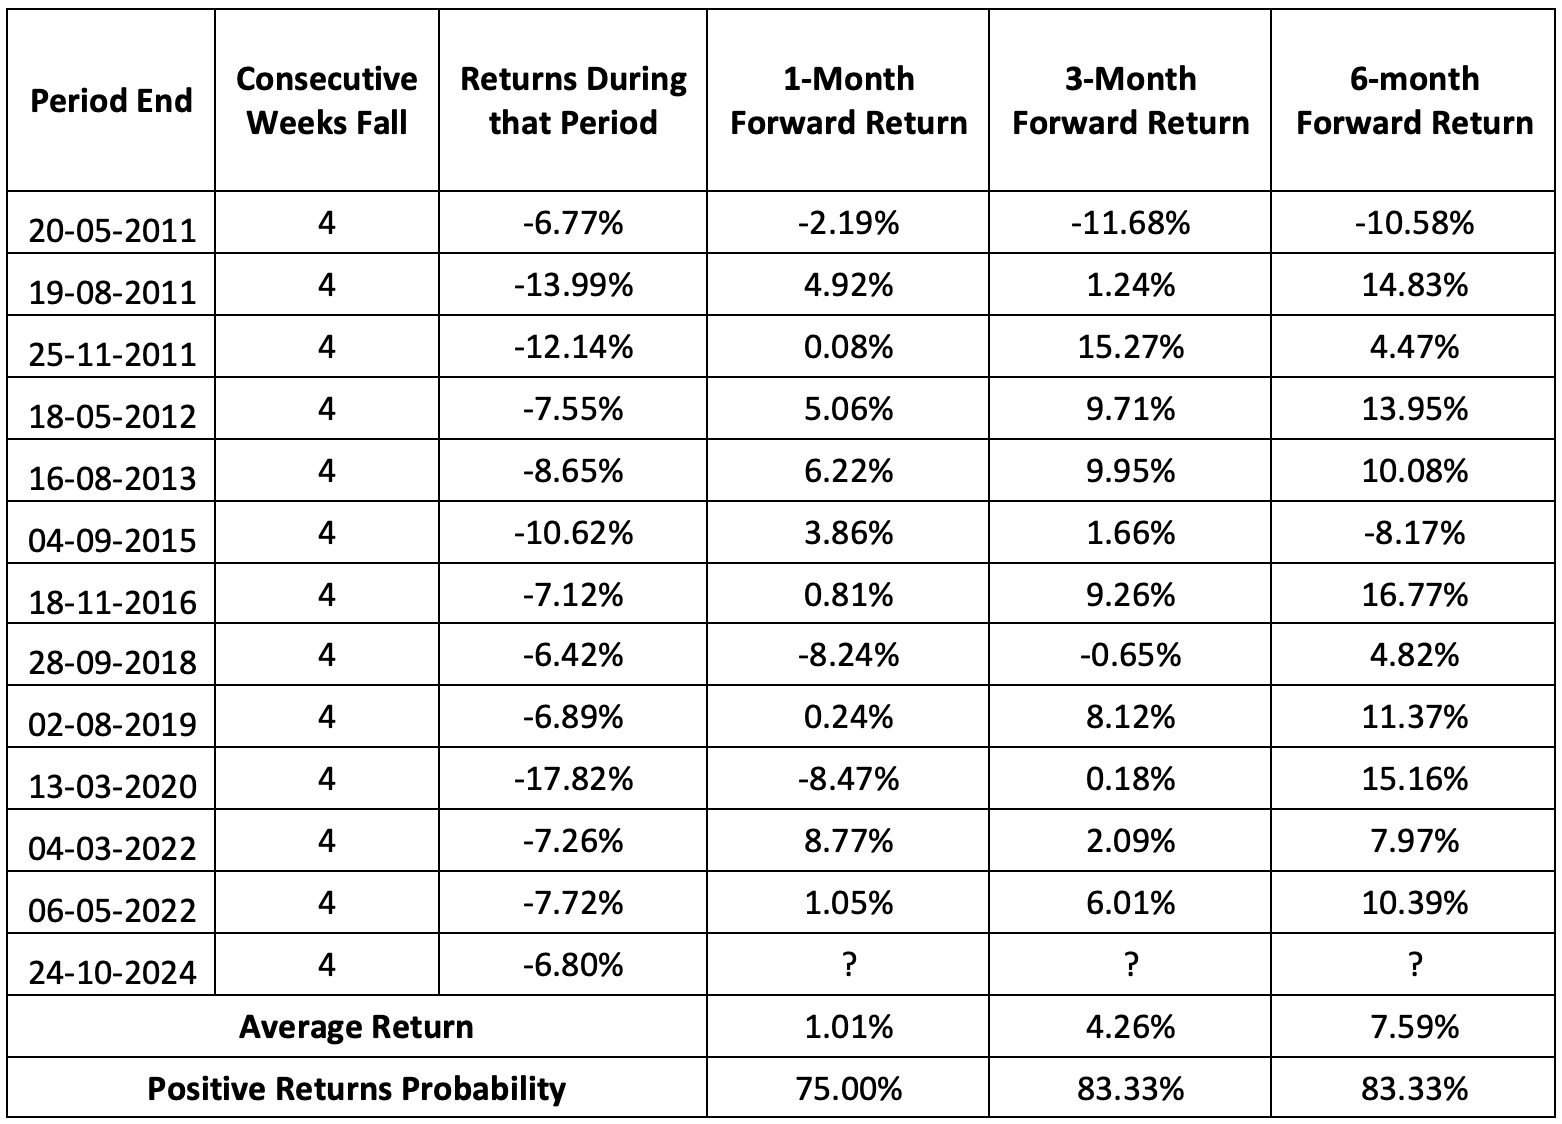
Since 2010, there have been 12 occurrences when Nifty has fallen for 4 weeks in a row. Nifty has managed to bounce back in nine out of these 12 occurrences with an average gain of 1.01% over one month.
The 3-month and 6-month forward returns are positive in 10 out of 12 instances. The average gains are 4.26% and 7.59% respectively. That’s not all. There are a few more data points which indicate a reversal could be possible.
_1730105761.jpg)
The percentage of Nifty 50 stocks trading above their 4-week and 10-week simple moving averages (SMA) - are also pointing to a possible turnaround. Historically, the Nifty has often reversed its downward trajectory when only 10% of its stocks are trading above these SMAs. Currently, we see that just 8% of Nifty 50 stocks are trading above their 4-week SMA, and a similar pattern is observed for the 10-week SMA. This indicates that we may be nearing a potential bottom if these historical patterns hold true.

While it is natural to be concerned about the recent market decline, historical data suggests that the Nifty 50 may be poised for a recovery in the coming months. The probability of positive returns over the 1-month, 3-month, and 6-month periods following such corrections is high. As always, I encourage investors to remain vigilant and informed and be prepared for both short-term volatility and long-term opportunities.
18th October, 2024
All Weather Investing: Protecting Your Portfolio from Market Downturns
The current market scenario is characterized by heightened volatility due to geopolitical tensions, US election cycles, and recessionary fears. To handle the market-wide fluctuations, the investors must strategically position themselves to generate optimal returns with a lesser risk. While expecting higher returns is important, it is crucial to consider the risks involved.
During periods of market corrections, many investors succumb to panic selling, ultimately crystallizing losses that could have been mitigated. Portfolio diversification can serve as an effective strategy to buffer against systemic risks and enhance risk-adjusted returns in these uncertain times.
What many fail to realize is that even during downturns, a portfolio can still perform well if its drawdown is smaller than the broader market’s drawdown. In today’s unpredictable financial environment, understanding and managing different types of risk is crucial to building a resilient, all-weather portfolio. In this article, we will explore certain ways how to construct an all-weather portfolio.
Risk in financial markets is generally categorized as systematic and unsystematic. Systematic risk affects the entire market and is influenced by factors such as interest rate changes, or global events like the 2008 financial crisis and the COVID-19 pandemic.
Unsystematic risk, however, is specific to individual companies or industries. For instance, a regulatory change affecting the telecom sector would impact only those companies but not others. While systematic risk cannot be fully eliminated, unsystematic risk can be mitigated through effective risk management.
Diversification is one of the fundamental principles of investing that helps investors manage risk while maximizing potential returns. For Indian investors, a well-diversified portfolio is crucial to navigating the inherent volatility of the stock market. A key element in understanding diversification is the risk-return tradeoff, which lies at the heart of portfolio management. By spreading investments across non-correlated asset classes such as equities, commodities, and bonds investors can reduce their exposure to unsystematic risks.
For Indian investors, one of the strategies to manage systematic risk is by building an optimal portfolio which means combining asset classes with different risk profiles such as equities, commodities, and bonds. The key is to include assets that are not correlated, meaning they do not move in the same direction at the same time. For example, while equities might rise during a bullish phase, commodities like gold often perform well in times of uncertainty, offering a hedge against stock market volatility.
A diversified portfolio in non-correlated assets tends to experience smaller drawdowns during market downturns. When one type of investment goes down, others might stay stable or even go up, balancing out the overall impact. This way, the portfolio experiences smaller losses compared to investing in just one or similar types of assets that may all drop at the same time during a downturn.
One of the lesser-discussed yet highly valuable metrics in portfolio management is the Calmar Ratio. This ratio measures the annualized return on investment relative to the portfolio’s maximum drawdown, thus evaluating portfolio performance in terms of risk. A higher Calmar Ratio indicates a better risk-adjusted return, as it reflects the portfolio’s ability to generate returns while minimizing large declines.
Diversification plays a key role in improving the Calmar Ratio. This, in turn, lowers the portfolio’s volatility and enhances its Calmar Ratio, making it more resilient in the face of market fluctuations.
Consider the below example: The first chart shows that the S&P BSE Midcap Index delivered a 17.2% CAGR over 10 years but suffered a significant -40.79% drawdown during COVID. In contrast, the second chart, with a diversified portfolio of 60% MidCap and 40% Gold, achieved a 14.9% CAGR with a much smaller -14.06% drawdown. By allocating 40% of the portfolio to gold, we successfully reduced the drawdown from -41% to -14%, while maintaining a CAGR of 14%.
Consider the below example: The first chart shows that the S&P BSE Midcap Index delivered a 17.2% CAGR over 10 years but suffered a significant -40.79% drawdown during COVID. In contrast, the second chart, with a diversified portfolio of 60% MidCap and 40% Gold, achieved a 14.9% CAGR with a much smaller -14.06% drawdown. By allocating 40% of the portfolio to gold, we successfully reduced the drawdown from -41% to -14%, while maintaining a CAGR of 14%.
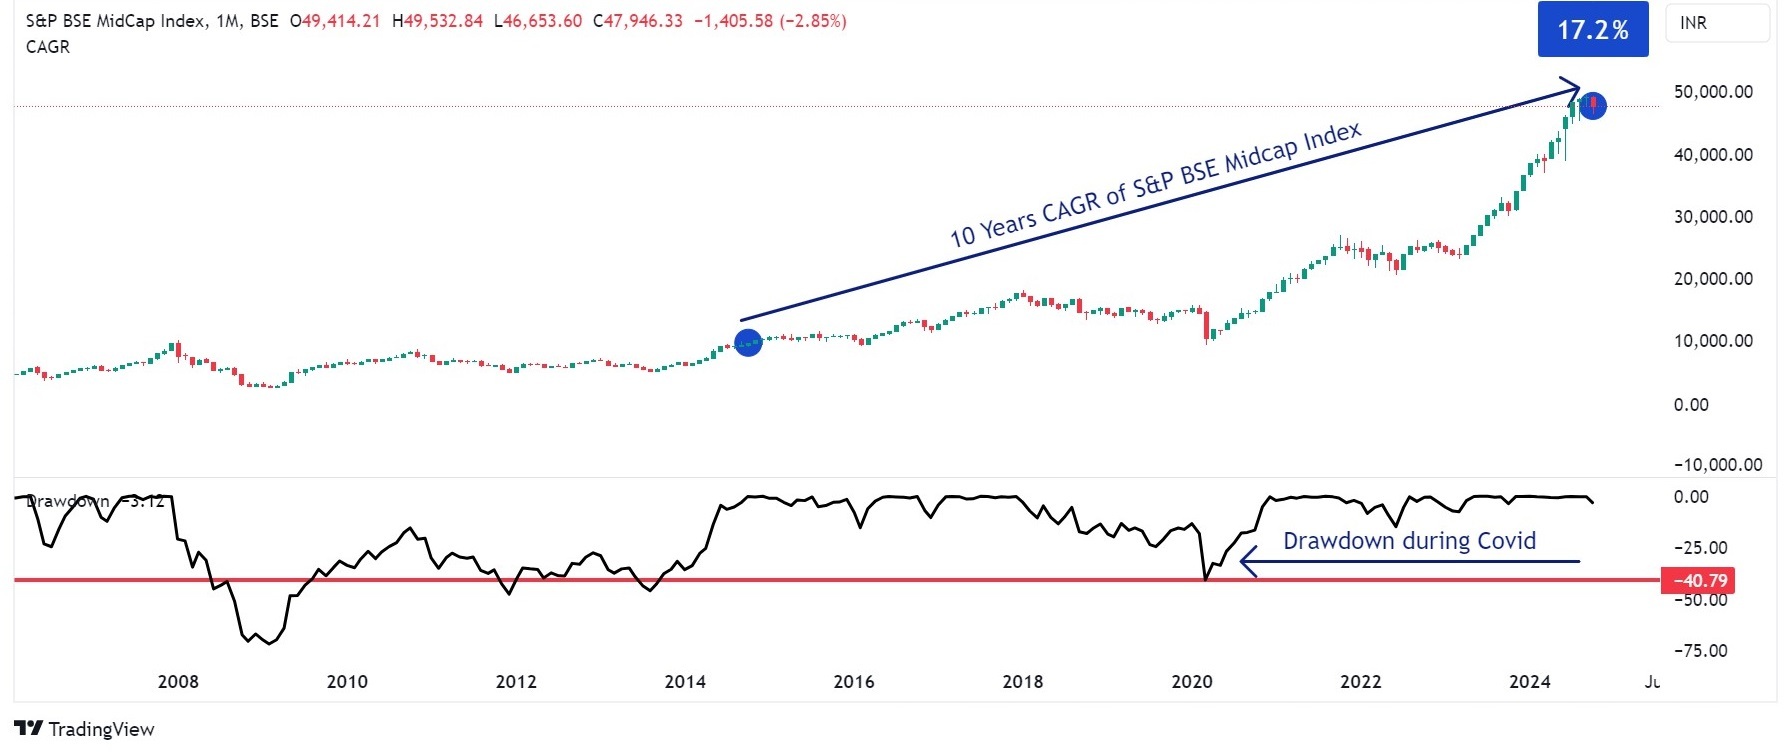
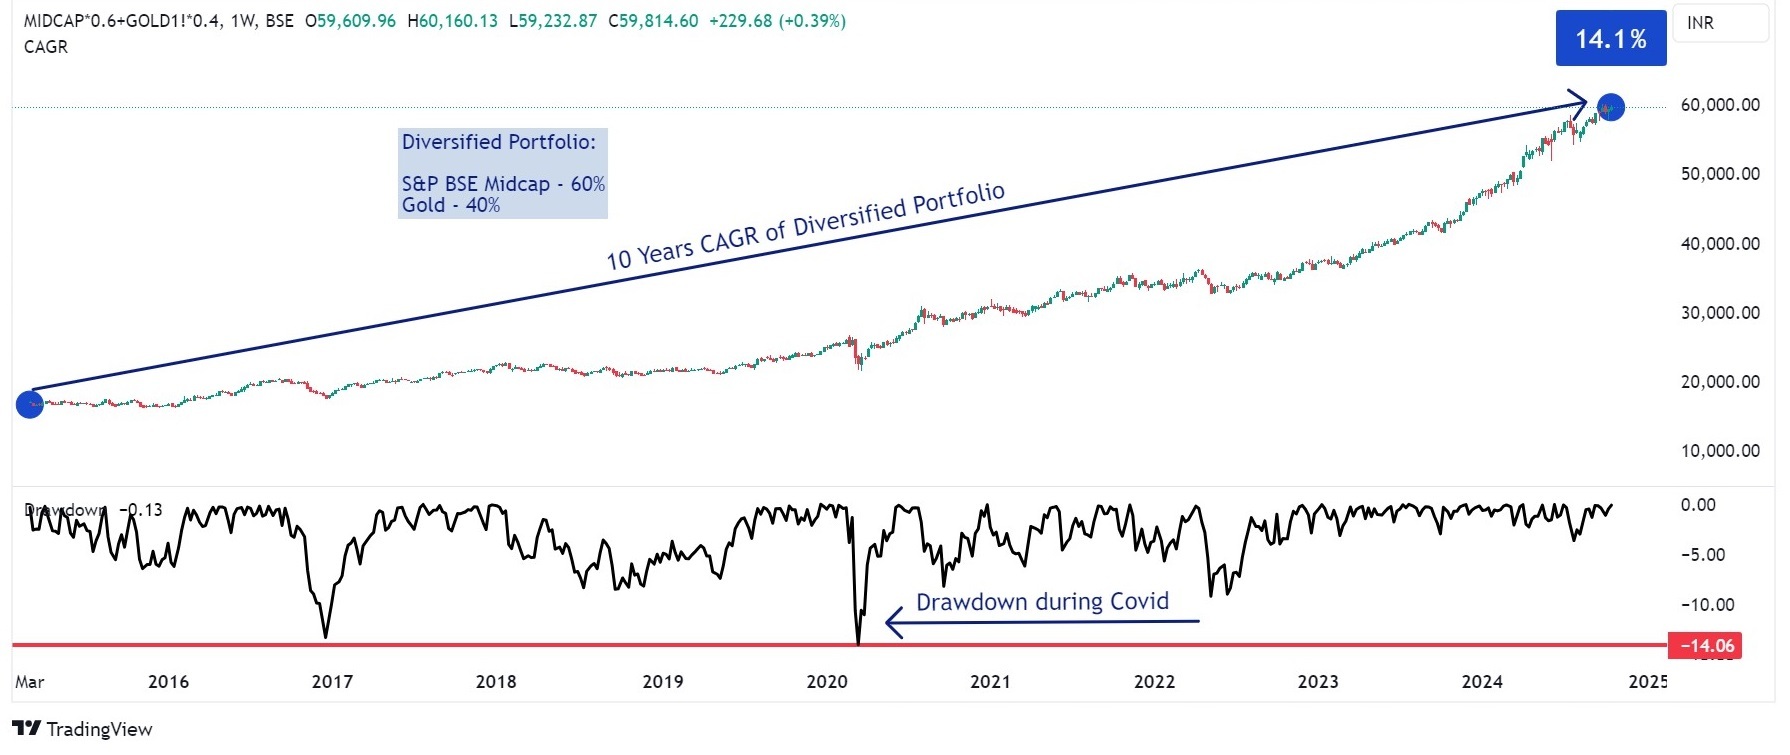
Further, the Calmar Ratio is higher for the diversified portfolio (1.00) compared to the pure MidCap portfolio (0.42), highlighting the reduced risk and better stability. This demonstrates how diversification can reduce volatility and provide more stable returns, particularly in times of market stress like COVID.
An investor can select an optimal portfolio and allocate funds according to their risk tolerance. The table below illustrates how changes in the allocation between a risky asset (Midcaps) and a safe asset (Gold) impacts the CAGR, drawdown, and Calmar ratio.

A balanced portfolio must include high-growth equities for capital appreciation, along with other non-correlated asset classes to stabilize returns during periods of market volatility. Hence, diversification is crucial for Indian investors looking to balance risk and return in a volatile market environment. Furthermore, investors can achieve better risk-adjusted returns by focusing on the Calmar Ratio and reducing portfolio drawdowns.
11th October, 2024
Large IPOs Typically Signal Market Peaks but This Time Might be Different
The journey of the Indian stock market is one of remarkable growth, resilience, and opportunity. Among its most significant milestones are Initial Public Offerings (IPOs), which not only fuel the growth of companies but also leave a lasting impact on the broader market.
IPOs offer companies a chance to raise capital without adding debt, helping them expand and innovate. For investors, they present the unique opportunity to get in at the ground level of a company’s public journey.
Typically, IPOs flourish during bull markets where euphoric sentiment leads to high demand for companies coming up with new listings. Companies use this opportunity to raise capital at high valuations. IPOs that list successfully with a premium help fuel the bull market as investors plough back the profits. However, large overhyped IPOs which generally come at pricey valuations lead to a peak in the bull market.
Will Hyundai Motors India IPO also lead to a top in our market?
Two things will help us answer this.
Firstly, the IPO process has undergone a tremendous change over the years. We must thank the regulator for introducing the Application Supported by Blocked Amount (ASBA) system to apply for IPOs. Here the amount doesn’t leave the applicant’s bank account until the shares are allotted to him. This was a welcome relief from the manual application process where funds were deducted irrespective of the allotment. The refund process was complex and time-consuming which could take 15-20 days from listing. This blocked large sum of investors’ funds typically sucking out liquidity which is the lifeblood of a bull market. Once liquidity reduced it led to a top in the markets. This was the case with Reliance Power and Coal India IPO which led to a top in 2008 and 2010 respectively.
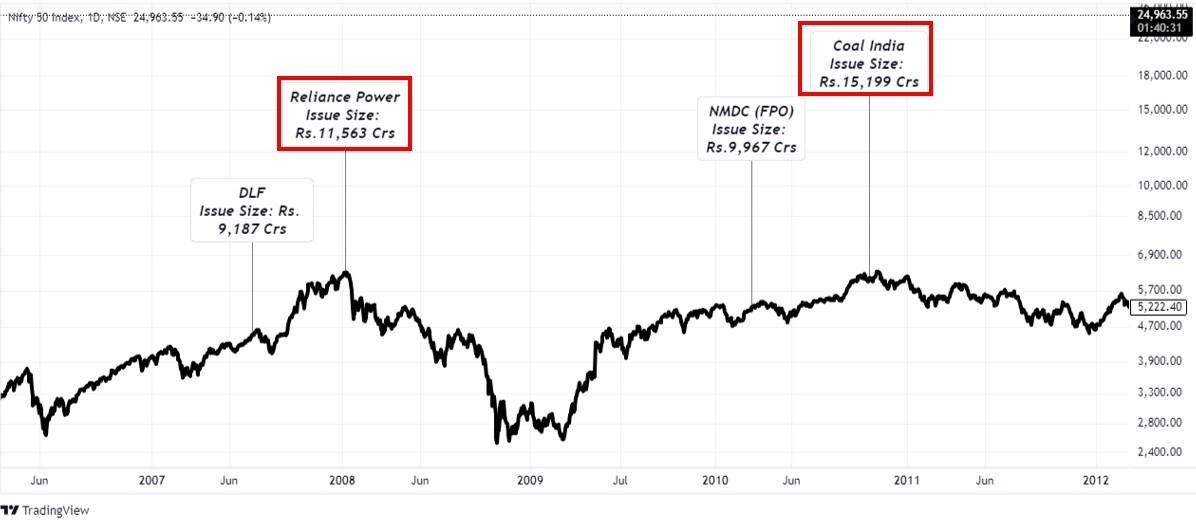
The introduction of the ASBA changed this dramatically by digitizing and streamlining the process. Now, IPO listings occur within 4-5 days of closure, providing better fund control, faster refunds, and greater transparency. This has encouraged retail participation, enhanced liquidity, and improved investor confidence. Thus, liquidity is not an issue now.
Secondly, in large IPOs there is widespread allotment of shares to all applicants. This ensures that initial demand and supply levels are relatively balanced. However, post-listing investors holding shares try to exit which results in supply to outpace demand. This shift can trigger price corrections, creating a ripple effect that impacts broader market sentiment too. As demand diminishes and supply increases, it leads to a notable decline in stock prices, influencing the overall market dynamics. This was the case with large IPOs like LIC & PayTM.
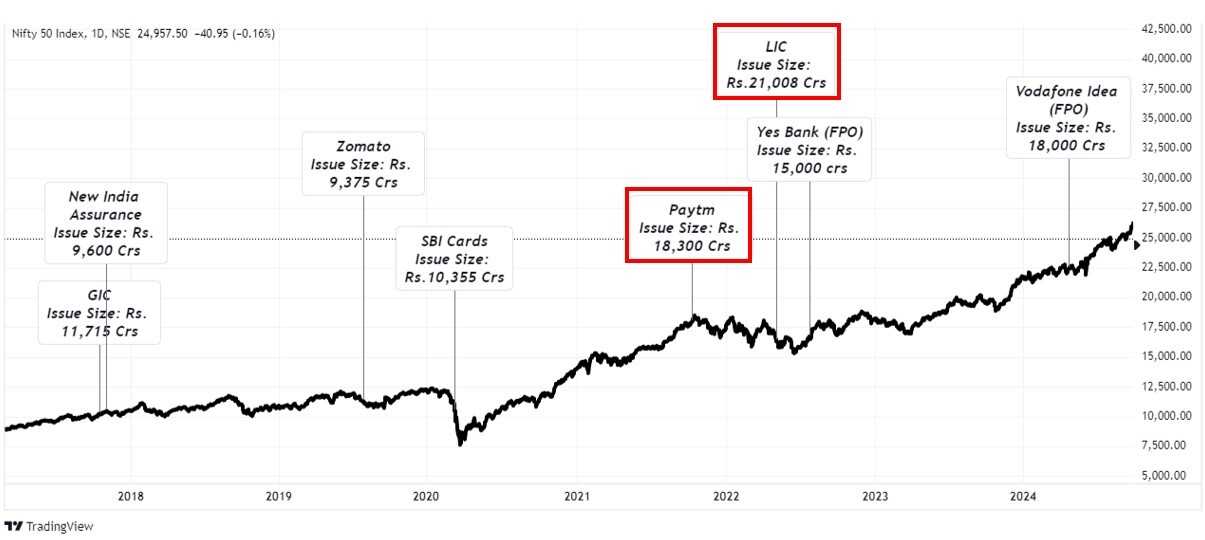
(FPO: Follow on Public Offer)
Both of the above charts show how our markets have peaked around huge IPOs. Now large IPOs aren’t the only reason why markets top out. There are several things like global and domestic macros, internal market dynamics, and valuations at play which lead to a top in the markets.
Finally, I would say that large IPOs are not the cause of market tops but a symptom. Exuberance and euphoria normally lead a market top. Fortunately, the recent correction has applied some brakes to the euphoric drive of this bull market. The markets seem ready to absorb the supply of paper from the biggest-ever IPO in Indian capital markets history. But nobody knows with certainty what will happen next. Let’s wait and watch…

 Easy & quick