

Stock Market Updates for September, 2024
27th September, 2024
F&O Trades of Individuals Should Be Driven by Hedging and Rational Strategies, Not Speculation
Despite stockbrokers disclosing that "9 out of 10 individual F&O traders make losses" (based on SEBI's study covering FY19 to FY22), this warning is widely checked but rarely heeded by traders. The persistence of this trend was confirmed by SEBI’s recent study, which revealed that 91% of individual traders (approximately 73 lakhs) lost money in the F&O segment in FY24. On average, these traders experienced net losses, including transaction costs, of around ₹1.20 lakh per person in FY24.
SEBI’s study highlights several important findings that shed light on emerging trading patterns in India. Some of these observations challenge common misconceptions and provide much-needed reality checks.
The perception of F&O trading as a quick way to make money has been significantly undermined, with only a single-digit percentage of individual traders reporting net profits. This implies that the odds of winning are minimal in F&O trading. Moreover, the transaction charges associated with such trades are substantial, accounting for around 25% of the absolute P&L. While many traders tend to overlook transaction costs, their calculation based on the notional contracted value plays a crucial role in determining exposure and trade payoffs, making it essential for traders to understand this implication.
The rise in young F&O traders is also a major concern from both social and national economic perspectives. These individuals are risking their capital at the early stages of their careers, and the report highlights that the proportion of loss-making traders is inversely proportional to age.
Further, the pursuit of quick wealth through F&O trading is more common among those in the low-income bracket (declared annual income below ₹5 lakh in FY24), who make up 76% of individual F&O traders. Alarmingly, over 90% of traders in this group incurred losses in FY22, FY23, and FY24, a trend that could have serious consequences.
Moreover, the study shows that over 76.3% of individuals who incurred losses in FY22 and FY23 continued to trade in F&O in FY24, and of those who persisted, only 8.3% made a profit in FY24. The disregard of past losses in the optimism of expected profits is perplexing.
As is well-known, derivative trading is a zero-sum game, individual traders should be aware of who they are competing against. In FY24, while individuals suffered gross losses exceeding ₹41,500 crore and others (Corporates, Trusts, NRIs and PMS clients) suffered around ₹19,700 crore losses in F&O trading, proprietary traders earned about ₹33,000 crore in gross profits and FPIs made roughly ₹28,000 crore. The reason of success among these groups lies in strong technical skills, usage of advance technology infrastructure - algorithmic platforms, computational valuation models, strategy formation and risk management frameworks.
Brandon Mull, an American author, once said, “Smart people learn from their mistakes. But the truly sharp ones learn from the mistakes of others.” To successfully trade in the F&O segment, novice traders must learn from the mistakes of others while putting their own capital at risk in derivatives.
Ideally, no more than 2-5% of capital should be exposed in a single trade. Transaction charges and notional contract value should be given due consideration, and having multiple sources of income is essential.
Additionally, smarter traders learn from the successes of others, such as proprietary traders and FPIs. Developing analytical skills, maintaining strong control over emotional inclinations, setting clear risk management criteria, hedging wisely, forming strategies that combine multiple instruments to get desired payoffs, and establishing rule-based triggers to avoid behavioural biases can all increase profitability.
To cut to the chase, F&O trading should be guided by a well-thought-out rationale that incorporates calculated risk, rather than sheer speculation. Hedging trades at extreme points is preferable to entering naked trades, as it helps minimize losses. Moreover, it is imperative for risk-averse individuals to focus on the cash market and use derivatives only for hedging existing positions, as trading performance is not based solely on returns but on risk-adjusted returns.
20th September, 2024
Shift to Stability of Large-Cap
The Nifty Midcap 100 Index has recently hit an unprecedented high of 60,400 driven more by market forces than by robust corporate fundamentals. Currently, the index trades at a Price-to-Earnings (P/E) ratio above 44 - the highest level since the post-pandemic surge in midcap stocks. This P/E multiple is significantly above its 5-year and 10-year median levels, by approximately 75% and 54%, respectively, signaling that midcap stocks are trading at a considerable premium.
These inflated valuations raise concerns about an impending market correction. Historically, when the Nifty Midcap 100 has experienced a sharp decline of 10% or more in a single month, the Nifty 50 has consistently outperformed both the Nifty Midcap 100 and Nifty Smallcap 100 indices.
Statistical data shows that when the Nifty Midcap 100 rallies more than 15% over four months and subsequently corrects, the Nifty 50 has a higher probability of outperforming both the Midcap 100 and Smallcap 100 in the following month which is displayed below.
For instance, Nifty Midcap 100 rallied for 27.5% from January to April 2006 and subsequently declined by 14% in May 2006. In such a scenario Nifty 50 posted a return of more than 1.5% in June 2006 whereas Nifty Midcap 100 and Nifty Smallcap 100 posted negative returns during the same period. The table below displays similar instances that occurred in the past and the performance of these indices after the decline.
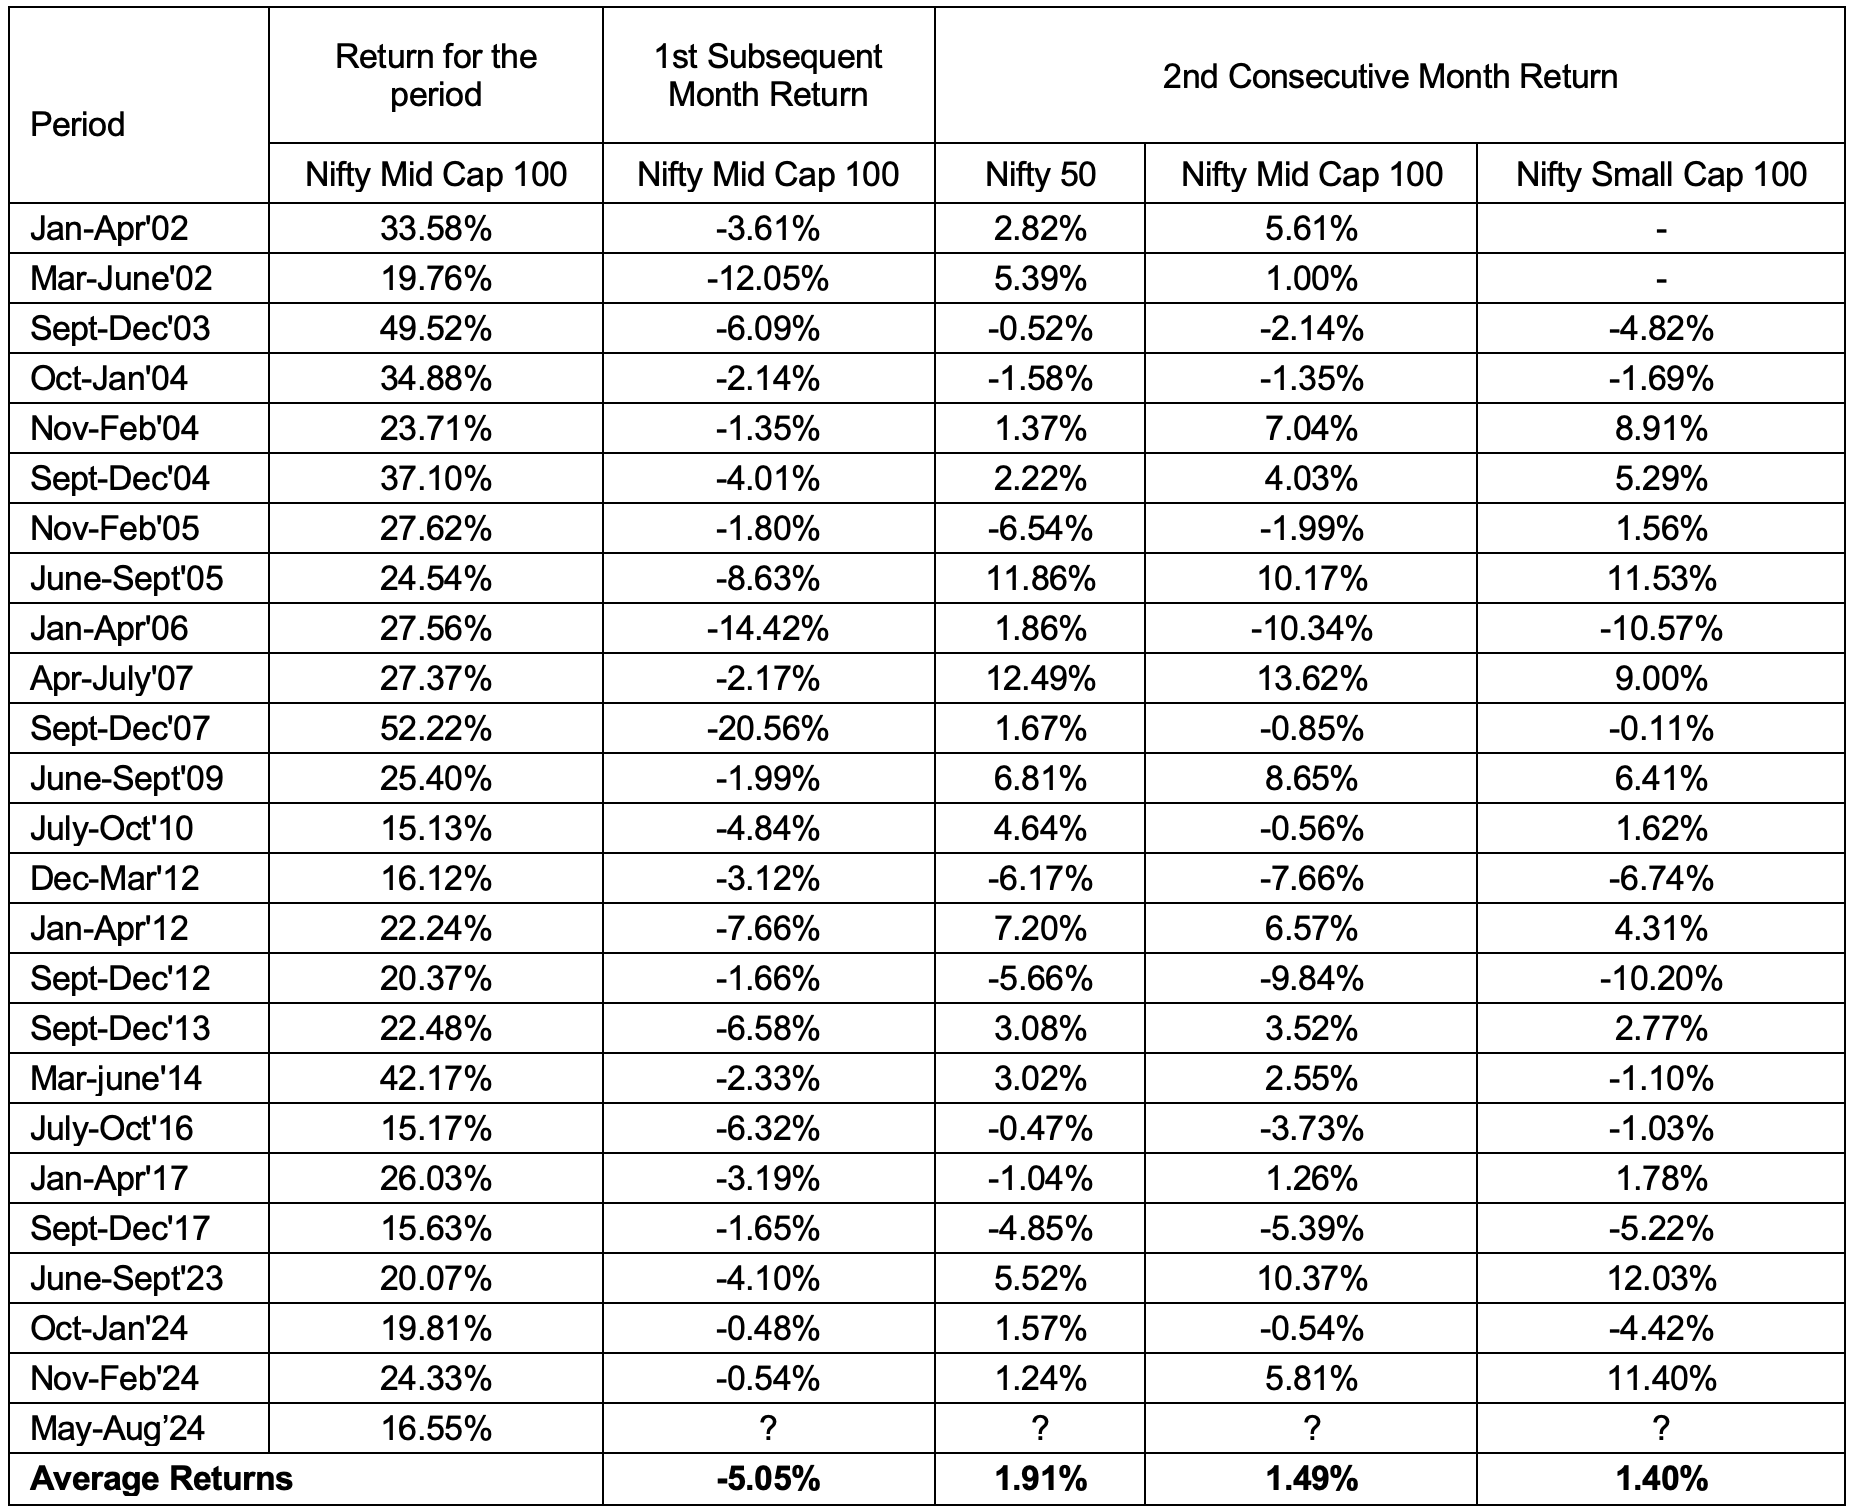
The Nifty Mid Cap 100 has rallied by over 15% between May’24 and August’24. If the index closes at levels of 59,200 - 59,250 or lower by the end of September, the likelihood of it following the aforementioned trend increases, making large-cap stocks more appealing relative to midcaps and small-caps.
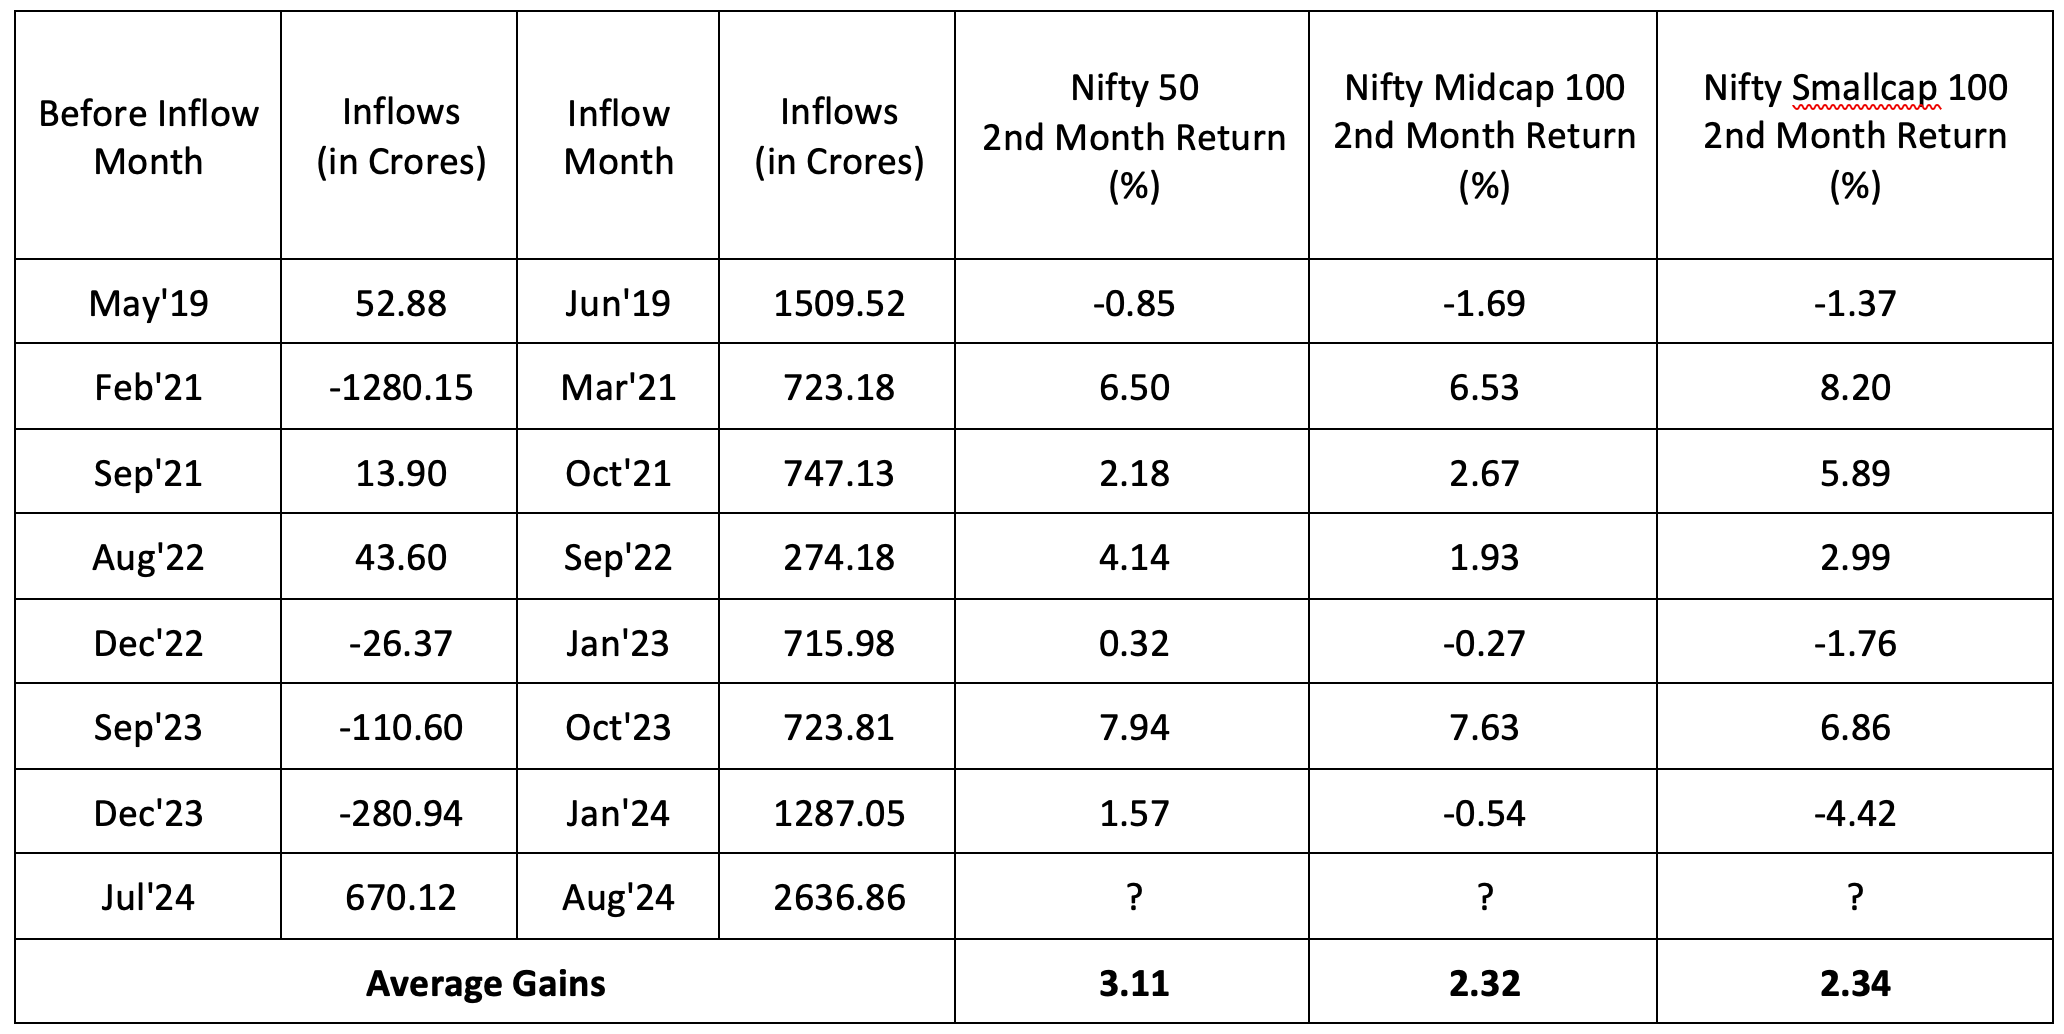
Supporting this shift, recent data from the Association of Mutual Funds in India (AMFI) highlights a growing preference for large-cap equities. In August, large-cap funds recorded net inflows of Rs. 2,638 crores - a 300% increase over July’s inflows, marking a fourfold surge. This trend underscores the increasing appeal of large-cap stocks as a defensive strategy in a volatile market environment.
Moreover, historical patterns suggest that when large-cap funds experience a threefold increase in net inflows or transition from net outflows to inflows, the Nifty 50 has outperformed the mid-and small-cap indices in the second month following these inflows. This trend, observed consistently over the past five years, highlights the critical role of fund flow dynamics and timing in market performance.
For instance, if large-cap fund inflows in August tripled compared to July, Nifty 50 returns in October generally outpace those of the mid-cap and small-cap indices.
Market participants should closely monitor this evolving shift. Rising valuation risks and substantial inflows into large-cap equities suggest that large caps will likely remain the preferred choice for investors seeking stability in these uncertain times.
13th September, 2024
Why Investors Should Be Cautious in Extended Bull Runs Like This
In my previous article, I wrote how the Nifty 50 index often returns to its mean after an extended bull run. It’s much like a stretched rubber band that eventually snaps back. If we apply the same concept to the Nifty Smallcap 100 index, we can see similar patterns. Even though the small-cap stocks are highly volatile, they gravitate towards their mean over time.
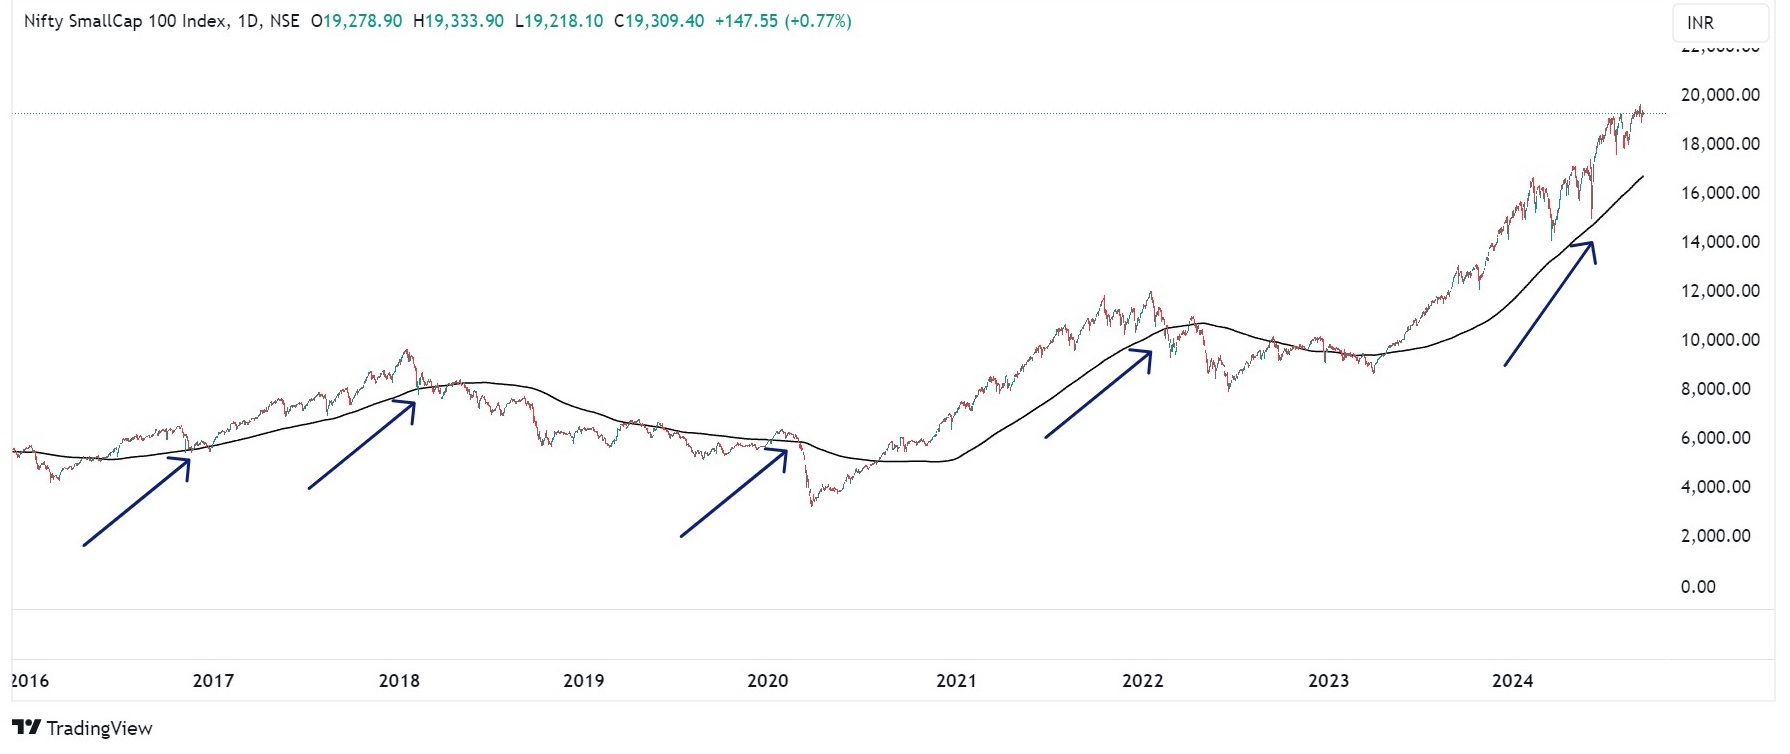
In the Nifty Smallcap 100 chart below, we can see that the index has retraced to its 200-day moving average line five times since 2016. After each bull run, the index pulls back to this key support level or consolidates near it before resuming its upward trend. This highlights the significance of mean reversion in identifying market trends, especially during extended bullish phases.
Small caps have gained attention during the bull market over the past year, but investors should understand the concept of mean reversion. This helps them remain cautious, identify opportunities, and maintain a balanced approach to risk and reward, aiding in better decision-making during market pullbacks.
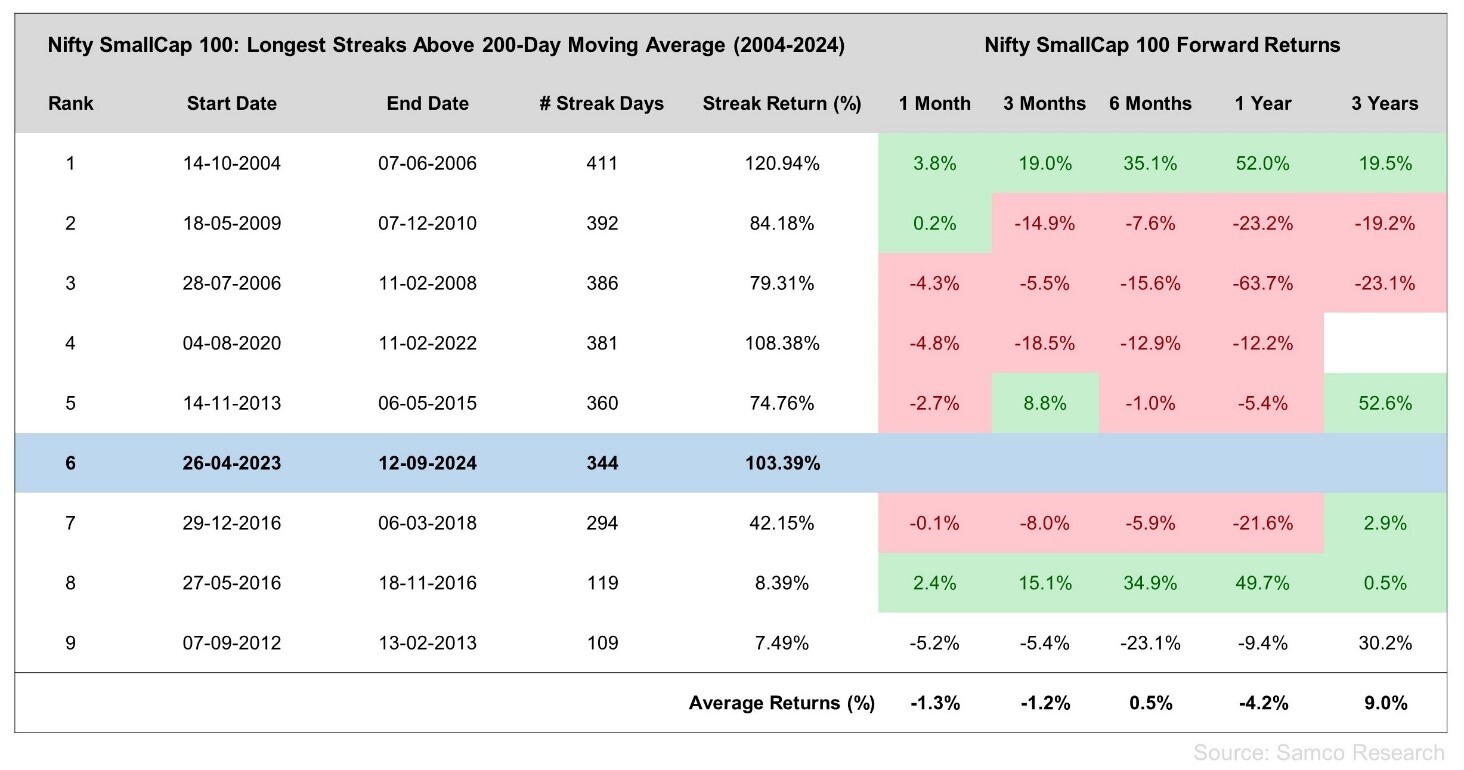
The chart below highlights the Nifty Smallcap 100 index’s streak of closing above its 200-day moving average (DMA). Between 2004 and 2024, the index has managed to close above this level for over 100 consecutive days on nine occasions whereas it has recorded a streak of over 200 days in seven instances.
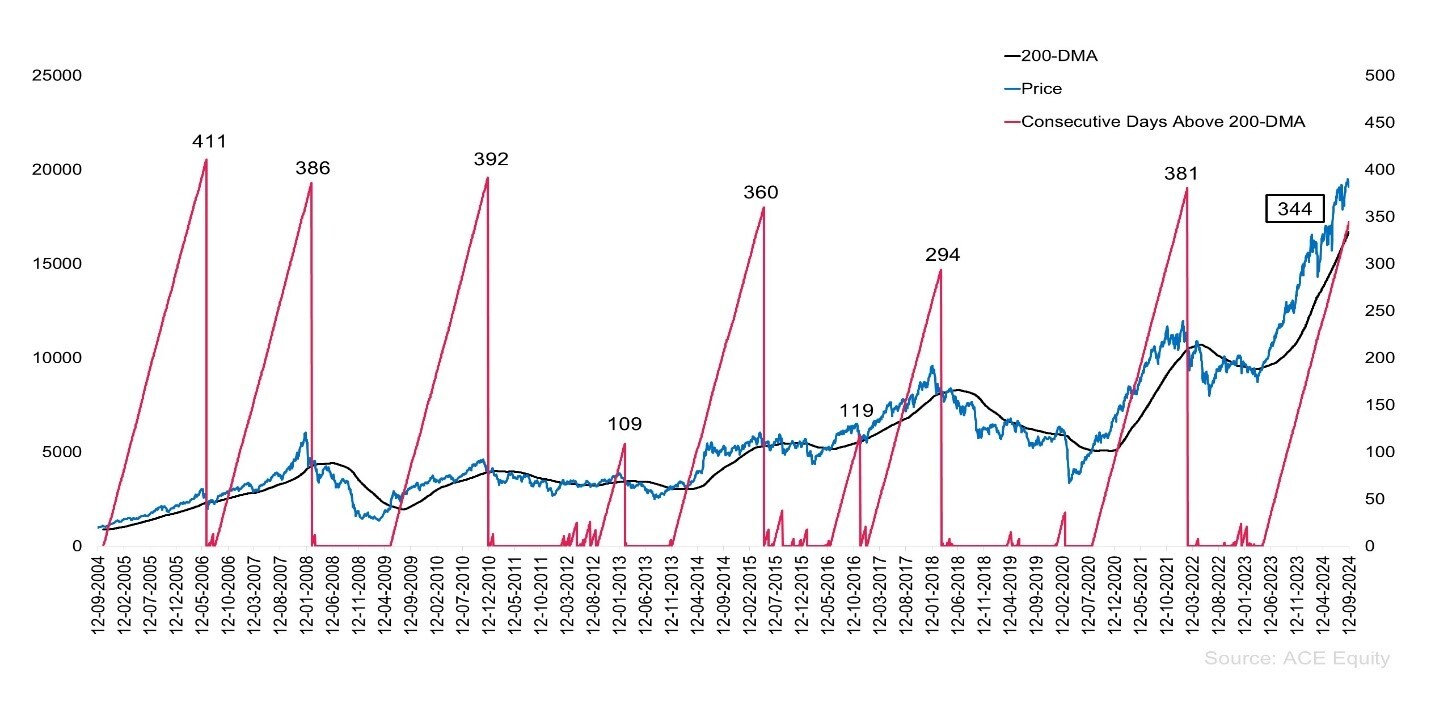
The table below showcases the longest streaks of the Nifty Smallcap 100 index staying above 200-day moving average for over 100 days, and the returns delivered by the index during these periods. The longest streak occurred between 2004 and 2006, lasting 411 days with a 120.94% return. The ongoing streak since April 2023 has already extended to 344 days, yielding a return of 103.39%.
The forward return analysis in the table reveals that while the Nifty Smallcap 100 index has posted impressive gains during extended bullish phases—ranging from 7.49% to 120.94%—it is often followed by short-term corrections. This is reflected in the negative average returns over 1- and 3-month periods.
Just as a rubber band snaps back with greater intensity when stretched, small-cap stocks, known for their high volatility, tend to experience sharp declines after prolonged upward trends. Furthermore, the negative returns shown are calculated from the point where the index closes below its 200-day moving average, meaning the pullback from the peak to the 200-DMA level is in addition to the corrections listed in the table.
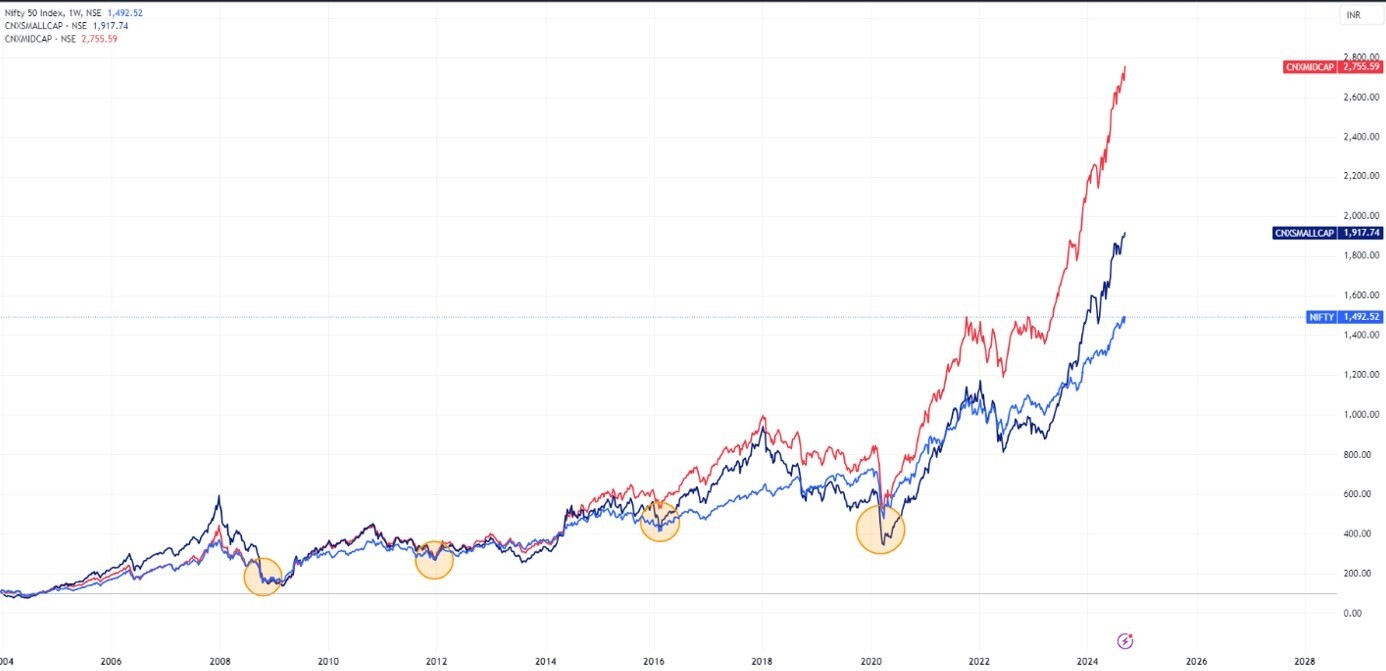
The chart below compares the performance of three indices: Nifty Smallcap 100, Nifty Midcap 100, and Nifty 50, over a period from 2010 to 2024. Small-cap and mid-cap stocks, being more growth-oriented tend to outperform the large-cap stocks represented by the Nifty 50 during bullish phases, as seen in the chart. This often results in a significant gap between the performance of these indices compared to the Nifty 50. Eventually, these indices tend to converge due to mean reversion. In essence, when the market corrects or stabilizes, midcap and smallcap stocks often undergo sharper corrections, bringing their performance closer to that of large-cap stocks.
Considering the above points revolving around mean reversion, investors should remain cautious in expecting consistent short-term gains post a bull run. They need to adopt a balanced approach, recognizing the risks of post-streak corrections and making informed decisions to navigate through the potential volatility that lies ahead.
Technical Outlook:
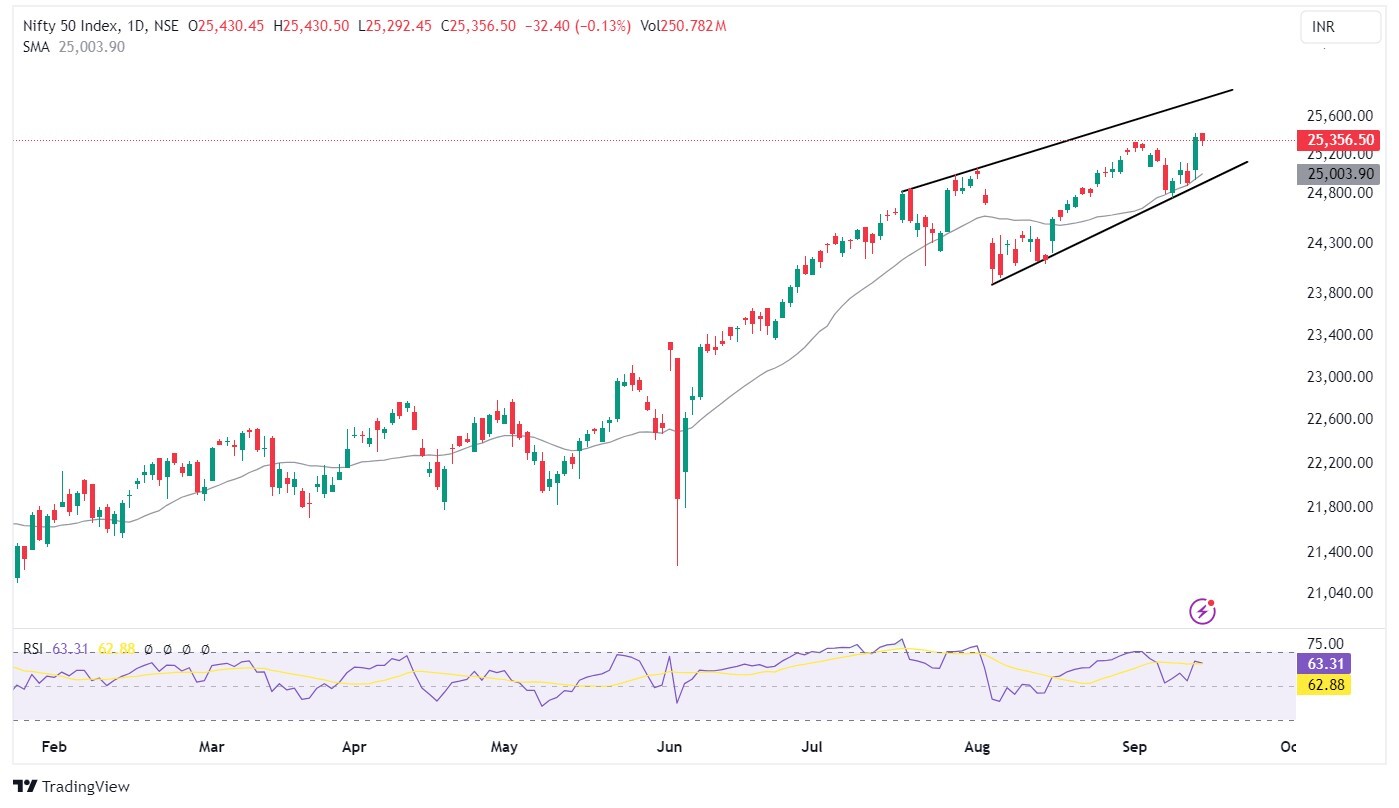
Nifty touched a new all-time high of 25,433 and ended the week at 25,356, up 2.03%. Historically, September has been a fragile month, with the first two weeks typically bullish and the latter half turning bearish.
On the weekly chart, Nifty formed a bullish engulfing pattern, and the daily chart shows a higher-high and higher-low formation. However, the domestic market may track global cues in the coming week. Nifty is well-positioned above the 20 DMA, signaling overall strength. Any short-term correction toward 25,150 could present a buying opportunity.
India VIX, currently at 12.55, is at its lowest level and could reverse in the coming week, potentially challenging the bullish sentiment. Sector rotation may also influence short-term market movements. Nifty's support is placed around 25,100, followed by 25,000, while resistance is seen at 25,520, followed by 25,650.
6th September, 2024
Three Reasons Why Indian Pharma is Getting Ready for Unstoppable Growth
In today’s dynamic market, we frequently witness indices scaling new heights, with the latest milestone being the Nifty crossing 25,000 mark. Amidst these high valuations, one sector stands out with strong growth potential—the Indian pharmaceutical industry. Often seen as a contrarian or defensive investment, this sector provides a powerful hedge against market volatility while energizing portfolios with its robust growth trajectory.
While the global pharmaceutical market is projected to grow at a steady 6% CAGR till 2028, the Indian pharma sector is poised for a far more impressive expansion, with expected growth between 12-16% CAGR over the same period (According to Frost & Sullivan). You might ask—what sets India apart to achieve such remarkable growth rates? Is this growth sustainable?
In this article, we’ll explore the unique boosters that make the Indian pharma market a standout performer, positioning it for continued success in the coming years.
Booster Shot No.1 - The US Bio Secure Act
The upcoming US Bio Secure Act aims to reduce dependency on "companies of concern," which have a dominant share in the US pharma market. Notably, several Chinese biotech firms have been identified as national security risks. This could lead to disruptions in drug development and delays as alternative sources are sought.
For Indian pharmaceutical companies, this scenario presents a distinct opportunity. Leveraging their established expertise and leadership in global COVID-19 vaccine distribution, along with robust supply chain efficiencies, Indian firms are strategically positioned to capitalize on this market shift. The departure of Chinese players from the market opens a significant gap, which Indian companies are well-equipped to fill.
Booster Shot No. 2 - The Patent Cliff
Last week I wrote to you about the global pharmaceutical market approaching a significant patent cliff, with over 300 US drug patents worth approximately USD 250 Bn set to expire between 2022 and 2032.
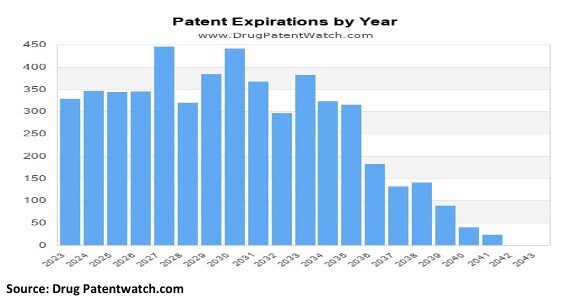
This presents a massive opportunity for Indian pharmaceutical giants, who are well-equipped to manufacture generic versions of these blockbuster drugs.
India’s reputation as a trusted, cost-effective manufacturer positions it to meet global demand efficiently. With a tailored pricing strategy, Indian generic manufacturers can tailor pricing and dosage for regulated markets like the US and UK, enhancing profitability while maintaining affordability for unregulated markets. This strategic advantage strengthens the financial health of Indian pharma players, making them key beneficiaries of the patent cliff.
Booster Shot No. 3- The BioE3 Policy
The recent approval of the BioE3 policy by the Government of India marks a transformative moment for India’s bio-economy. This policy, aimed at advancing high-performance biomanufacturing, aligns with national initiatives like Net Zero and Mission LiFE (Life for Environment), setting India on a path to become a global biotech leader.
This policy’s focus on sectors such as bio-based chemicals, precision biotherapeutics, and climate-resilient agriculture, coupled with the PPP model, promises to drive sustainable growth and job creation. India’s rich biodiversity and strategic initiatives position the country to lead the next biotechnology revolution, reinforcing its role as a global powerhouse in the sector.
In conclusion, the Indian pharmaceutical industry is set for unparalleled growth due to these three key factors making Indian pharma a dynamic force in the global market, offering robust investment opportunities amidst evolving industry trends.
Technical Outlook
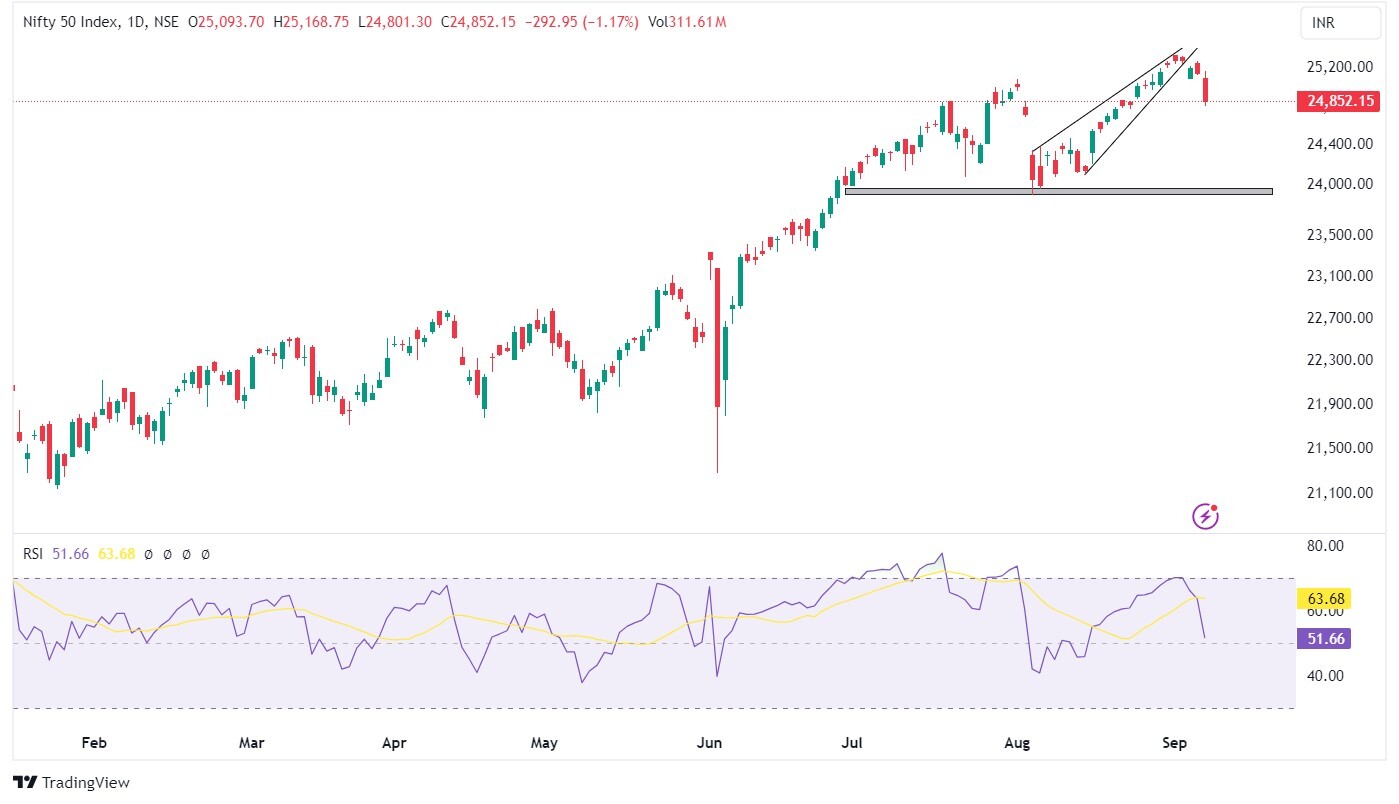
This past week, the Nifty index reached an all-time high of 25,333 before retreating to close at 24,852, marking a 1.52% decline. Following the record peak, the market experienced consolidation, but Friday saw a significant dip of over 1%. On the weekly chart, the Nifty has formed a bearish engulfing pattern, indicating a more cautious outlook ahead.
The recent dip in the Nifty reflects broader weakness in global markets, contributing to the domestic decline. After slipping below the 25,000 mark, the index breached the 23.6% Fibonacci retracement level. The next critical support lies at the 38.2% retracement level, aligned with the 20-day moving average (DMA) at 24,786. However, recent weakness has dampened bullish momentum. The next key support zones to monitor are at 24,500 and 24,300
The Nifty has broken down from a rising wedge formation, a bearish pattern on the daily chart, signaling potential caution. India VIX currently stands at 15.22, indicating an increase in market volatility that may challenge the prevailing bullish sentiment. Sector rotation is expected to influence short-term market movements further. For the coming week, Nifty may oscillate between key levels of 24,500 and 25,150.
 Easy & quick