 Maybe we have always wondered, why do we hear about how the stock market is doing every day?
And oftentimes we come across terms like Nifty 50, BSE Sensex and but have no idea what they mean?
Today let us get into stock market basics and learn about what are stock exchanges in India and how they work?
Let’s begin.
Before we jump onto what is a stock exchange, let us first understand what is a stock market with a simple example.
Let’s say Mr Jack owns a lemonade stand in the southern parts of India. For the last 15 years, his brand ‘BeSweet Lemonades’ has made a strong brand image. People from across the city visit the BeSweet Lemonade store and rejuvenate themselves with its unique and refreshing drink.
Mr Jack always had a dream to open stores in the major cities of India. Hence, he tried to get a loan but the bank said it was too risky.
He asked his friend Jill to invest in the business and become a partner. But, she didn’t have that amount of capital.
Hence, he thought of raising money by issuing shares of BeSweet Lemonades. As a result, he can open more stores in Northern India as well.
Investors had to pay a certain amount to own a small part or share of Jack’s business. So, Jack sells a bunch of shares to the investors which leads to more capital and his lemonade stall turns into a lemonade empire!
Jack puts all the raised money into the business and builds up multiple stores in major cities and his business becomes more profitable ever since. Also, Jack introduces a new product called BeSweet lemonade candy!
As the business starts booming he gives some of that money back to the investors from his profits. These are called dividends.
He doesn’t necessarily have to do this, but it does help get people excited about his company and are more likely to buy the stock, just like Sam did. When the BeSweet IPO was introduced, he wasn’t very sure of investing. But as soon as the new product started booming he thought this brand was going to be huge.
So he offers to buy some shares from one of the original investors for twice what he paid for them. Sam is thinking if Jack keeps this pace up, he can sell the share and make more profits later on.
This is how the stock market works. It’s people buying and selling shares of companies, based on how much they think the company will be worth in the future. However, in the stock market, the buying and selling practices happen thousands of times a second, in different exchanges in India and all around the world.
Maybe we have always wondered, why do we hear about how the stock market is doing every day?
And oftentimes we come across terms like Nifty 50, BSE Sensex and but have no idea what they mean?
Today let us get into stock market basics and learn about what are stock exchanges in India and how they work?
Let’s begin.
Before we jump onto what is a stock exchange, let us first understand what is a stock market with a simple example.
Let’s say Mr Jack owns a lemonade stand in the southern parts of India. For the last 15 years, his brand ‘BeSweet Lemonades’ has made a strong brand image. People from across the city visit the BeSweet Lemonade store and rejuvenate themselves with its unique and refreshing drink.
Mr Jack always had a dream to open stores in the major cities of India. Hence, he tried to get a loan but the bank said it was too risky.
He asked his friend Jill to invest in the business and become a partner. But, she didn’t have that amount of capital.
Hence, he thought of raising money by issuing shares of BeSweet Lemonades. As a result, he can open more stores in Northern India as well.
Investors had to pay a certain amount to own a small part or share of Jack’s business. So, Jack sells a bunch of shares to the investors which leads to more capital and his lemonade stall turns into a lemonade empire!
Jack puts all the raised money into the business and builds up multiple stores in major cities and his business becomes more profitable ever since. Also, Jack introduces a new product called BeSweet lemonade candy!
As the business starts booming he gives some of that money back to the investors from his profits. These are called dividends.
He doesn’t necessarily have to do this, but it does help get people excited about his company and are more likely to buy the stock, just like Sam did. When the BeSweet IPO was introduced, he wasn’t very sure of investing. But as soon as the new product started booming he thought this brand was going to be huge.
So he offers to buy some shares from one of the original investors for twice what he paid for them. Sam is thinking if Jack keeps this pace up, he can sell the share and make more profits later on.
This is how the stock market works. It’s people buying and selling shares of companies, based on how much they think the company will be worth in the future. However, in the stock market, the buying and selling practices happen thousands of times a second, in different exchanges in India and all around the world.
Stock Exchanges in India
There are two major stock exchanges in India: There is a third exchange known as the Metropolitan Stock Exchange of India (MSEI). Earlier known as MCX-SX. However, this exchange is less popular as compared to NSE and BSE.History of Stock Exchanges in India
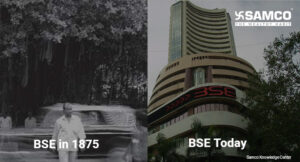 India’s and Asia’s oldest exchange started around 140 years ago under a banyan tree.
Five stock brokers started buying and selling shares under a banyan tree in front of the Mumbai Town Hall. Two decades later, in 1854 as the number of brokers increased a small group was formed at Dalal Street named ‘The Native Share & Stock Brokers Association. Today, it is known as the Bombay Stock Exchange (BSE).
BSE has a cooler younger brother named The National Stock Exchange. It was founded in 1992 after the Indian financial markets suffered a setback due to the Harshad Mehta scam that hit the Bombay Stock Exchange. The government of India decided to establish NSE. It was based on recommendations made by the High Powered Study Group.
The aim of establishing NSE was to provide equal access to investors from all across the nation which made participating in the stock markets easier.
India’s and Asia’s oldest exchange started around 140 years ago under a banyan tree.
Five stock brokers started buying and selling shares under a banyan tree in front of the Mumbai Town Hall. Two decades later, in 1854 as the number of brokers increased a small group was formed at Dalal Street named ‘The Native Share & Stock Brokers Association. Today, it is known as the Bombay Stock Exchange (BSE).
BSE has a cooler younger brother named The National Stock Exchange. It was founded in 1992 after the Indian financial markets suffered a setback due to the Harshad Mehta scam that hit the Bombay Stock Exchange. The government of India decided to establish NSE. It was based on recommendations made by the High Powered Study Group.
The aim of establishing NSE was to provide equal access to investors from all across the nation which made participating in the stock markets easier.
The Stock Market Indexes
Each stock exchange in India has its own index. The indexes give us a clear understanding of how the stock markets are performing. There are two main market indexes in India.- The S&P BSE Sensex represents the 30 largest Indian companies listed on the Bombay stock exchange.
- CNX Nifty 50 represents the 50 largest Indian companies listed on the National Stock exchange.
The Practical use of the Index
Let us now see how the indexes are used by investors and traders.1. Informational Purposes
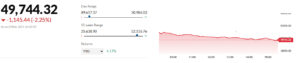
The stock market indexes reflect the general market trend. If the index is positive, it means investors and traders are optimistic about the future. It is shown with a green arrow facing upwards.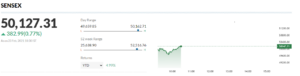 If the index is negative, it means investors and traders are pessimistic about the future. It is shown with a red arrow facing downwards.
 For example, the Nifty value on the 1st of January 2021 was 14,049 and the value as of 16th February 2021 was 15,431. This represents a positive shift of 1,382 points.
This indicates that between 1st January 2021 to 16th February 2021, investors and traders were optimistic about the economic future.
For example, the Nifty value on the 1st of January 2021 was 14,049 and the value as of 16th February 2021 was 15,431. This represents a positive shift of 1,382 points.
This indicates that between 1st January 2021 to 16th February 2021, investors and traders were optimistic about the economic future.
2. Benchmarking
The indexes act as a benchmark for the returns you generate. Let us assume that in the last year, you had invested Rs 1,00,000 in a mutual fund with Nifty as a benchmark index and generated a return of Rs 30,000. On the other hand, Nifty moved from 12,119 to 15,431 points in the last year generating a return of 33% How do you think your fund has performed? Your fund has underperformed the market by 3%. Without the indexes, you cannot really figure out how your fund has performed as per the markets. The objective is always to outperform the index and generate higher returns.3. Trading
Trading by forecasting the index is probably one of the most popular uses of the index. Majority of the trader’s trade with the view of making profits as the market fluctuates. Traders predict how the markets would react to the economy or general state of affairs. For example, imagine the latest situation. At 11:00 AM, Finance Minister Nirmala Sitharaman was expected to deliver the budget speech. An hour before the announcement the Nifty index is at 13,758 points. If the expected budget is favourable to the nation's economy, naturally the index would move up. So to trade, you may want to buy the index at 13,758 and as the market moves up to 14,300 points you can book profits.Index construction methodology
Now as we know that Nifty consist of 50 stocks and Sensex consists of 30 stocks from different sectors. The Index tracks the behaviour of a portfolio of the largest blue-chip companies and most liquid Indian securities. For a stock to include in the index, it should qualify certain criteria. If it fails to maintain the criteria, the stock gets replaced by another stock. Also, each stock in the index has a certain weightage. Weightage refers to how much importance a certain stock has in the index gets compared to the others. To know more about the Free Float methodology of Nifty - Click hereHow does the index assign the weightage to the stock?
In the Indian stock exchange, a free-float market capitalization method is followed. The larger the market capitalization of a company, the higher is the weightage it gets in the index. Free float market capitalization = Total number of shares outstanding in the market * the stock price. Outstanding shares are the total number of shares issued by a company to its investors. Let us understand Free float market capitalization with an example. Let’s say Orange Ltd has 100 shares outstanding in the market, and the stock price is at 50 then the free-float market cap of Orange Ltd is 100*50 = Rs. 5,000.Here is a list of 30 stocks of BSE Sensex:
| SR NO. | COMPANY | INDUSTRY | MARKET PRICE(Rs) | FREE FLOAT ADJ. FACTOR |
| 1. | ASIAN PAINTS | PAINTS | 2,418.90 | 0.5 |
| 2. | AXIS BANK | BANKING | 749.4 | 0.9 |
| 3 | BAJAJ AUTO | AUTO | 4,000.90 | 0.5 |
| 4 | BAJAJ FINANCE | FINANCE | 5,499.10 | 0.4 |
| 5 | BAJAJ FINSERV | FINANCE | 10,251.10 | 0.4 |
| 6 | BHARTI AIRTEL | TELECOM | 581 | 0.4 |
| 7 | HCL TECHNOLOGIES | SOFTWARE | 950 | 0.4 |
| 8 | HDFC | FIN. INSTITUTIONS | 2,735.50 | 1 |
| 9 | HDFC BANK | BANKING | 1,538.80 | 0.7 |
| 10 | HUL | FMCG | 2,181.20 | 0.4 |
| 11 | ICICI BANK | BANKING | 623.9 | 1 |
| 12 | INDUSIND BANK | BANKING | 1,067.10 | 0.9 |
| 13 | INFOSYS | SOFTWARE | 1,291.40 | 0.9 |
| 14 | ITC | FMCG | 216 | 1 |
| 15 | KOTAK MAHINDRA BANK | BANKING | 1,937.30 | 0.7 |
| 16 | L&T | ENGINEERING | 1,507.80 | 1 |
| 17 | M&M | AUTO | 876.5 | 0.8 |
| 18 | MARUTI SUZUKI | AUTO | 7,329.00 | 0.4 |
| 19 | NESTLE | FOOD BEVERAGES | 16,386.10 | 0.4 |
| 20 | NTPC | POWER | 104.3 | 0.5 |
| 21 | ONGC | ENERGY | 105.1 | 0.4 |
| 22 | POWER GRID | POWER | 232.2 | 0.5 |
| 23 | RELIANCE IND. | ENERGY | 2,080.60 | 0.5 |
| 24 | SBI | BANKING | 399.4 | 0.4 |
| 25 | SUN PHARMA | PHARMA | 607.5 | 0.5 |
| 26 | TATA STEEL | STEEL | 670.7 | 0.7 |
| 27 | TCS | SOFTWARE | 3,072.10 | 0.3 |
| 28 | TECH MAHINDRA | SOFTWARE | 994.3 | 0.6 |
| 29 | TITAN | CONSUMER DURABLES | 1,425.50 | 0.5 |
| 30 | ULTRATECH CEMENT | CEMENT | 6,207.40 | 0.4 |
Sector specific Indices
Apart from Nifty and Sensex, we have sector specific indices which represent the movements of each sector. For example, the Bank Nifty on NSE represents the sentiment of companies specific to the banking industry.Here is a list of Sector Specific indices:
| Sector Indices | Value |
| Nifty Auto | 10,540 |
| Nifty IT | 25,503 |
| Nifty PSU Bank | 2,465 |
| Nifty Fin Service | 16,747 |
| Nifty Pharma | 12,347 |
| Nifty FMCG | 33,336 |
| Nifty Metal | 3,352 |
| Nifty Realty | 348 |
| Nifty Media | 1,677 |
| Nifty Energy | 18,681 |
| Nifty Pvt Bank | 19,066 |
| Nifty Finserv 25/50 | 16,369 |


 Easy & quick
Leave A Comment?