 This week we would be exploring HDFC Bank who is one of the highly reputed and India’s largest private sector lender by assets in the banking and financial sector of an Indian economy.
Companies Origin & Profile:
Brief Company Profile: HDFC Bank alias Housing Development Finance Corporation is India’s largest private sector lender by assets. The bank was incorporated on 30th August 1994 with its registered office in Mumbai, India. HDFC Bank was the first amongst to receive an ‘in principle’ approval from RBI (Reserve Bank of India) to set up the bank in private sector, a part of RBI’s liberalization of Indian Banking sector in 1994. HDFC Bank commenced operations as a Scheduled Commercial Bank in January 1995. It has around 88,253 permanents employees and has an overseas presence in Dubai, Hong Kong and Bahrain.
Inception & Founders: HDFC Bank was founded in 1994 and is headed by Aditya Puri, he has managed this position since September 1994 making him the longest-serving head of any private sector bank in India.
Chairman & Directors:
Shyamala Gopinath is the chairman & Aditya Puri is the CEO & MD of HDFC Bank.
Customer Segment & Area of Operations:
HDFC Bank is the banking leader that has a wide and diversified customer segments across India and overseas, mainly its customer segments includes Individuals, Large Corporates and Financial Institutions among others. The detailed products and customer segments are defined below:
[caption id="attachment_3767" align="aligncenter" width="620"]
This week we would be exploring HDFC Bank who is one of the highly reputed and India’s largest private sector lender by assets in the banking and financial sector of an Indian economy.
Companies Origin & Profile:
Brief Company Profile: HDFC Bank alias Housing Development Finance Corporation is India’s largest private sector lender by assets. The bank was incorporated on 30th August 1994 with its registered office in Mumbai, India. HDFC Bank was the first amongst to receive an ‘in principle’ approval from RBI (Reserve Bank of India) to set up the bank in private sector, a part of RBI’s liberalization of Indian Banking sector in 1994. HDFC Bank commenced operations as a Scheduled Commercial Bank in January 1995. It has around 88,253 permanents employees and has an overseas presence in Dubai, Hong Kong and Bahrain.
Inception & Founders: HDFC Bank was founded in 1994 and is headed by Aditya Puri, he has managed this position since September 1994 making him the longest-serving head of any private sector bank in India.
Chairman & Directors:
Shyamala Gopinath is the chairman & Aditya Puri is the CEO & MD of HDFC Bank.
Customer Segment & Area of Operations:
HDFC Bank is the banking leader that has a wide and diversified customer segments across India and overseas, mainly its customer segments includes Individuals, Large Corporates and Financial Institutions among others. The detailed products and customer segments are defined below:
[caption id="attachment_3767" align="aligncenter" width="620"]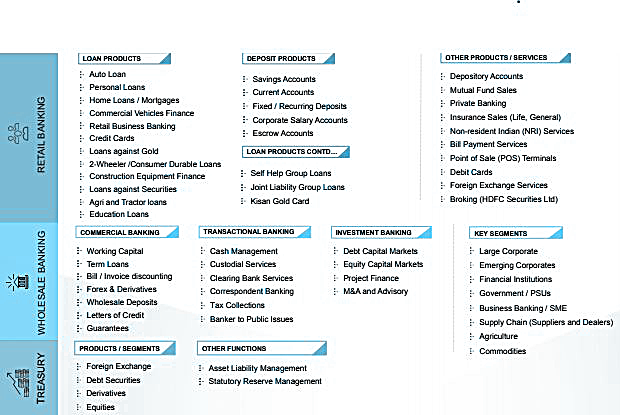 HDFC Product Offering[/caption]
Confidence Booster for Investors:
The following pointers will uplift the confidence of any stock market analyst. As this highlight the favourable business outcomes for HDFC Bank.
HDFC Product Offering[/caption]
Confidence Booster for Investors:
The following pointers will uplift the confidence of any stock market analyst. As this highlight the favourable business outcomes for HDFC Bank.
- The bank has been maintaining a healthy dividend payout of 19.39%.
- The HDFC has generated a good ROCE at 66.30%.
- A Wide range of products to meet various customer needs.
| Particulars | Info |
| Book Value: | 419.54 |
| Market Cap: | 570,599 Cr. |
| ROE: | 17.87 % |
| ROCE: | 66.30 % |
| Current Price: | 2,158 |
| Stock P/E: | 31.36 |
| Sales Growth (3Yrs): | 18.30 % |
| 52 weeks High / Low | 2219.05 / 1685.00 |
| Dividend Yield: | 0.59 % |
| Face Value: | 2 |
| P/B: | 4.85 |
| PEG Ratio | 0.95 |
| Price to book value | 5.839 |
| EPS | 67.38 |
| Return of Equity(3Yrs) | 18.00% |
| authorized share capital | Rs. 650 crore. |
| paid-up share capital | Rs 520,83,15,734 /-(260,41,57,867 equity shares) |
| HDFC Group | 20.86 % |
| ADS / GDR Depositories (in respect of the bank's American Depository Shares (ADS) and Global Depository Receipts (GDR) Issues) | 18.16 % |
| FII's | 33.44 % |
| shareholders. | 5,48,942 |
| S.No. | Name | CMP Rs. | P/E | Mar Cap Rs.Cr. | Div Yld % | NP Qtr Rs.Cr. | Qtr Profit Var % | Sales Qtr Rs.Cr. | Qtr Sales Var % | ROCE % |
| 1 | HDFC Bank | 2158.7 | 31.36 | 570599.39 | 0.59 | 4601.44 | 18.17 | 22548.98 | 20.78 | 66.3 |
| 2 | Kotak Mah. Bank | 1312.7 | 39.99 | 250242.95 | 0.05 | 1574.48 | 57.39 | 6903.37 | 16.31 | 29.69 |
| 3 | ICICI Bank | 299.3 | 41.77 | 192522.56 | 0.76 | -119.55 | -105.83 | 14722.36 | 9.39 | 23.94 |
| 4 | Yes Bank | 365.85 | 18.67 | 84377.46 | 0.74 | 1260.36 | 30.54 | 6578.04 | 41.35 | 53.42 |
| 5 | IndusInd Bank | 2001.35 | 31.58 | 120178.31 | 0.37 | 1035.72 | 23.81 | 5068.15 | 22.55 | 54.47 |
| 6 | Bandhan Bank | 706.95 | 56.19 | 84325.35 | 0.14 | 481.71 | 47.51 | 1556.17 | 34.92 | 52.88 |
| 7 | Indian Bank | 353.3 | 13.48 | 16968.7 | 1.7 | 131.98 | -58.72 | 4463.89 | 11.14 | 53.53 |
| Particulars | Jun-18 | Mar-18 | Dec-17 | Sep-17 | Jun-17 | Mar-17 |
| Sales | 22,548 | 21,321 | 20,581 | 19,670 | 18,668 | 18,114 |
| Expenses | 7,613 | 7,591 | 7,083 | 7,016 | 6,926 | 6,483 |
| Operating Profit | 14,935 | 13,729 | 13,497 | 12,654 | 11,742 | 11,630 |
| OPM % | 66.24% | 64.39% | 65.58% | 64.33% | 62.90% | 64.21% |
| Other Income | 3,818 | 4,228 | 3,869 | 3,605 | 3,516 | 3,446 |
| Depreciation | 0 | 0 | 0 | 0 | 0 | 0 |
| Interest | 11,735 | 10,663 | 10,266 | 9,918 | 9,297 | 9,059 |
| Profit before tax | 7,018 | 7,294 | 7,099 | 6,341 | 5,961 | 6,017 |
| Tax | 2,416 | 2,495 | 2,457 | 2,190 | 2,067 | 2,027 |
| Net Profit | 4,601 | 4,799 | 4,642 | 4,151 | 3,893 | 3,990 |
| Mar-18 | Mar-17 | Mar-16 | Mar-15 | Mar-14 | Mar-13 | |
| Sales | 80,241 | 69,305 | 60,221 | 48,469 | 41,135 | 35,064 |
| Expenses | 27,711 | 22,463 | 18,999 | 15,407 | 12,958 | 12,261 |
| Operating Profit | 52,529 | 46,842 | 41,221 | 33,062 | 28,176 | 22,803 |
| OPM % | 65.46% | 67.59% | 68.45% | 68.21% | 68.50% | 65.03% |
| Other Income | 15,220 | 12,296 | 10,751 | 8,996 | 7,919 | 6,852 |
| Interest | 40,146 | 36,166 | 32,629 | 26,074 | 22,652 | 19,253 |
| Depreciation | 906 | 833 | 705 | 656 | 671 | 651 |
| Profit before tax | 26,697 | 22,139 | 18,637 | 15,328 | 12,772 | 9,750 |
| Tax | 9,210 | 7,589 | 6,341 | 5,112 | 4,293 | 3,024 |
| Net Profit | 17,486 | 14,549 | 12,296 | 10,215 | 8,478 | 6,726 |
| Mar-18 | Mar-17 | Mar-16 | Mar-15 | Mar-14 | Mar-13 | |
| Cash from Operating Activity | 26,074 | 23,585 | -30,132 | -15,862 | 8,363 | -1,868 |
| Cash from Investing Activity | -522 | -1,984 | -627 | -1,933 | -1,623 | -854 |
| Cash from Financing Activity | 48,411 | -11,567 | 33,347 | 14,543 | 5,562 | 9,065 |
| Net Cash Flow | 73,962 | 10,033 | 2,587 | -3,252 | 12,303 | 6,342 |
| Mar-18 | Mar-17 | Mar-16 | Mar-15 | Mar-14 | Mar-13 | |
| Share Capital | 519 | 512 | 505 | 501 | 479 | 475 |
| Reserves | 1,05,775 | 88,949 | 72,172 | 61,508 | 42,998 | 35,738 |
| Borrowings | 9,11,875 | 7,17,668 | 6,31,393 | 4,96,009 | 4,06,776 | 3,29,253 |
| Other Liabilities | 45,817 | 56,830 | 36,818 | 32,557 | 41,402 | 34,922 |
| Total Liabilities | 10,63,988 | 8,63,961 | 7,40,889 | 5,90,576 | 4,91,658 | 4,00,389 |
| Fixed Assets | 3,607 | 3,626 | 3,343 | 3,121 | 2,939 | 2,703 |
| CWIP | 0 | 0 | 0 | 0 | 0 | 0 |
| Investments | 2,42,200 | 2,14,463 | 1,95,836 | 1,51,641 | 1,20,951 | 1,11,613 |
| Other Assets | 8,18,180 | 6,45,871 | 5,41,710 | 4,35,812 | 3,67,767 | 2,86,073 |
| Total Assets | 10,63,988 | 8,63,961 | 7,40,889 | 5,90,576 | 4,91,658 | 4,00,389 |


 Easy & quick
Leave A Comment?