

 Return on Assets (ROA) is a type of profitability ratio that measures the returns generated by a company on its assets. It shows how profitable a company is relative to its assets. For example: The ROA of Reliance Industries is 5.14%. This means that the company generates Rs 5.14 for every Rs 100 in assets.
But why should investors care about return on assets? Let me explain.
What happens when you buy shares of a company? You become a proportionate owner of the company, correct?
What does this mean?
This means you become a proportionate owner of a company’s assets too. A company is nothing but a bunch of assets generating revenue.
When assets are used efficiently, higher revenue is generated. High revenue means more money for investors. This can be in the form of both capital appreciation and dividends. This is why ROA is crucial for investors.
It is also equally important for a company’s management. It helps investors gauge management’s efficiency in managing its assets. After all, one of the main goals of management is to generate higher return on assets. A successful business is one where the management is able to generate maximum profit from limited resources (assets).
Hence ROA is important for both investors and management. However, it is often ignored as investors only focus on return on equity (ROE). This is a flawed approach.
In this article, we will learn how to use ROA in stock selection and also discuss the following:
Return on Assets (ROA) is a type of profitability ratio that measures the returns generated by a company on its assets. It shows how profitable a company is relative to its assets. For example: The ROA of Reliance Industries is 5.14%. This means that the company generates Rs 5.14 for every Rs 100 in assets.
But why should investors care about return on assets? Let me explain.
What happens when you buy shares of a company? You become a proportionate owner of the company, correct?
What does this mean?
This means you become a proportionate owner of a company’s assets too. A company is nothing but a bunch of assets generating revenue.
When assets are used efficiently, higher revenue is generated. High revenue means more money for investors. This can be in the form of both capital appreciation and dividends. This is why ROA is crucial for investors.
It is also equally important for a company’s management. It helps investors gauge management’s efficiency in managing its assets. After all, one of the main goals of management is to generate higher return on assets. A successful business is one where the management is able to generate maximum profit from limited resources (assets).
Hence ROA is important for both investors and management. However, it is often ignored as investors only focus on return on equity (ROE). This is a flawed approach.
In this article, we will learn how to use ROA in stock selection and also discuss the following:
What is Return on Assets (ROA)?
Return on Assets is also known as total return on assets. As the name suggests, it helps investors understand the return a company generates on its assets. Higher the return on assets ratio, the more efficient a company’s management is in generating value for its investors. A company has two types of assets:- Tangible Assets
- Intangible Assets
- High Tangible Assets = Low ROA
- High Intangible Assets = High ROA
Return on Assets (ROA) Example
We have all had tea from the roadside chaiwala. Do you recall seeing a cloth used to strain the tea? This cloth contains tea leaves and ginger. These are assets for a chaiwala.
What does he do with these strained ingredients? Does he throw it away after one use?
Absolutely Not!
The same tea leaves and ginger is used to make another batch of tea. What is the chaiwala doing? He is maximising his return on assets.
Let’s say he makes 20 cups of tea with 100 grams of tea leaves and 20 grams of ginger. His total profit is Rs 100.
By reusing the same ginger and tea leaves, he manages to make another 20 cups of tea. So, he ends up making a profit of Rs 200 with the same quantity of assets (ginger and tea leaves).
Let us now understand how ROA helps in stock selection with the below example.
There are two companies in the same sector.
This cloth contains tea leaves and ginger. These are assets for a chaiwala.
What does he do with these strained ingredients? Does he throw it away after one use?
Absolutely Not!
The same tea leaves and ginger is used to make another batch of tea. What is the chaiwala doing? He is maximising his return on assets.
Let’s say he makes 20 cups of tea with 100 grams of tea leaves and 20 grams of ginger. His total profit is Rs 100.
By reusing the same ginger and tea leaves, he manages to make another 20 cups of tea. So, he ends up making a profit of Rs 200 with the same quantity of assets (ginger and tea leaves).
Let us now understand how ROA helps in stock selection with the below example.
There are two companies in the same sector.
- ABC Ltd.’s net profit is Rs 10,000.
- XYZ Ltd.’s net profit is Rs 20,000.
- ABC Ltd.’s ROA = (Rs 10,000 / Rs 1,00,000) = 10%
- XYZ Ltd.’s ROA = (Rs 20,000 / Rs 2,50,000) = 8%
How to Calculate Return on Assets (ROA)?
There are three formulas to calculate return on assets:- Return on Assets Formula = Earnings Before Interest and Tax (EBIT)/ Total Assets
- Return on Assets Formula = Profit after tax (PAT) + Interest *(1-Tax rate) / Total Assets
- Return on Assets Formula = Net Profit / Total Assets.
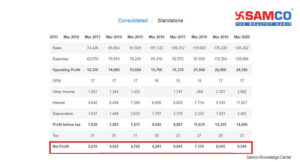 Total Assets on 31st March 2020 were worth Rs 3,06,687 crores.
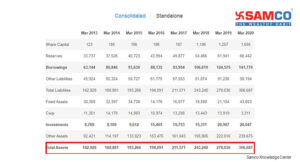 ROA = Net Profit / Total Assets
= Rs 9,549 / Rs 3,06,687
= 3.11%
The ROA of L&T is 3.11%. This is below our minimum ideal ROA of 5%. This is one of the reasons why L&T is a 0.5 star rated stock.
In comparison, the ROA of Tata Consultancy Ltd (TCS) is 34.9%.
So, can we conclude that TCS is a better company because it has higher ROA?
No.
L&T is a construction company with very high tangible assets. Whereas TCS is a software company with low tangible assets. Comparing ROA of different sectors is quite pointless. ROA should always be used in comparing companies in the same industry.
ROA = Net Profit / Total Assets
= Rs 9,549 / Rs 3,06,687
= 3.11%
The ROA of L&T is 3.11%. This is below our minimum ideal ROA of 5%. This is one of the reasons why L&T is a 0.5 star rated stock.
In comparison, the ROA of Tata Consultancy Ltd (TCS) is 34.9%.
So, can we conclude that TCS is a better company because it has higher ROA?
No.
L&T is a construction company with very high tangible assets. Whereas TCS is a software company with low tangible assets. Comparing ROA of different sectors is quite pointless. ROA should always be used in comparing companies in the same industry.
What is the Ideal ROA Ratio?
Ideal Return on Assets is above 5%. Companies with ROA of less than 5% are not asset-efficient and should be avoided. A ROA of more than 20% signals attractive investment opportunities. However, different sectors have different ideal return on assets ratios. Asset heavy businesses like cement, steel, power, refining etc have lower ROA. The ROA of service sector is very high. For example: IT companies and banks. Industry ROA comparison is wrong as some companies require massive assets to generate revenue. For example: Car manufacturers or Oil refining companies. They will naturally have lower ROA compared to banks. Let us evaluate the return on assets of banking and commercial vehicles sector.How to Evaluate Companies Using Return on Assets
The below table shows the ROA, ROE and ROCE of commercial vehicle stocks as on March 2020.| Commercial Vehicles Sector Stocks | ROCE | ROE | ROA | Market Cap (in Crores) |
| Tata Motors Ltd | -0.37% | -19.70% | -4.75% | 1,07,364 |
| Ashok Leyland Ltd | 8.85% | 4.25% | 1.55% | 33,538 |
| Escorts Ltd | 19.10% | 14.60% | 15.30% | 15,676 |
| BEML Ltd | 2.31% | 2.88% | 1.85% | 4,894 |
| Garden Reach Shipbuilders & Engineers Ltd | 22.40% | 16.20% | 15.10% | 1,959 |
| VST Tillers Tractors Ltd | 6.29% | 4.18% | 3.89% | 1,566 |
| SML ISUZU Ltd | -3.88% | -5.32% | -3.18% | 660 |
| Titagarh Wagons Ltd | 1.81% | -4.63% | -2.19% | 554 |
| Gujarat Apollo Industries Ltd | 3.55% | 5.38% | 5.27% | 271 |
| Skyline Millars Ltd | 3.92% | 3.92% | 3.69% | 31 |
| Brady & Morris Engineering Company Ltd | 11.10% | 7.91% | 6.47% | 18 |
| Laxmipati Engineering Works Ltd | 12.00% | 14.50% | 7.02% | 14 |
| Cranex Ltd | 6.83% | 9.64% | 2.53% | 6 |
| Average | 7.22% | 4.14% | 4.04% |
| Public Sector Banks | Market Capitalisation | ROCE | ROA | ROE |
| State Bank of India | 3,19,724 | 4.99% | 0.45% | 6.79% |
| Punjab National Bank | 37,982 | 4.69% | 0.05% | 0.73% |
| Bank of Baroda | 36,484 | 5.06% | 0.10% | 1.47% |
| Indian Overseas Bank | 26,053 | 1.53% | -3.49% | -52.50% |
| Canara Bank | 23,762 | 4.95% | -0.28% | -5.04% |
| Bank of India | 22,168 | 3.59% | -0.49% | -7.03% |
| Union Bank of India | 22,136 | 4.23% | -0.61% | -10.30% |
| Bank of Maharashtra | 15,974 | 4.98% | 0.05% | 5.24% |
| Indian Bank | 12,751 | 5.25% | 0.30% | 4.05% |
| UCO Bank | 11,208 | 2.82% | -1.08% | -14.80% |
| Central Bank of India | 9,636 | 4.47% | -0.37% | -6.17% |
| Punjab & Sind Bank | 7,660 | 4.23% | -0.97% | -17.60% |
| Average | 4.23% | -0.58% | -7.93% |
| Top 5 Private Sector Banks | ROCE | ROA | ROE |
| HDFC Bank | 6.76% | 2.11% | 18.00% |
| ICICI Bank | 6.04% | 1.58% | 15.00% |
| Kotak Mahindra Bank | 6.65% | 2.35% | 14.90% |
| Axis Bank | 5.06% | 0.82% | 8.33% |
| IndusInd Bank | 6.54% | 0.98% | 8.60% |
| Average | 6.21% | 1.57% | 12.97% |
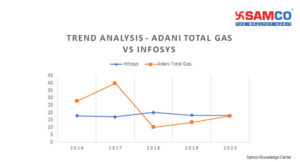 A look at Adani Total Gas Ltd.’s ROA over the last five years will show you why you shouldn’t invest in the stock. It’s return on assets rose by 43.50% between 2016-17. The very next year, it fell by 74.69%! In the next year, it again increased by 33.14%. Like a roller-coaster ride.
Whereas the return on assets of Infosys Ltd has been consistent throughout the last five years. It’s no wonder that Infosys Ltd is a 4-star rated stock!
Note: While both Adani Total Gas Ltd and Infosys Ltd belong to different sectors, the focus is on the volatility of their returns.
However, there is an exception here. The return on equity of Tesla was -50% in 2013. This was the time the company was investing heavily in machinery to build model S cars. But with rising sales and profit, this reduced to -3.9% in 2017. In 2021, Tesla’s ROA is 3.33%. So, while a negative ratio is acceptable, the 5-year trend should be moving upwards.
Like all financial ratios, even return on assets can be easily manipulated by decreasing total assets. This is done by leasing assets rather than buying them or achieving higher inventory turnover.
To combat this issue, a variation of return on asset is used – Return on Operating Asset (ROOA).
ROOA measures the efficiency of only operating assets. This is especially useful in cyclical businesses. For example: When demand is high, businesses will increase assets to achieve higher turnover. Whereas when demand falls, businesses sell extra assets to increase revenue. Hence ROOA is more accurate than return on assets.
A look at Adani Total Gas Ltd.’s ROA over the last five years will show you why you shouldn’t invest in the stock. It’s return on assets rose by 43.50% between 2016-17. The very next year, it fell by 74.69%! In the next year, it again increased by 33.14%. Like a roller-coaster ride.
Whereas the return on assets of Infosys Ltd has been consistent throughout the last five years. It’s no wonder that Infosys Ltd is a 4-star rated stock!
Note: While both Adani Total Gas Ltd and Infosys Ltd belong to different sectors, the focus is on the volatility of their returns.
However, there is an exception here. The return on equity of Tesla was -50% in 2013. This was the time the company was investing heavily in machinery to build model S cars. But with rising sales and profit, this reduced to -3.9% in 2017. In 2021, Tesla’s ROA is 3.33%. So, while a negative ratio is acceptable, the 5-year trend should be moving upwards.
Like all financial ratios, even return on assets can be easily manipulated by decreasing total assets. This is done by leasing assets rather than buying them or achieving higher inventory turnover.
To combat this issue, a variation of return on asset is used – Return on Operating Asset (ROOA).
ROOA measures the efficiency of only operating assets. This is especially useful in cyclical businesses. For example: When demand is high, businesses will increase assets to achieve higher turnover. Whereas when demand falls, businesses sell extra assets to increase revenue. Hence ROOA is more accurate than return on assets.
Here is the list of the 10 best stocks in India with ROA of more than 20%
| Stocks with highest ROA | ROA | ROE |
| Colgate Palmolive (India) Ltd | 49.81% | 53.70% |
| IRCTC | 40.71% | 44.14% |
| Nestle India Ltd | 39.77% | 105.76% |
| P&G Hygiene and HealthCare Ltd | 39.40% | 42.09% |
| Britannia Industries Ltd | 35.49% | 46.89% |
| Tata Consultancy Services Ltd | 34.94% | 39.06% |
| Marico Ltd | 33.79% | 36.95% |
| HDFC Asset Management Company Ltd | 29.85% | 30.11% |
| Mindtree Ltd | 25.82% | 29.71% |
| Hindustan Unilever Ltd | 23.88% | 29.25% |
FAQs on Return on Assets
- What does ROA mean in business?
- What is a good ROA?
- Is a high ROA good?
- How do you calculate return on assets?
- How do you calculate average total assets?
- How do you increase return on assets?
- Which is better ROA or ROE?
- What is a good ROA for banks?
- What does an increasing ROA mean?
- Can a company have negative return on assets?


 Easy & quick
Leave A Comment?