

 One of the biggest mistakes an investor makes is not taking time to understand their company’s financial statements. A financial statement comprises of three main statements -
In our previous article, we understood how to read an Annual Report of a company and the importance of these statements. In this article, we will focus on how to read and analyse a Balance Sheet. These statements are important in fundamental analysis.
One of the biggest mistakes an investor makes is not taking time to understand their company’s financial statements. A financial statement comprises of three main statements -
In our previous article, we understood how to read an Annual Report of a company and the importance of these statements. In this article, we will focus on how to read and analyse a Balance Sheet. These statements are important in fundamental analysis.
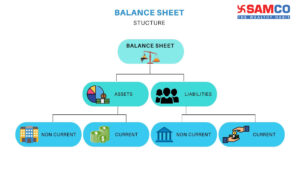 A Balance Sheet gives us an overview of what a company owns and how much it owes to others. It tells us a business’s worth at a given time.
How to identify if a particular company is good for a short-term investment or a long-term investment? Which ratios can identify if the company has enough cash to pay its lenders? Is the company paying dividends? A Balance Sheet answers all these questions.
Here is a real example of a Balance Sheet – Dabur India Limited’s 2019-20 Annual Report.
A Balance Sheet gives us an overview of what a company owns and how much it owes to others. It tells us a business’s worth at a given time.
How to identify if a particular company is good for a short-term investment or a long-term investment? Which ratios can identify if the company has enough cash to pay its lenders? Is the company paying dividends? A Balance Sheet answers all these questions.
Here is a real example of a Balance Sheet – Dabur India Limited’s 2019-20 Annual Report.
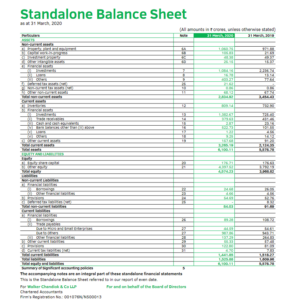 Let’s break this down and learn how to analyse it, starting with the asset side.
Asset Side:
Assets are what helps a company generate revenue. It includes cash, inventory, property, etc. They are important for a company to grow and survive. Having few or poor assets may cause various financial problems and difficulty. For example, cash reserves are important to meet daily needs. A company needs property, plant and equipment for manufacturing goods and services. These are basic examples of what assets are and why we need them. Here is Dabur India’s 2019-20 asset side -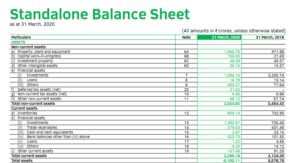
-
Non-Current Assets:
- Property, Plant and Equipment (P,P&E)
- Intangible Assets
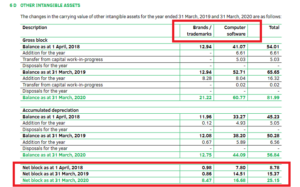 We can observe that these assets consist of brands, trademarks and computer software. Dabur India’s trademark was at Rs. 0.86 crores in 2019 which went up to 8.47 by the end of 2020. Using this information, we can observe which area is the company progressing in.
- Deferred Tax Asset
-
Current Assets:
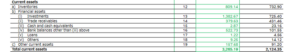
- Inventories
- Trade Receivables
- Changes in credit policies.
- Weak economy due to Covid-19 outbreak.
- Cash payment/recovery of goods which were previously on credit.
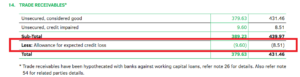 A sharp increase indicates that the company is selling goods to riskier customers. In our example, the allowance has increased by 12.8%. Given 2020’s economic situation, we could reason the bad-debts increase to the crisis.
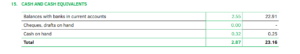
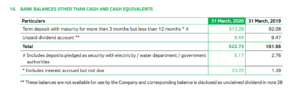
- Cash and Equivalents
 This was the asset side of a Balance Sheet. We will learn about various ratios which we can calculate to make the most of the reported data further. But before that, let’s understand the liability side.
Equity and Liability Side:
Liabilities are the funds that the company owes to others. Within liabilities, there are three subsections – equity, non-current liabilities, and current liabilities. Here is a snapshot of Dabur India Limited’s liability side of Balance Sheet -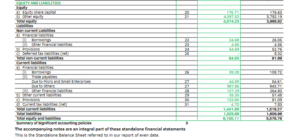
- Equity
 On the balance sheet, it is calculated using this formula:
Shareholder’s equity = Assets – Liability.
On the balance sheet, it is calculated using this formula:
Shareholder’s equity = Assets – Liability.
- Share Capital
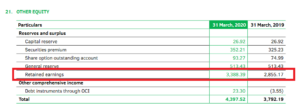 Capital reserve, security premium and general reserves are of the same amount as last year. But we see an increase in share option outstanding account and retained earnings. Retained earnings went up by almost 18.68% which is a positive point to note.
Retained earnings is a part of net earnings or the profit a company makes. A part of profit is retained by the company to either reinvest in the business or use to pay off debt. The rest is distributed as dividends to the shareholders.
Increasing retained earnings is good, because it means the company is staying profitable.
Capital reserve, security premium and general reserves are of the same amount as last year. But we see an increase in share option outstanding account and retained earnings. Retained earnings went up by almost 18.68% which is a positive point to note.
Retained earnings is a part of net earnings or the profit a company makes. A part of profit is retained by the company to either reinvest in the business or use to pay off debt. The rest is distributed as dividends to the shareholders.
Increasing retained earnings is good, because it means the company is staying profitable.
C) Liabilities
Liabilities are the obligations on the company which need to be paid back. It is what the company owes to the outsider. Liabilities are not always bad. They help a company grow the business. For example, raw materials bought on credit, loans from the bank, etc. These are further divided into current and non-current liability. Let’s break it down by continuing with our same example –-
Non-Current Liabilities
- Borrowings
- Deferred Tax Liabilities
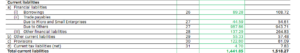
2. Current Liabilities
Current Liabilities are obligations which need to be paid within one year. For example, the amount owed to the supplier after a credit purchase, short term loan, etc.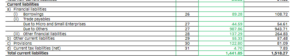
- Borrowing
- Trade Payable
- Current Tax Liability
Balance Sheet Ratios:
Liquidity, efficiency, leverage, and rates of return ratios are 4 important performance metrics. We must calculate these ratios to understand the ongoing performance of a company. We will learn how to calculate all the ratios in our next article. For now, let’s familiarize ourselves with these 4 categories of financial ratios with the help of this image –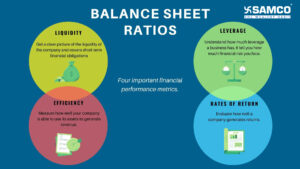


 Easy & quick
Leave A Comment?