
Do you want to be a successful short-term trader? In that case, you need to focus on technical analysis and learn how to evaluate historical price changes. Many beginner traders approach trading with the same mindset as investors. However, while investing has a long-term outlook, trading requires a quick analysis of price movements. This way, you can set reasonable expectations about how the market may move — and place your trades accordingly.
However, the chart patterns for swing trading may be different from the chart patterns for intraday trading and other strategies. So, given the different types of chart patterns, how do you know which ones to use? In this article, we explore such crucial questions and help you decode the different types of chart patterns in the stock market.
What are Chart Patterns?
Chart patterns are graphical representations of the price action of different stocks and securities in the market. These patterns can be represented using various kinds of graphs, which is why we have many different types of chart patterns in the stock market.
If you are trading in the market, you can study chart patterns to get a clear idea of the price history of various stocks and securities in recent trading sessions. This, in turn, can help you assess how the prices may move in the near future. You can then make an educated estimate of the kind of trades to place in the market based on the expected price movement.
Types of Chart Patterns
Depending on the type of graphs used to depict price movements, the following different types of chart patterns are available for traders.
Line Chart Patterns
Line chart patterns are among the simplest and most widely used tools for identifying trends in the stock market. These patterns are typically formed by connecting the closing prices over a specific period to create a smooth visual representation of price movement.
You can use line charts to spot trend reversals, continuation patterns, support and resistance levels and overall market direction. They are also effective as chart patterns for swing trading as they help identify long-term trends and key breakout points.
Bar Chart Patterns
Bar chart patterns offer a more detailed view of price movements by displaying the open, high, low and close prices for each period. These patterns help identify market sentiment, trend continuation and potential reversals.
Chart patterns for options trading or swing trading often rely on bar charts to time entry and exit points effectively as they highlight key price levels and volatility. If you prefer a structured approach to technical analysis, you can use bar charts to navigate market fluctuations.
Candlestick Chart Patterns
Candlestick chart patterns are widely used because they offer deep insights into market sentiment and price action. These patterns — like doji, engulfing, hammer and morning star patterns — are formed by individual candlesticks or a series of candlesticks.
Such formations help identify reversals, trend continuations and breakout opportunities. Chart patterns for options trading and intraday trading typically rely on candlestick analysis because traders need precise timing to capitalise on price swings in the stock and options markets.
The Importance of Chart Patterns in Trading
The different types of chart patterns are important because they help you make informed decisions about trading. Here are the key reasons such patterns are crucial for traders.
Predicting Market Trends
Chart patterns play a crucial role in identifying market trends and anticipating potential price movements. Recognising the different types of chart patterns in the stock market can make it easier for you to trade smartly, whether you are looking for breakouts, reversals or trend continuations. This, in turn, enhances risk management and improves the timing of trades.
Improving Swing Trading Strategies
Chart patterns for swing trading help spot entry and exit points with precision, so you can capitalise on short-term and medium-term price movements more effectively. You can identify patterns like flags, pennants and triangles — and frame strategies that maximise gains and minimise potential losses by providing clear indications of trend strength and reversals.
Optimising Intraday Trading Decisions
Intraday traders rely on quick and accurate pattern recognition to make fast trading decisions. Chart patterns for intraday trading make it easier to gauge market momentum and strategise quickly. By analysing these patterns, you can take advantage of short-term price fluctuations and execute timely trades that have a higher probability of success.
Chart Patterns for Swing Trading
Swing trading relies on capturing short-term and medium-term price movements. Chart patterns play a crucial role in identifying profitable opportunities. By recognising key formations, you can time your trades effectively. Let’s explore how chart patterns for swing trading can enhance your trading strategy.
Cup and Handle
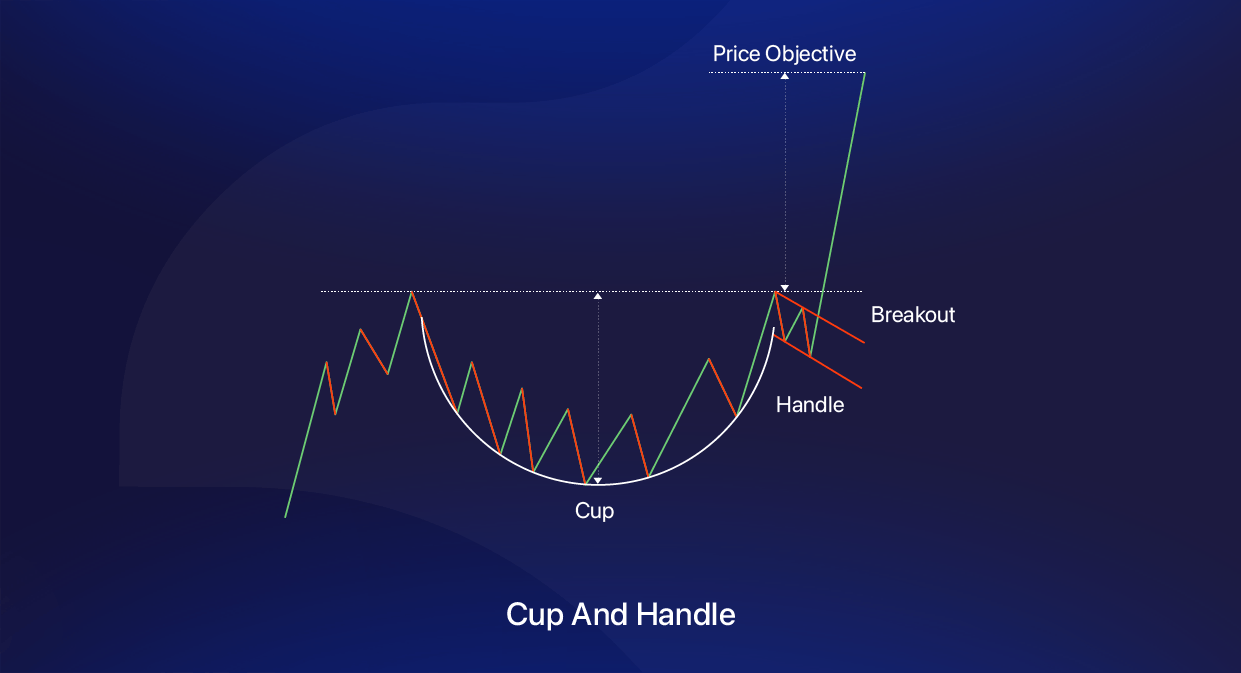
Appearance: The cup and handle pattern resembles a teacup, where the cup forms a rounded bottom and the handle is a small consolidation or downward drift before a breakout.
Signal: This pattern is a bullish continuation signal. It indicates that after a period of consolidation, the price is likely to break out and move higher.
Interpretation: The cup represents a period of accumulation, while the handle shows a minor pullback before the buyers take control. A breakout from the handle is a sign of strong upside momentum.
How to Trade: Enter the trade when the price breaks above the handle’s resistance because this confirms the breakout. Set a stop-loss below the handle and target a price move equal to the depth of the cup.
Rounding/Saucer Bottom
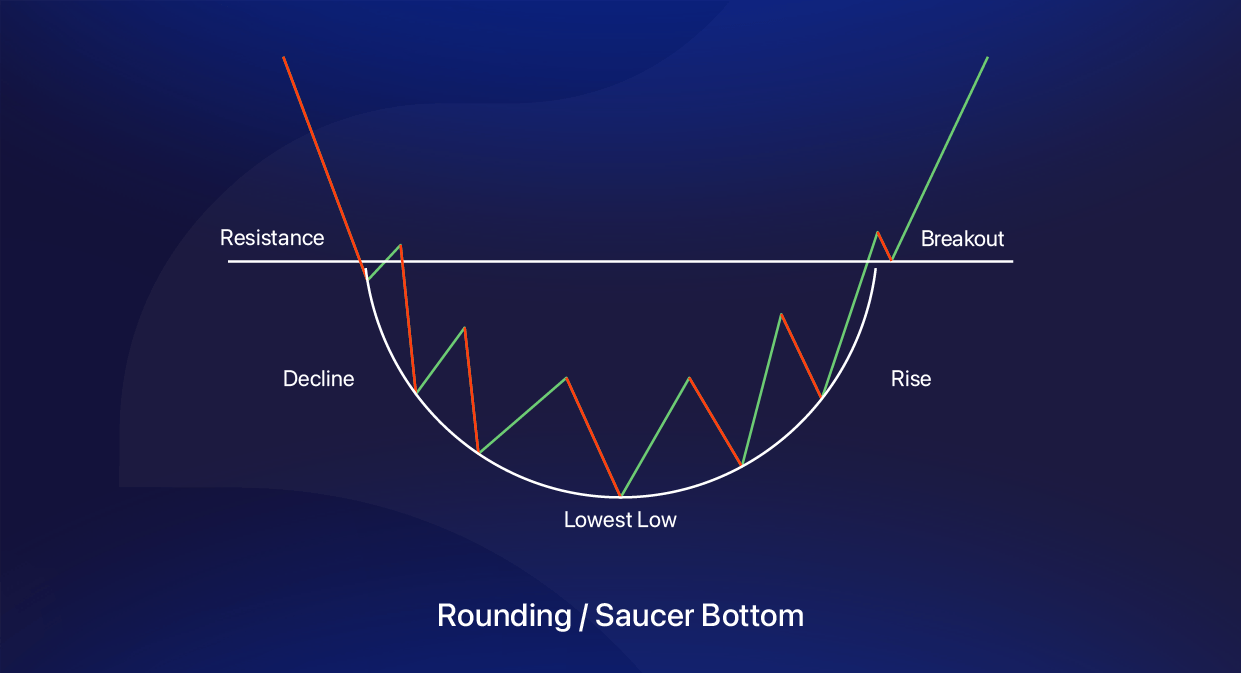
Signal: This pattern is a bullish reversal signal. It indicates that selling pressure has faded and buyers are regaining control — leading to a potential uptrend.
Interpretation: A prolonged decline followed by a steady recovery suggests accumulation by investors. The breakout above resistance confirms a shift in market sentiment from bearish to bullish.
How to Trade: You can enter the trade after the breakout above the resistance level and set a stop-loss below recent lows. Target a price move equal to the depth of the saucer.
Head and Shoulder and Inverse Head and Shoulder
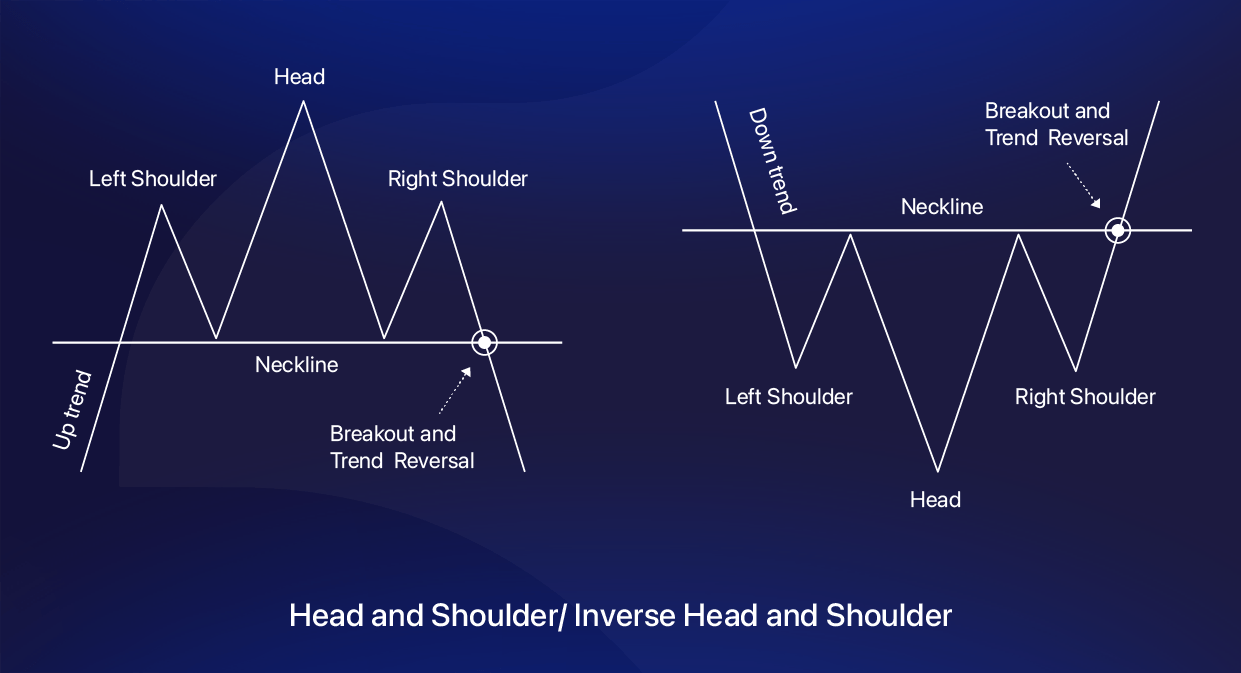
Signal: The head and shoulders pattern is a sign of a bearish reversal — where a prevailing uptrend is weakening. The inverse head and shoulders, however, is seen as a bullish reversal that suggests the end of a downtrend.
Interpretation: In a head and shoulders, buyers fail to sustain higher prices and a neckline breakdown confirms a downtrend. In an inverse head and shoulders, sellers lose control and a breakout above the neckline confirms a bullish shift.
How to Trade: For a head and shoulders pattern, short the asset after the neckline breaks down and use a stop-loss above the right shoulder. For an inverse head and shoulders, go long after a breakout above the neckline and set a stop-loss below the right shoulder. The price target for both is the distance from the head to the neckline.
Triangle Pattern (Symmetrical, Ascending and Descending)
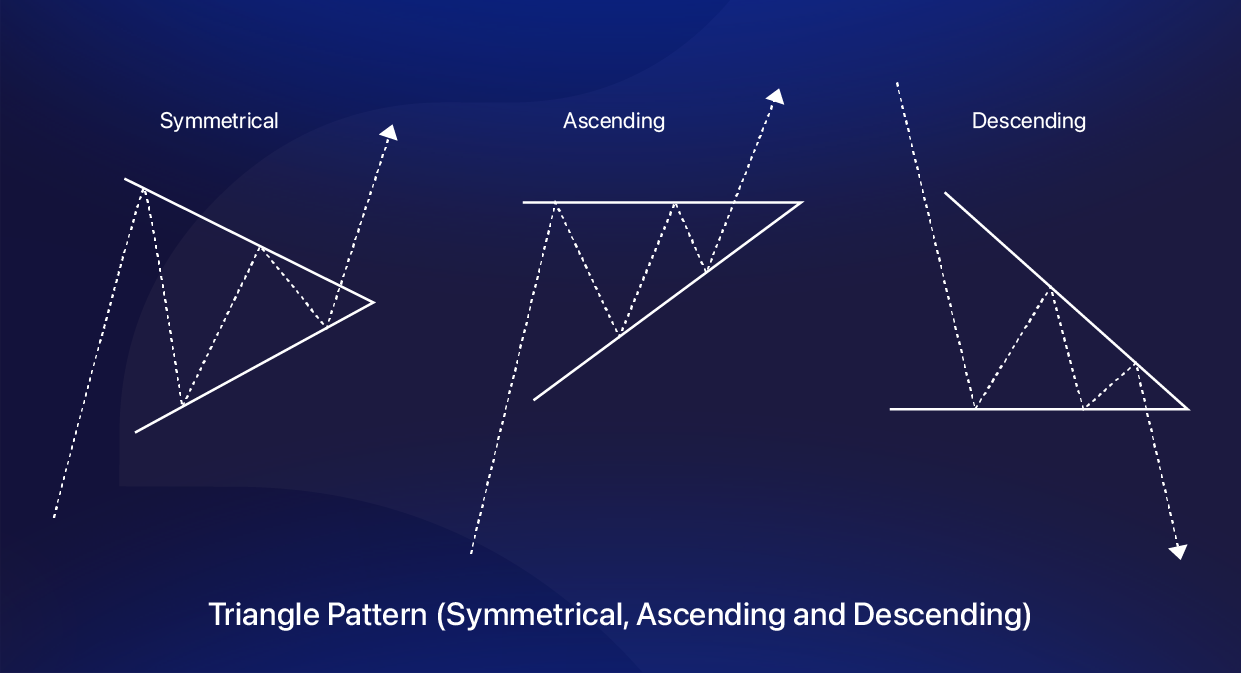
Signal: A symmetrical triangle signals a potential breakout in either direction. An ascending triangle indicates a bullish breakout, while a descending triangle suggests a bearish breakdown.
Interpretation: Triangles represent periods of consolidation before a significant move. A breakout confirms whether buyers or sellers gain control. Ascending triangles show strong buying pressure while descending triangles indicate selling dominance.
How to Trade: Open a trade after a confirmed breakout above the resistance level (for bullish patterns) or below the support (for bearish patterns). Set a stop-loss inside the triangle and target a price move equal to the triangle’s height.
Chart Patterns for Options Trading
Options trading demands precise timing. Chart patterns can help you spot potential price breakouts or trend reversals. You can even assess volatility shifts with these tools. By analysing the key formations, you can make informed decisions about strike prices and expiries. Let’s check the common chart patterns for options trading.
Trend line

Signal: A sustained trend line suggests price continuation. However, a break below an ascending trend line signals a bearish shift, while a break above a descending trend line suggests bullish momentum.
Interpretation: For options traders, a break in the trend line is a strong signal for potential volatility. A break below an uptrend line can indicate rising put option demand, while a breakout above a downtrend line suggests a surge in call option activity.
How to Trade: Enter an options trade when the price breaks the trend line. If the trend line breaks down, consider buying put options, and if it breaks upward, you could buy call options. Use the strength of the trend line as a guide to set strike prices and expiration dates.
Double Top/Triple Top
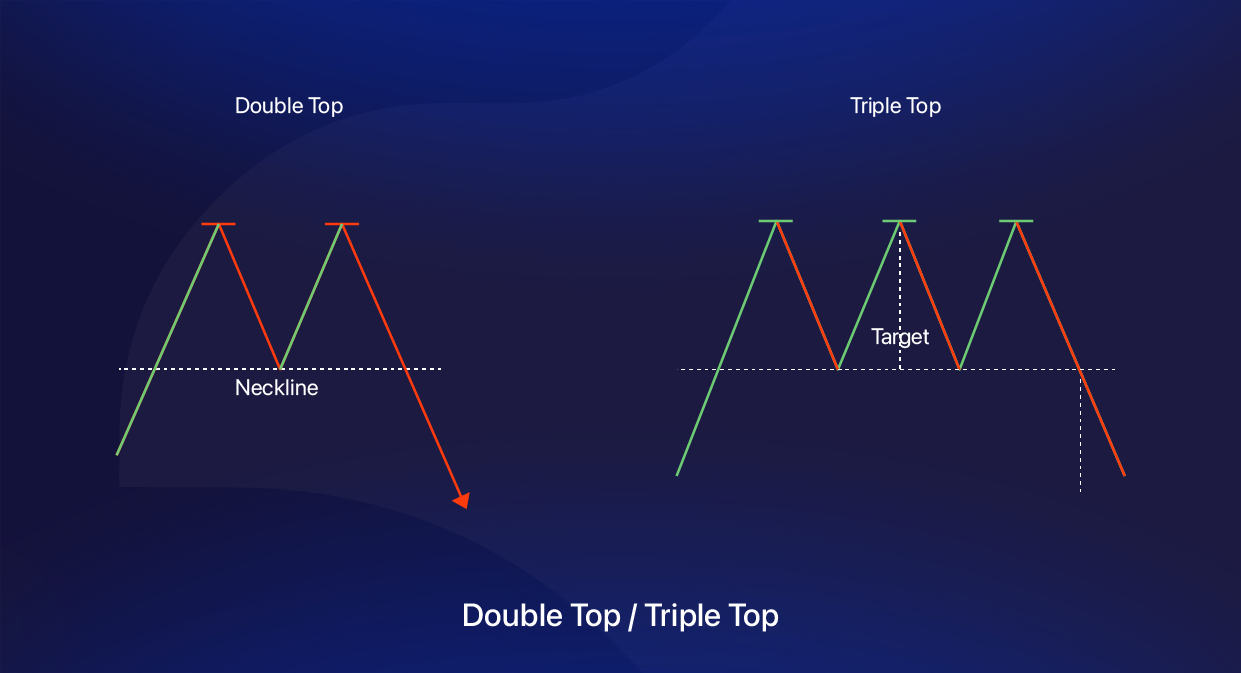
Signal: Both patterns signal a bearish reversal, where the uptrend is losing strength. A breakdown below the neckline confirms a shift in momentum.
Interpretation: For options traders, a double or triple top breakdown suggests an opportunity to buy put options. The repeated failure to break resistance implies strong selling pressure, which increases the likelihood of further decline.
How to Trade: Initiate a put option trade once the neckline breaks and confirms the downtrend. The price target is the height of the pattern projected downward. You can set a stop-loss above the recent peak to manage your risk.
Double Bottom/Triple Bottom

Signal: These patterns signal a bullish reversal and indicate that the downtrend is weakening. A breakout above the neckline confirms an upward trend.
Interpretation: For options traders, a double or triple bottom breakout suggests an opportunity to buy call options. The pattern signifies that buyers are stepping in to push the price higher after repeatedly testing the support.
How to Trade: Enter a call option trade once the neckline breaks and confirms the bullish momentum. The target price is the height of the pattern projected upwards. A stop-loss can be placed below the lowest bottom to manage risk.
Flags
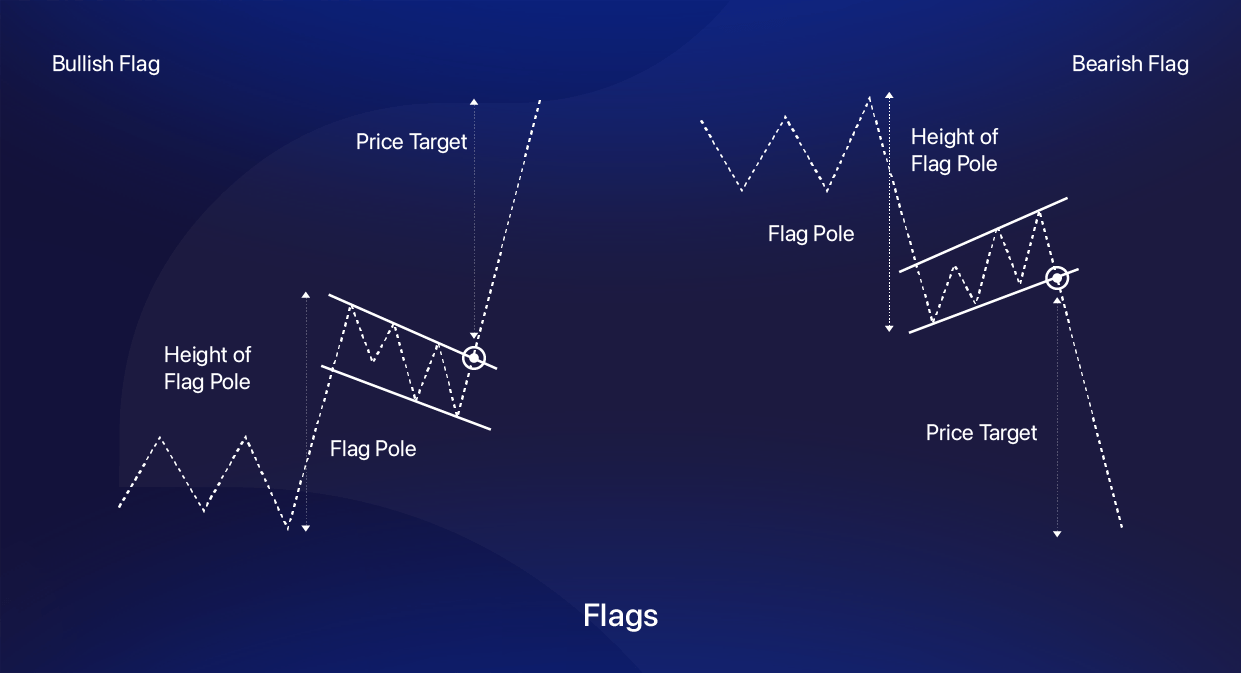
Signal: A bullish flag indicates that an uptrend may continue, while a bearish flag indicates the continuation of a downtrend.
Interpretation: For options traders, flags provide excellent opportunities to enter momentum trades. A bullish flag breakout may be a sign to buy call options, while a bearish flag breakdown signals an opportunity for put options.
How to Trade: Enter a call option trade on a bullish flag breakout above the resistance level, or initiate a put option trade when a bearish flag breaks down below support. The price target can be equal to the flagpole’s height, with a stop-loss placed within the flag’s range.
Pennants
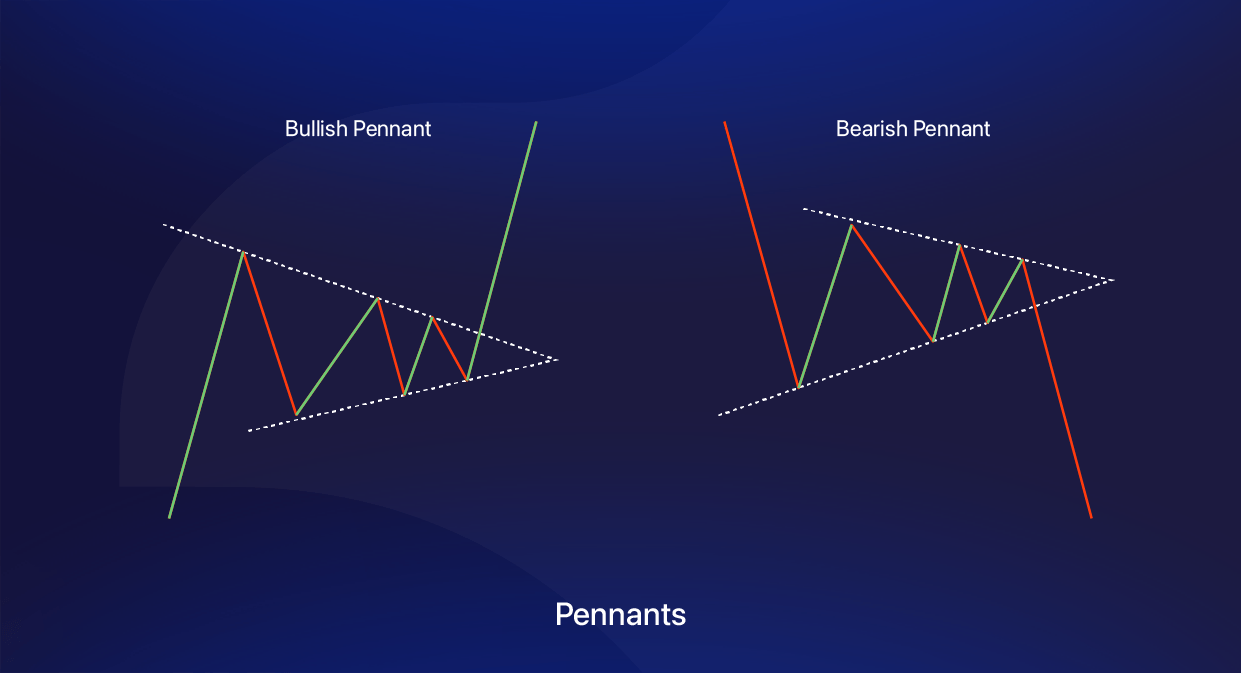
Signal: A bullish pennant points to a continuation of the uptrend, while a bearish pennant indicates further downside. A breakout confirms the next strong move in the market.
Interpretation: For options traders, pennants offer excellent trading opportunities due to their high probability of a strong price movement post-breakout. A bullish breakout is ideal for call options, while a bearish breakdown favours put options.
How to Trade: Enter a call option trade after a bullish pennant breakout or a put option trade after a bearish pennant breakdown. The target price equals the flagpole’s height, with a stop-loss set inside the pennant’s price levels.
Wedge
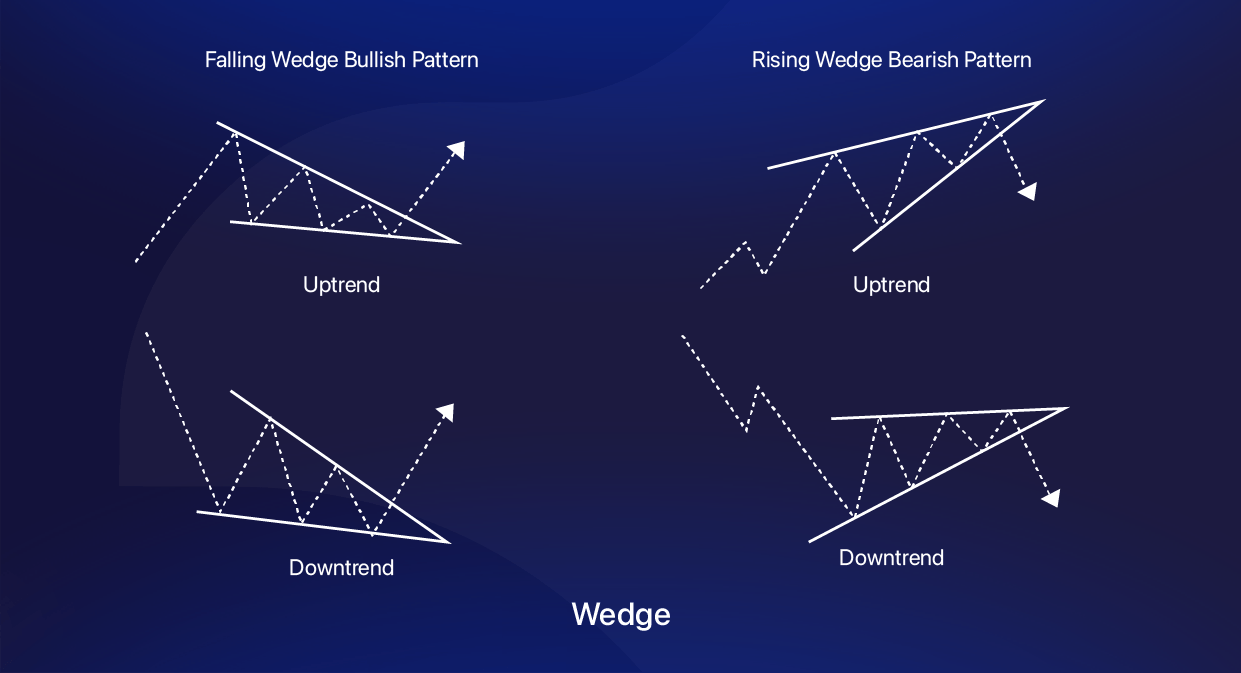
Signal: A falling wedge signals a bullish reversal or continuation, while a rising wedge suggests a bearish reversal. A confirmed breakout in either direction determines the trend's strength.
Interpretation: For options traders, a falling wedge breakout is a strong call option signal as it indicates a price surge. Conversely, a rising wedge breakdown suggests an opportunity for put options as the price weakness leads to a decline.
How to Trade: Enter a trade with a call option after a falling wedge breakout and a put option after a rising wedge breakdown. The price target can be equal to the pattern’s height and the stop-loss can be set inside the wedge’s price range.
How to Use Chart Patterns Effectively in Trading?
Now that you know what the key chart patterns for options trading and swing trading are, let us discuss some essential tips to use these tools effectively in trading.
Identify the Right Patterns for Your Strategy
Understanding the different types of chart patterns in the stock market helps you align your strategy with market conditions. Whether you're looking for trend reversals or breakouts, recognising the right pattern improves the accuracy of your trade and ensures you do not act on random price movements.
Combine Patterns with Technical Indicators
Relying solely on chart patterns for swing trading or intraday trades isn’t enough. You should also confirm the signals you notice with technical indicators like moving averages, Relative Strength Index (RSI) and Moving Average Convergence/Divergence (MACD). This approach strengthens your analysis, reduces false signals and increases the probability of success.
Use Patterns for Better Trade Timing
If you trade options, timing is critical. Chart patterns for options trading can make it easier for you to enter the market at optimal moments, so you benefit from volatility and price swings. Patterns like triangles and flags help identify breakouts and give you an edge when selecting strike prices and expiry dates.
Adapt Patterns to Fast-Paced Intraday Trading
For short-term traders, quick decisions matter. Chart patterns for intraday trading like head and shoulders or double tops provide valuable insights into market momentum. Mastering these patterns enables you to react swiftly, set stop losses effectively, and seize profit opportunities in volatile market conditions.
Conclusion
This sums up our guide on the different types of chart patterns you can use for trading. Keep in mind that depending on the market cycle, breakout patterns or continuation patterns may appear. It is always a good idea to wait for confirmation of any price movement before making a trade based on a pattern. This will help you avoid false signals.
To ensure that you have access to the best charting tools, you need to choose a suitable stockbroker. Samco Securities can be the trusted brokerage partner you seek. With live TradingView charts integrated into the Samco trading app, keeping up with the price changes in the market has never been easier. Open a demat and trading account with Samco Securities today to access these chart patterns and more tools free of cost.


 Easy & quick
Leave A Comment?