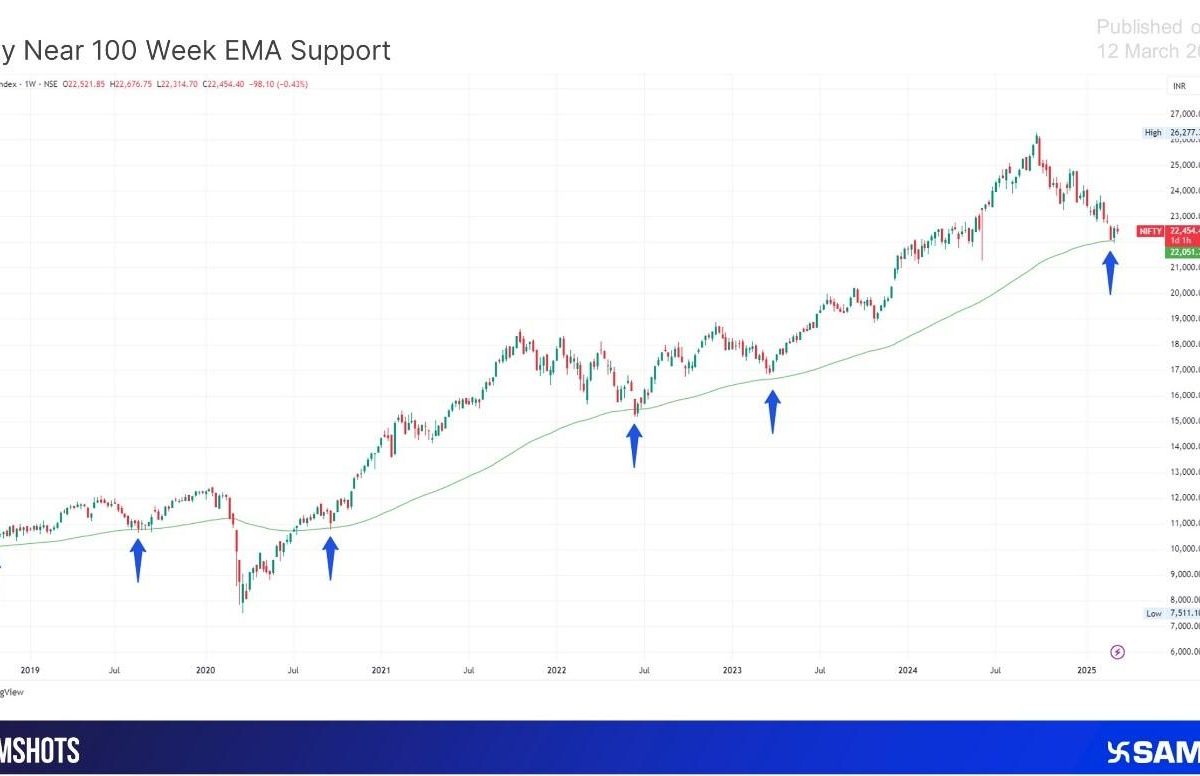
Last week's market action has traders buzzing about a familiar technical pattern again. The Nifty 50 index has bounced back from its 100-week Exponential Moving Average (EMA), a level that's become a line in the sand for India's benchmark index over recent years.
This isn't just any old support level. For the past six years, the 100-week EMA has repeatedly acted as a springboard for the Nifty, with only the COVID-19 crash in 2020 convincingly breaking this pattern. When markets went into free-fall during those pandemic days, all technical levels went out the window—but that was an extraordinary circumstance.
How Did Nifty Performed Last Week?
The Nifty bounced Back once it Hit the 100-EMA Level and rebounded sharply. This Bounce Signals that The Buyers are still active in the market and are Fighting to Defend this historical Support Zone. There's an unwritten rule among the Bulls: "When Nifty hits the 100-week EMA, it's time to buy."
I've been tracking this pattern for years, and it's remarkable how consistently it plays out. When the index respects this level, it typically leads to positive momentum and a continuation of the broader trend in subsequent weeks. The market breathes, tests this support, and resumes its journey.
What does this mean for March 2025?
The 100-week EMA currently stands at 21,949 – a number traders should memorize. If Nifty Continues with this momentum and continues over this level, the Bull Run can potentially be seen and push for a recovery in the Second half of March.
But here's the thing – if the index fails to hold above this level, we might be in for a deeper correction. Technical analysis isn't gospel, but when a pattern has worked consistently for six years, it deserves serious attention.
Key levels every trader should be watching
The market has drawn some clear lines in the sand:
- 21,949: This is where the 100-week EMA currently sits – the make-or-break level for the medium-term trend
- 22,786: A key resistance level that bulls need to overcome to confirm a reversal
- Market catalysts: Keep an eye on economic data releases, Fed policy announcements, and geopolitical developments – these external factors could either reinforce or disrupt the technical setup
The Zoomed-Out View
Technical Indicators, when aligned with the 100-week EMA, give the best. The 100-week EMA is giving us a signal, considering traders will also factor in the broader economic landscape.
The coming weeks will be crucial. Will the bulls successfully defend this support and drive the index higher? Or will the bears overpower this rally and push the Nifty below this critical moving average?
For now, the 100-week EMA remains the level to watch. This Bounce could begin a fresh upward move if history is any guide. But markets can surprise us, so keep your stop-losses and your eyes on the charts.
Stay tuned for more updates as this situation develops. The battle between bulls and bears at this critical juncture will likely set the tone for the weeks ahead.


 Easy & quick
Leave A Comment?