 A bullish engulfing candlestick pattern is a bullish reversal pattern. Whereas, the bearish engulfing candlestick pattern is a bearish reversal pattern. I’m sure if you have already started to learn about candlesticks then this is something you have undoubtedly heard of. But, a person who is listening to these terms for the first time might think… what is a candlestick? what is a reversal? what is engulfing?
I know these terms might sound complex for you at the start. But, don’t worry I am here to simplify it for you with the help of a few real-life examples. Moreover, if you are a beginner and you find candlesticks a bit complex, still don’t worry because today I’m also going to tell you a secret formula. With the help of this secret formula, you won’t ever have to remember the names of the candles but you will easily be able to interpret the impact it will make. Sounds interesting, right?
So, let’s begin.
A bullish engulfing candlestick pattern is a bullish reversal pattern. Whereas, the bearish engulfing candlestick pattern is a bearish reversal pattern. I’m sure if you have already started to learn about candlesticks then this is something you have undoubtedly heard of. But, a person who is listening to these terms for the first time might think… what is a candlestick? what is a reversal? what is engulfing?
I know these terms might sound complex for you at the start. But, don’t worry I am here to simplify it for you with the help of a few real-life examples. Moreover, if you are a beginner and you find candlesticks a bit complex, still don’t worry because today I’m also going to tell you a secret formula. With the help of this secret formula, you won’t ever have to remember the names of the candles but you will easily be able to interpret the impact it will make. Sounds interesting, right?
So, let’s begin.
In this article:
- What is a candlestick?
- What is a reversal pattern?
- What is a bullish engulfing pattern?
- Example of a bullish engulfing pattern
- What is a bearish engulfing pattern?
- Example of a bearish engulfing pattern
- The concept of candlestick addition
What is a Candlestick?
Just as we have a line chart, area chart, bar chart, a candlestick is also a type of chart. But, this chart has some special qualities and that’s the reason it is preferred by most traders. So the special quality of a candlestick is that it displays the open, high, low and close prices of a stock. It is named candlestick because it resembles to a real candle with a wick. So, a candlestick consists of two major things.- The body of the candle
- The wick of the candle
But again you might wonder, what is a reversal pattern?
A reversal pattern indicates that a particular trend is coming to an end. When a reversal pattern appears during an uptrend, it indicates that there is a bearish reversal and vice-versa. Today we are going to discuss two types of reversal patterns.- A bullish engulfing pattern
- A bearish engulfing pattern
Bullish Engulfing Pattern
First, let’s discuss a bullish engulfing pattern. Take a look at the pair of candlesticks below and try to understand what it represents?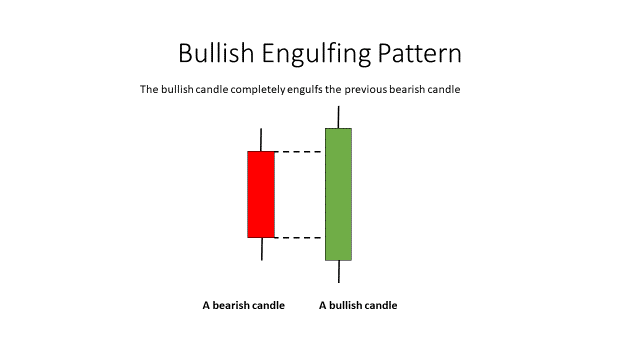 Here the first candle is a bearish candle. The second candle is a bullish candle. But did you notice? The second candle covers the first candle. This is a perfect example of a bullish engulfing candle. This pattern is formed in a downtrend. The first candle is always a bearish (red) candle. On the next day a bullish candle (green candle) is formed which entirely engulfs the first candle.
Such a formation indicates that the bulls have taken over the bears and the trend will possibly turn bullish.
But, should you buy a stock as soon as you see a bullish engulfing pattern?
The answer is a big no.
Even in the previous article on candlestick charts, we had mentioned that you must never place a trade until you get a confirmation.
So now the question arises, in a bullish engulfing pattern, when do you get a confirmation?
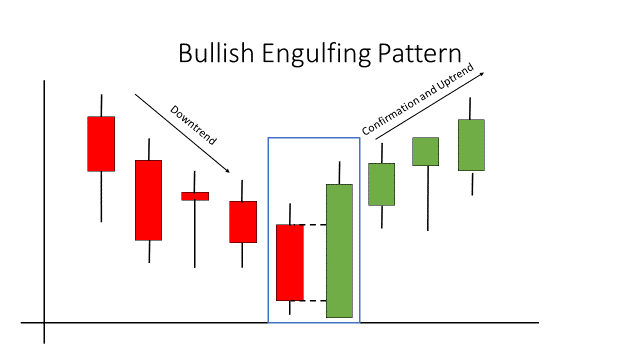
If in the next two to three days, the stock trades about the big bullish candle then we can say that there has been a reversal.
This is what the chart would look like.
Here the first candle is a bearish candle. The second candle is a bullish candle. But did you notice? The second candle covers the first candle. This is a perfect example of a bullish engulfing candle. This pattern is formed in a downtrend. The first candle is always a bearish (red) candle. On the next day a bullish candle (green candle) is formed which entirely engulfs the first candle.
Such a formation indicates that the bulls have taken over the bears and the trend will possibly turn bullish.
But, should you buy a stock as soon as you see a bullish engulfing pattern?
The answer is a big no.
Even in the previous article on candlestick charts, we had mentioned that you must never place a trade until you get a confirmation.
So now the question arises, in a bullish engulfing pattern, when do you get a confirmation?
If in the next two to three days, the stock trades about the big bullish candle then we can say that there has been a reversal.
This is what the chart would look like.
 If you notice in the above image I have drawn a dotted line above and below the body of the bearish candle and not the wick? So, if the bullish candle is not able to cover the wick of the bearish candle? Will we still call it a bullish engulfing pattern?
In a perfect world, the bullish candle should cover the wick. But, if we take a look at the majority of the charts where engulfing patterns are formed, the conclusion we get is that engulfing the wick is not that important. If the body of the candle is engulfed, it is a valid bullish engulfing pattern.
So, in the real world, the bullish engulfing pattern would be similar to this.
If you notice in the above image I have drawn a dotted line above and below the body of the bearish candle and not the wick? So, if the bullish candle is not able to cover the wick of the bearish candle? Will we still call it a bullish engulfing pattern?
In a perfect world, the bullish candle should cover the wick. But, if we take a look at the majority of the charts where engulfing patterns are formed, the conclusion we get is that engulfing the wick is not that important. If the body of the candle is engulfed, it is a valid bullish engulfing pattern.
So, in the real world, the bullish engulfing pattern would be similar to this.
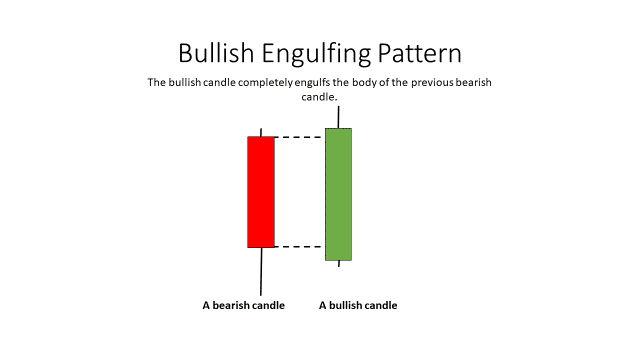 Here, the wick of the bearish candle is not entirely engulfed by the bullish candle but still, we would classify this as a bullish engulfing pattern.
Now, there are few variations in the bullish engulfing pattern. Sometimes, you might also come across a situation where one candle engulfs two or more previous candles. This is also a type of bullish engulfing pattern.
Take a look at the illustration below.
Here, the wick of the bearish candle is not entirely engulfed by the bullish candle but still, we would classify this as a bullish engulfing pattern.
Now, there are few variations in the bullish engulfing pattern. Sometimes, you might also come across a situation where one candle engulfs two or more previous candles. This is also a type of bullish engulfing pattern.
Take a look at the illustration below.
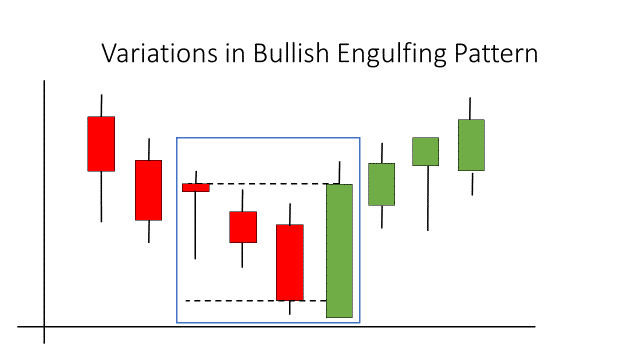
Variation one:
In the above image, the green bullish candle completely engulfs the body of the previous three candles.
Variation two:
Opposite to the previous illustration, here one bearish candle is engulfed by following three bullish candles. This is another type of bullish engulfing pattern.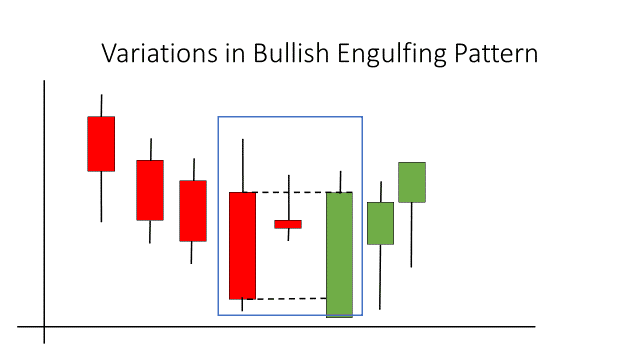
Variation three:
In this image, a small bearish candle is there in the middle of a big bearish and big bullish candle. The small bearish candle doesn’t matter if it appears in the middle of the body of the previous bearish candle. If the bullish candle is able to engulf the body of the bearish candles formed, it is a valid bullish engulfing pattern.Interpretation of a Bullish Engulfing Candle
To form an engulfing pattern there has to be a prior ongoing trend. In this case, the trend should be a downtrend. The price of the share keeps moving down until we see a bullish candle (green candle) which engulfs the previous bearish candle (red candle). The bullish engulfing candle is formed when the share opens lower than the previous trading session and closes higher than the previous close. So, before a bullish engulfing pattern is formed, the traders anticipate that the price of a share is going to fall and they sell the shares. With low buying pressure, we see a formation of multiple bearish candles. When the share is close to the support levels, traders feel that the share is undervalued and is the right opportunity to buy. With high buying pressure, the share price bounces back which engulfs the previous candle. So, the bullish engulfing pattern indicates that the market participants are no longer in favour of the bearish trend and the bulls are back in full power.Real-life Examples of Bullish Engulfing Pattern.
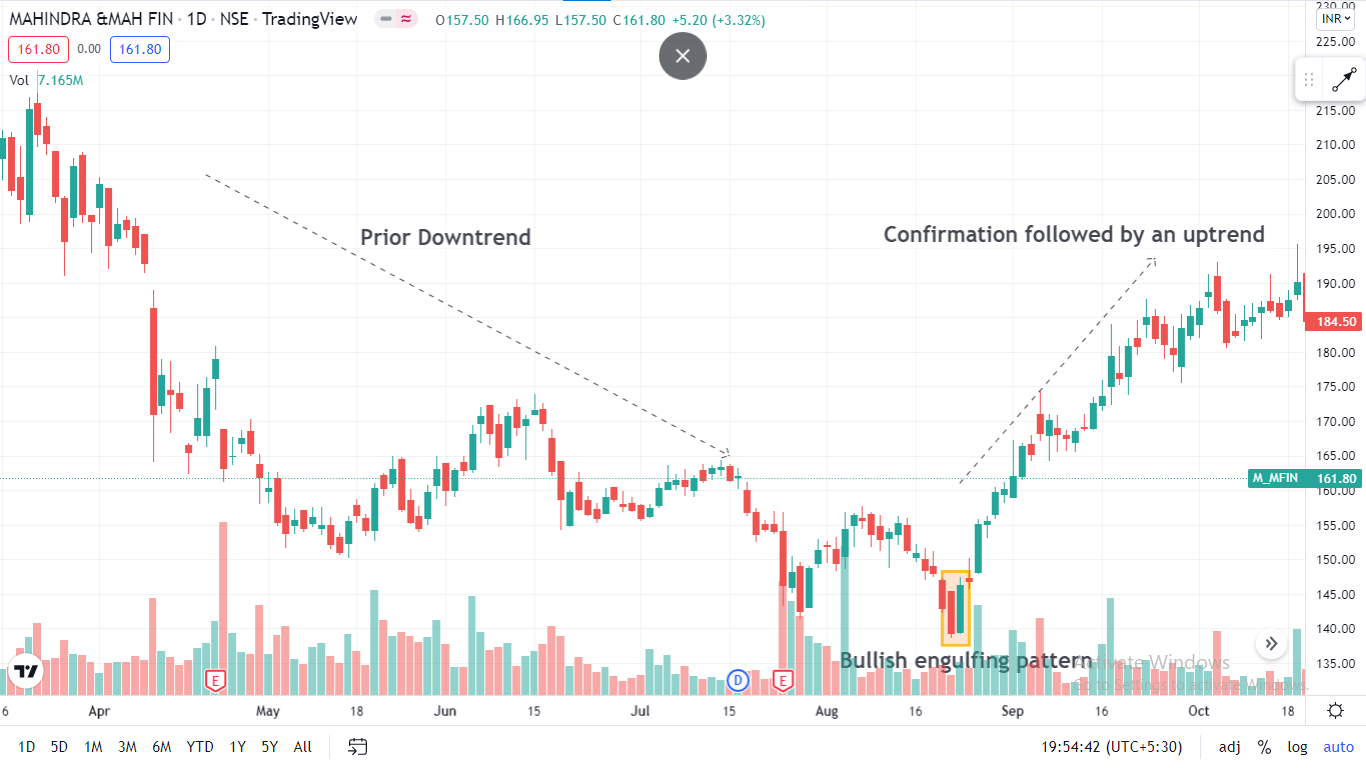
Bullish engulfing pattern formed in Mahindra and Mahindra Financial Services Ltd
The stock was in a downtrend from 15th February 2021 to 20th August 2021. The candle formed on 21st August 2021 with an open of Rs. 139.55 and a close of Rs. 145.45 was engulfed by a bullish candle on 22nd August 2021 with an open of Rs. 146.40 and a close of Rs. 139.45. The stock was trading above the engulfing pattern for the next two to three days which was a confirmation that there has been a reversal. Since then the stock has been in an up move of 48.98%.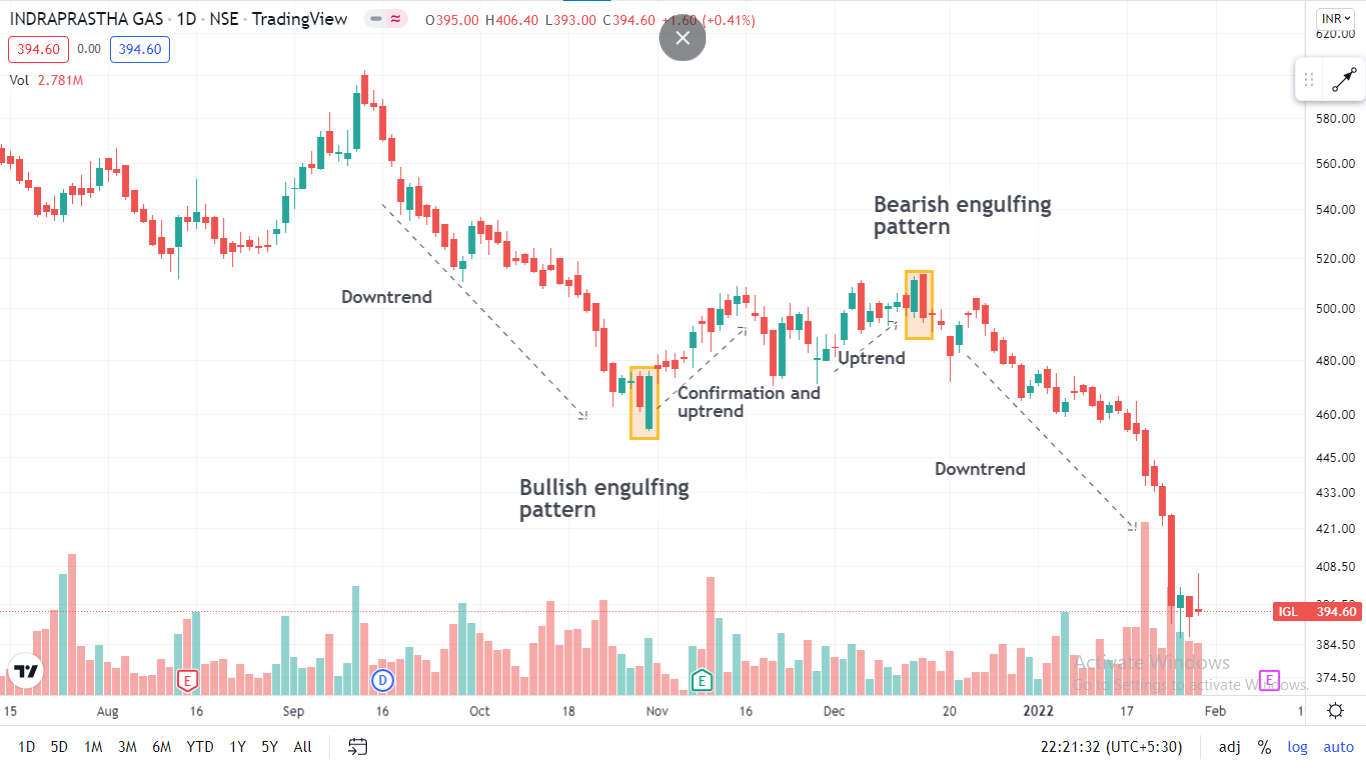 The stock was in a downtrend from Rs. 601.95 to Rs. 462.95. On 28th October 2021, we saw a bearish candle which was engulfed by a bullish candle on 29th October 2021. Later, we saw a reversal in the stock which lasted for a short span.
In the above chart we have also found an example of a bearish engulfing pattern. Let’s now explore a bit about it too.
The stock was in a downtrend from Rs. 601.95 to Rs. 462.95. On 28th October 2021, we saw a bearish candle which was engulfed by a bullish candle on 29th October 2021. Later, we saw a reversal in the stock which lasted for a short span.
In the above chart we have also found an example of a bearish engulfing pattern. Let’s now explore a bit about it too.
Bearish Engulfing Pattern
Here is how a bearish engulfing pattern would look like.
A bearish engulfing pattern is the complete opposite of a bullish engulfing pattern. It appears in an uptrend. Here, a bearish candlestick engulfs a bullish candlestick which indicates that there is going to be a bearish reversal post-confirmation.
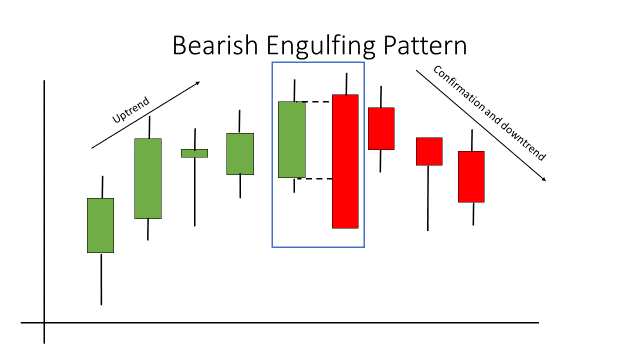 This is a perfect example of how a bearish engulfing pattern would look like with the help of two candles. But, as there are a few variations in the bullish engulfing pattern, let’s take a look at a few variations in a bearish reversal pattern too.
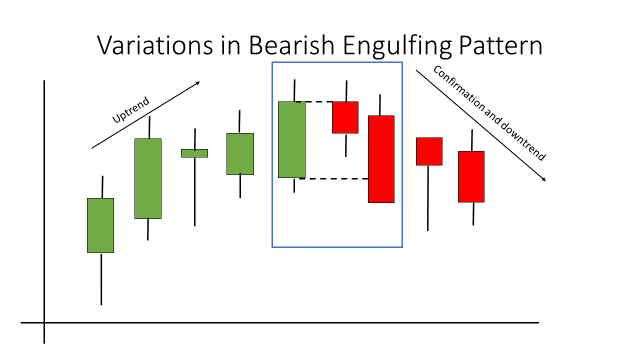
Variation one:
Here the bullish candle is engulfed by two bearish candles. This indicates that the bulls are no longer strong and the bears have taken over the trend.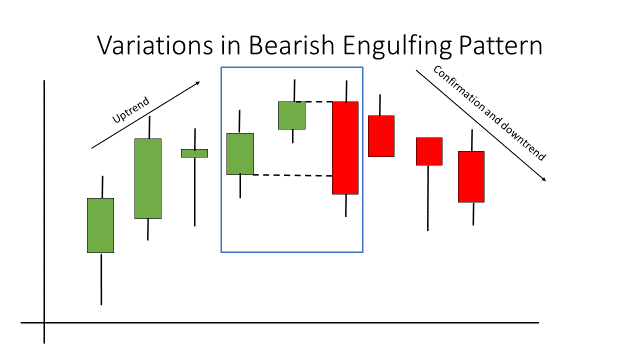
Variation two:
This is a powerful formation of a bearish engulfing pattern. Here, a big bearish candle has completely engulfed the bodies of two bullish candles. And since then we have seen a reversal.Interpretation of a Bearish Engulfing Candle
A bearish engulfing pattern is formed in a prior bullish trend. The share price keeps moving up until we see a big bearish candle which engulfs the previous bullish candles. This happens when the sellers overpower the buyers which drags the prices down. It proves that the bears have dominated the stock. For a bearish engulfing pattern to form the stock opens much higher than the previous close. It may also be a gap up opening. And the close of the bearish candle should be above the open of the bullish candle. So, prior to the formation of the bearish engulfing pattern, the traders anticipate the prices to be in an up move. When the share price is close to the resistance level, the majority of traders book profits. With less buying pressure and high selling pressure, the bears dominate the stock prices and push it further down to form the bearish engulfing pattern.Real Life Example of a Bearish Engulfing Pattern
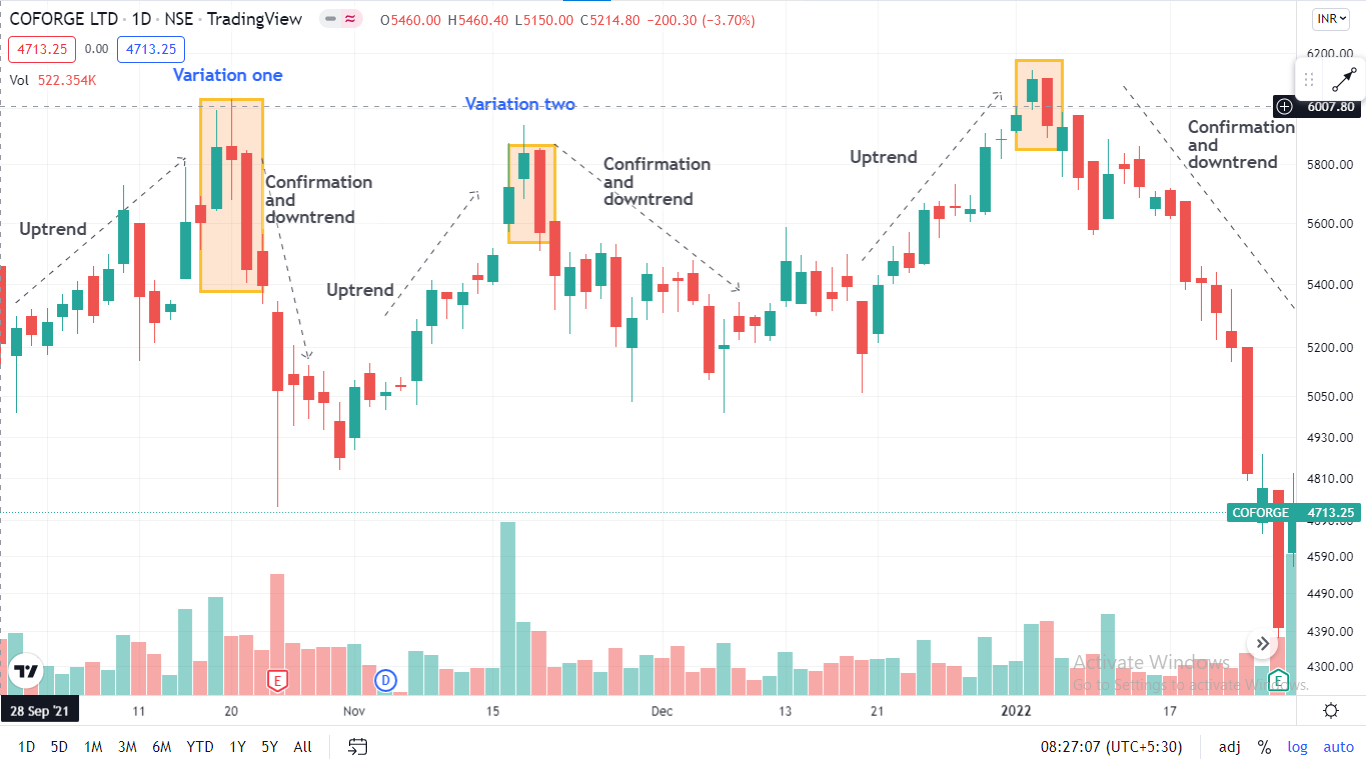 Coforge Ltd is moving in a channel with a resistance of Rs. 6, 257.40 and a support of Rs. 4, 645.55. We have spotted all the variations of bearish engulfing patterns in the chart. To begin with, the stock was in an uptrend from 29th September 2021 to 19th October 2021. As soon as the stock was close to its resistance level, we saw a reversal with the formation of a bearish engulfing pattern. This pattern is the exact replica of variation one of bearish engulfing patterns we had discussed earlier. Since then we have seen a decent correction in the stock.
From Rs. 4,838.85 we again saw a good uptrend in the stock which rallied from Rs. 4,840 to Rs. 5,936.65. The stock was close to its resistance level and we saw the formation of variation two of the bearish engulfing pattern. Here, two bullish candles were completely engulfed by one bearish candle.
Again the stock was in an uptrend from Rs. 5,072.75 to Rs. 6,147.30. Again a bearish engulfing pattern was formed and we saw a huge downtrend of 28.72%.
Now, as I had promised in the beginning of the article, I will tell you a secret tip through which you don’t have to remember the names of the candles ever again. Well, that concept is called candlestick addition.
Coforge Ltd is moving in a channel with a resistance of Rs. 6, 257.40 and a support of Rs. 4, 645.55. We have spotted all the variations of bearish engulfing patterns in the chart. To begin with, the stock was in an uptrend from 29th September 2021 to 19th October 2021. As soon as the stock was close to its resistance level, we saw a reversal with the formation of a bearish engulfing pattern. This pattern is the exact replica of variation one of bearish engulfing patterns we had discussed earlier. Since then we have seen a decent correction in the stock.
From Rs. 4,838.85 we again saw a good uptrend in the stock which rallied from Rs. 4,840 to Rs. 5,936.65. The stock was close to its resistance level and we saw the formation of variation two of the bearish engulfing pattern. Here, two bullish candles were completely engulfed by one bearish candle.
Again the stock was in an uptrend from Rs. 5,072.75 to Rs. 6,147.30. Again a bearish engulfing pattern was formed and we saw a huge downtrend of 28.72%.
Now, as I had promised in the beginning of the article, I will tell you a secret tip through which you don’t have to remember the names of the candles ever again. Well, that concept is called candlestick addition.
The Concept of Candlestick Addition
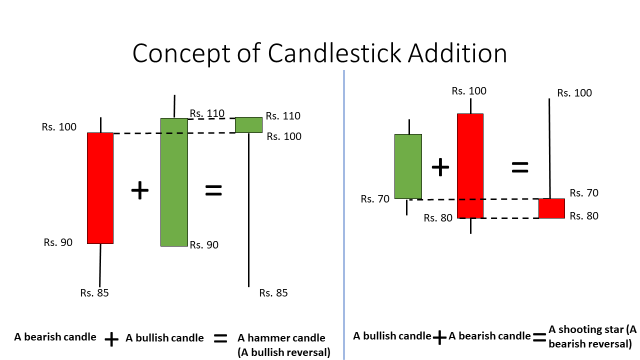 So, the concept of candlestick addition is very easy. You have to merge two candles to find the resulting candle. The resulting candle is usually a basic type of candlestick which will help you analyse the next market move.
In the image above, let’s start with the concept of bullish engulfing (image one). On the first day the stock opened at Rs. 100 and the second candle closed at Rs. 110. If we merge both the candles, we get a resulting candle which is a hammer candle.
As we all know, a hammer candle indicates a bullish reversal pattern.
Let’s move to the second image. It is a bearish engulfing pattern. If we merge both the candles, we get a resulting candle which is a shooting star candle. A shooting star candle indicates a bearish reversal.
So, if you understand the concept of candlestick addition then understanding and interpreting complex candlestick patterns will be much easier for you.
Recommended watch: How to use bullish and bearish engulfing patterns to make money in the stock markets.
To understand the concept of candlestick addition better watch the video.
So, the concept of candlestick addition is very easy. You have to merge two candles to find the resulting candle. The resulting candle is usually a basic type of candlestick which will help you analyse the next market move.
In the image above, let’s start with the concept of bullish engulfing (image one). On the first day the stock opened at Rs. 100 and the second candle closed at Rs. 110. If we merge both the candles, we get a resulting candle which is a hammer candle.
As we all know, a hammer candle indicates a bullish reversal pattern.
Let’s move to the second image. It is a bearish engulfing pattern. If we merge both the candles, we get a resulting candle which is a shooting star candle. A shooting star candle indicates a bearish reversal.
So, if you understand the concept of candlestick addition then understanding and interpreting complex candlestick patterns will be much easier for you.
Recommended watch: How to use bullish and bearish engulfing patterns to make money in the stock markets.
To understand the concept of candlestick addition better watch the video.


 Easy & quick
Leave A Comment?