

In the world of technical analysis, few tools command as much respect as Fibonacci retracement. Derived from a centuries-old mathematical sequence, it remains one of the most effective methods for identifying potential support and resistance levels in trading. Whether you’re analyzing equities, commodities, or currencies, Fibonacci retracement helps traders anticipate price pullbacks within a prevailing trend — often revealing zones where momentum could shift.
At its core, Fibonacci retracement is not about prediction but probability. It provides traders a roadmap of where prices may pause or reverse during a correction phase, making it a critical trading tool for both short-term and positional analysis.
What is Fibonacci Retracement?
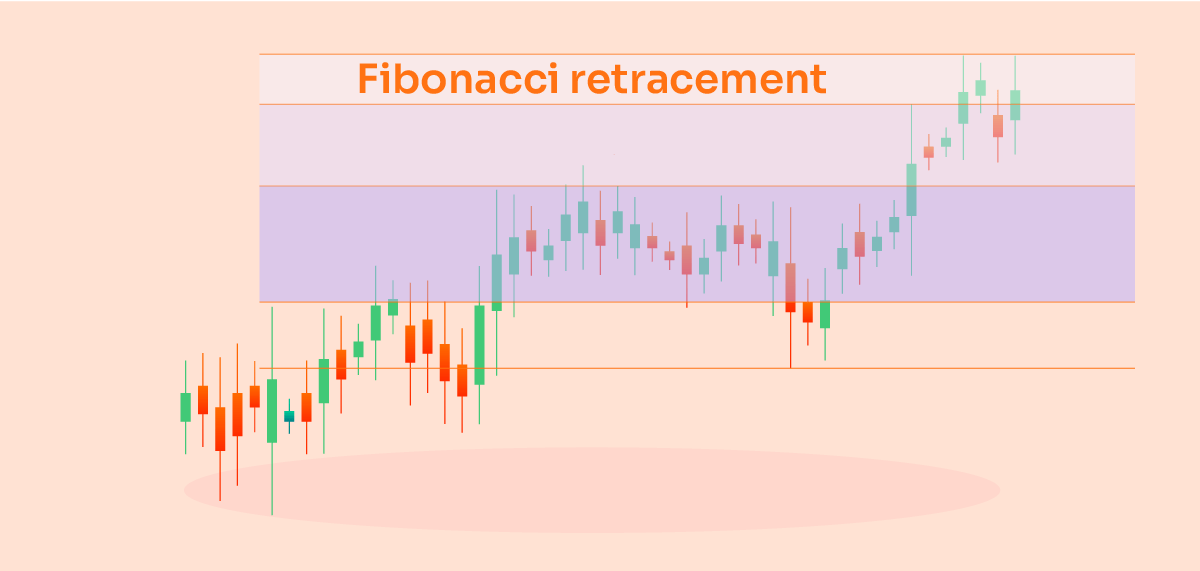
Fibonacci retracement is a technical analysis method that plots horizontal lines across a chart to indicate potential levels where price could retrace before resuming its trend. These levels are derived from specific Fibonacci ratios — 23.6%, 38.2%, 50%, 61.8%, and 78.6% — calculated between a swing high and a swing low.
For example, in an uptrend, retracement levels are drawn from the lowest point of a move to the highest. Each line marks a potential support zone, suggesting where buyers might step in again. Conversely, in a downtrend, retracement levels drawn from high to low indicate potential resistance areas where selling pressure could re-emerge.
Traders rely on these retracement zones to plan entries, set targets, and manage risk, making them an integral part of price analysis.
Understanding the Fibonacci Sequence and Golden Ratio
The concept originates from the Fibonacci sequence — a mathematical pattern where each number is the sum of the two preceding numbers: 0, 1, 1, 2, 3, 5, 8, 13, and so on. As the sequence progresses, the ratio between successive numbers approaches 1.618, known as the golden ratio.
This golden ratio, and its reciprocal 0.618, forms the foundation of Fibonacci retracement levels. Ratios such as 0.382 (38.2%) and 0.236 (23.6%) are derived from mathematical relationships within the sequence. Interestingly, while 50% isn’t technically a Fibonacci ratio, it’s widely included because markets often retrace half of a prior move before continuing in the dominant direction.
The golden ratio’s presence in nature — from seashell spirals to human anatomy — adds a philosophical allure, but in trading, it represents something practical: the rhythm of crowd psychology during market corrections.
How to Plot Fibonacci Retracement Levels
Applying Fibonacci retracement on a chart is straightforward, but accuracy depends on selecting the right swing points.
Step 1: Identify a clear trend and mark the most recent swing high and swing low.
Step 2: Use the Fibonacci retracement tool available on most charting platforms.
- For an uptrend: draw from the swing low to the swing high.
- For a downtrend: draw from the swing high to the swing low.
Step 3: Observe the retracement lines that appear at 23.6%, 38.2%, 50%, 61.8%, and 78.6%.
Each level acts as a potential support or resistance zone. Shallow pullbacks to the 23.6% or 38.2% level indicate strong momentum, while deeper retracements near 61.8% often suggest a more significant correction.
Accuracy in choosing swing points is crucial. Many traders make the mistake of drawing Fibonacci levels on minor fluctuations, leading to misleading interpretations. The tool works best when applied to clearly visible swings on higher timeframes such as daily or weekly charts.
How to Use Fibonacci Retracement in Trading
Fibonacci retracement works best in trending markets, where traders look for pullbacks to enter positions in the direction of the larger trend.
- In an uptrend, traders watch for price to pull back to a key Fibonacci level (say 38.2% or 61.8%) before resuming its rise. Entering near these zones can offer favorable risk–reward setups.
- In a downtrend, retracement levels act as potential resistance points where rallies may fade.
Stop-loss orders are often placed slightly beyond the next retracement level to limit downside risk. Many traders also use Fibonacci retracement to define profit targets, expecting the price to react as it approaches these levels.
However, Fibonacci levels should not be used in isolation. Combining them with trendlines, moving averages, or candlestick patterns provides stronger confirmation. For example, if a bullish engulfing candle appears at the 61.8% retracement, it signals that buyers may be reclaiming control.
In sideways markets, where price lacks direction, Fibonacci retracement becomes less reliable since frequent whipsaws can produce false signals.
Common Mistakes and Limitations
Like any technical tool, Fibonacci retracement has its drawbacks.
- Subjective swing selection: Traders often differ on which points to connect, leading to inconsistent results.
- False signals: Price can pierce a Fibonacci level before reversing, triggering premature entries.
- Over-reliance: Depending solely on Fibonacci without confirmation from other indicators can reduce its accuracy.
- Choppy conditions: In non-trending or volatile markets, retracement levels lose significance.
- Confusion between retracement and reversal: A retracement is a temporary pullback within a trend, whereas a reversal changes the trend itself. Misjudging the two can lead to early exits or wrong entries.
Understanding these limitations helps traders use Fibonacci as a guideline, not a guarantee.
Real-Life Examples
Consider Nifty 50 during a strong rally phase. Suppose the index rises from 19,000 to 20,000 and then begins to correct. When a Fibonacci retracement is plotted, the 61.8% level lies near 19,380. If the index stabilizes around this zone and forms a bullish candle, it often signals a trend continuation — a classic 61.8% bounce scenario.
In another case, say a stock like Tata Motors falls from ₹1,000 to ₹800 and rebounds toward ₹876 — the 38.2% retracement level. If the upmove stalls there, traders may interpret this as temporary resistance, preparing for another leg lower.
These examples illustrate how Fibonacci retracement serves as a reference framework for assessing pullbacks and potential inflection points.
Tips and Best Practices
- Always wait for confirmation before taking trades near retracement levels.
- Use multiple timeframes to check if Fibonacci levels align across charts.
- Avoid redrawing levels frequently; stick to prominent swings for reliability.
- Combine with momentum indicators like RSI or MACD for better validation.
Consistency in application is key — Fibonacci retracement rewards discipline more than prediction.
FAQs
What is the difference between Fibonacci retracement and extension?
Retracement identifies potential pullbacks within a trend, while extension projects future price targets beyond the current swing.
Why do Fibonacci levels vary across charts?
Differences in timeframe or chosen swing points can lead to slightly different retracement zones.
Does Fibonacci retracement always work?
No. It provides probable zones, not certainties. Always confirm with other technical signals.
How do I choose the right swing points?
Select visible highs and lows that mark significant turning points in the trend, ideally on higher timeframes.
Conclusion
Fibonacci retracement is one of the simplest yet most insightful technical analysis tools for understanding price behavior. By revealing areas where a trend might pause or reverse, it helps traders manage entries, exits, and risk with greater precision.
When used thoughtfully — alongside chart patterns and indicators — Fibonacci retracement transforms from a mathematical concept into a practical price analysis framework. For any trader seeking structure and objectivity in decision-making, it remains an indispensable guide to navigating the rhythm of the markets.


 Easy & quick
Leave A Comment?