 11 April 2025


 05 April 2025
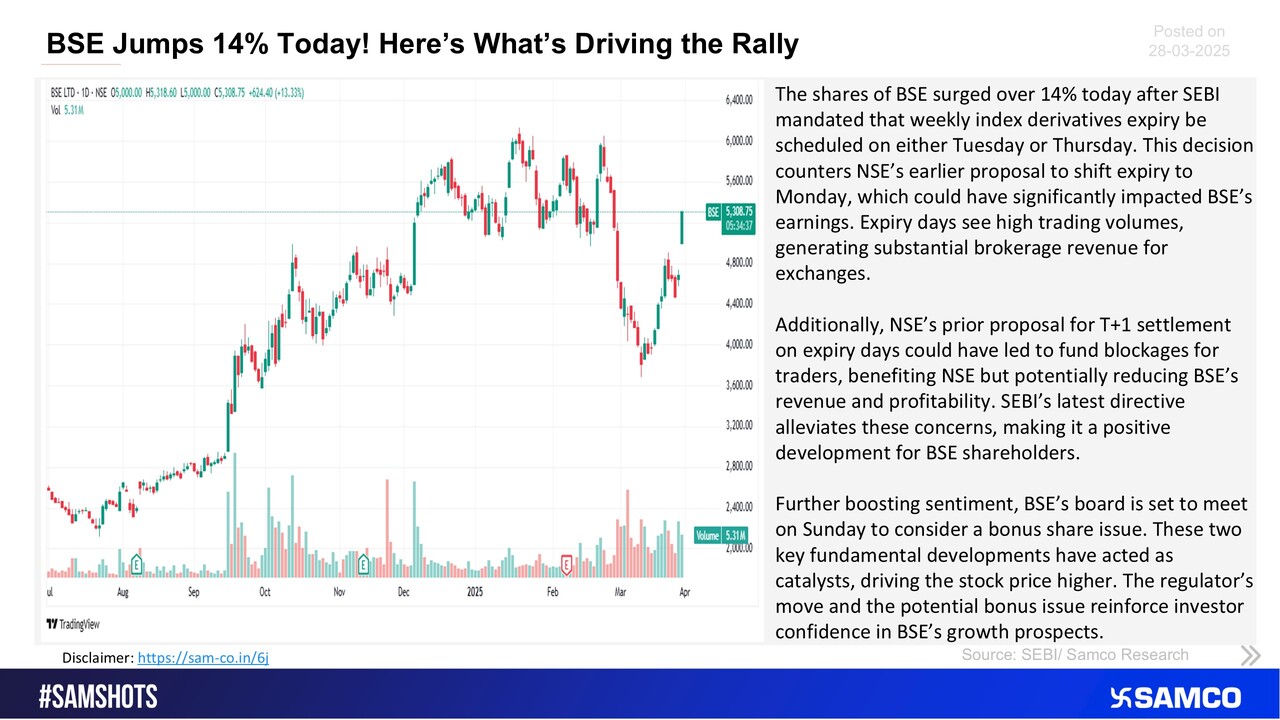
 28 March 2025
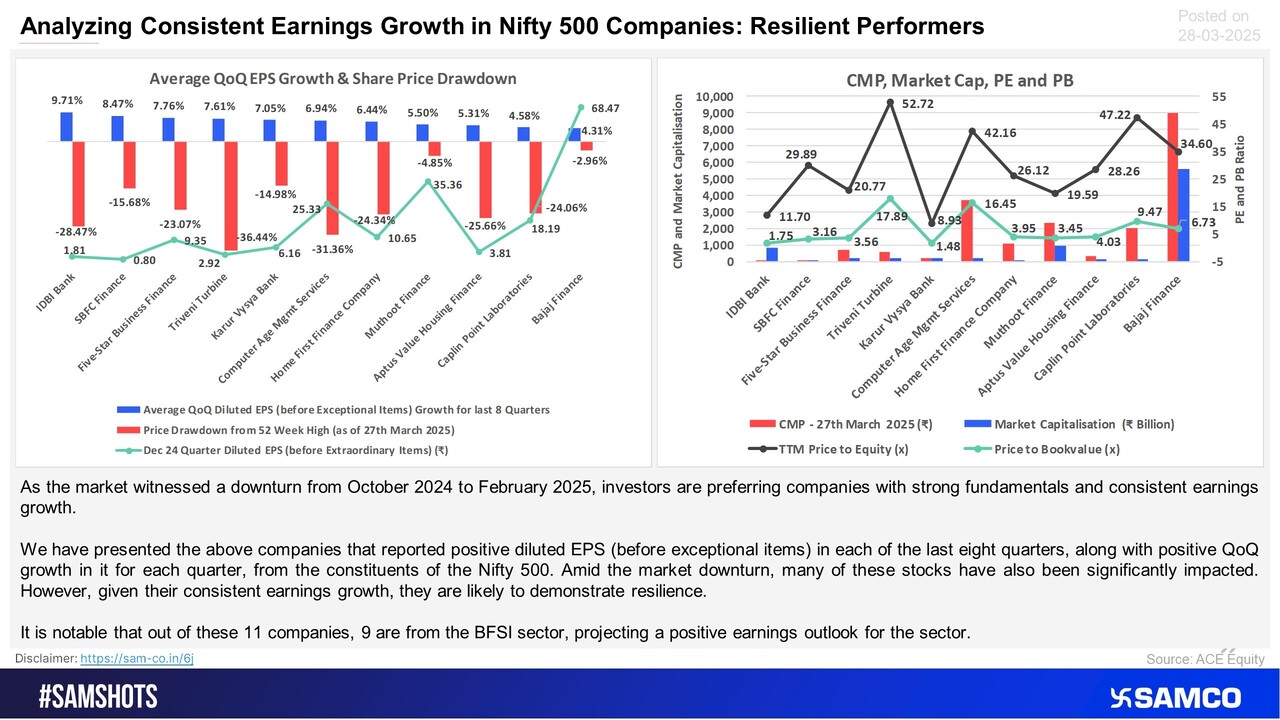
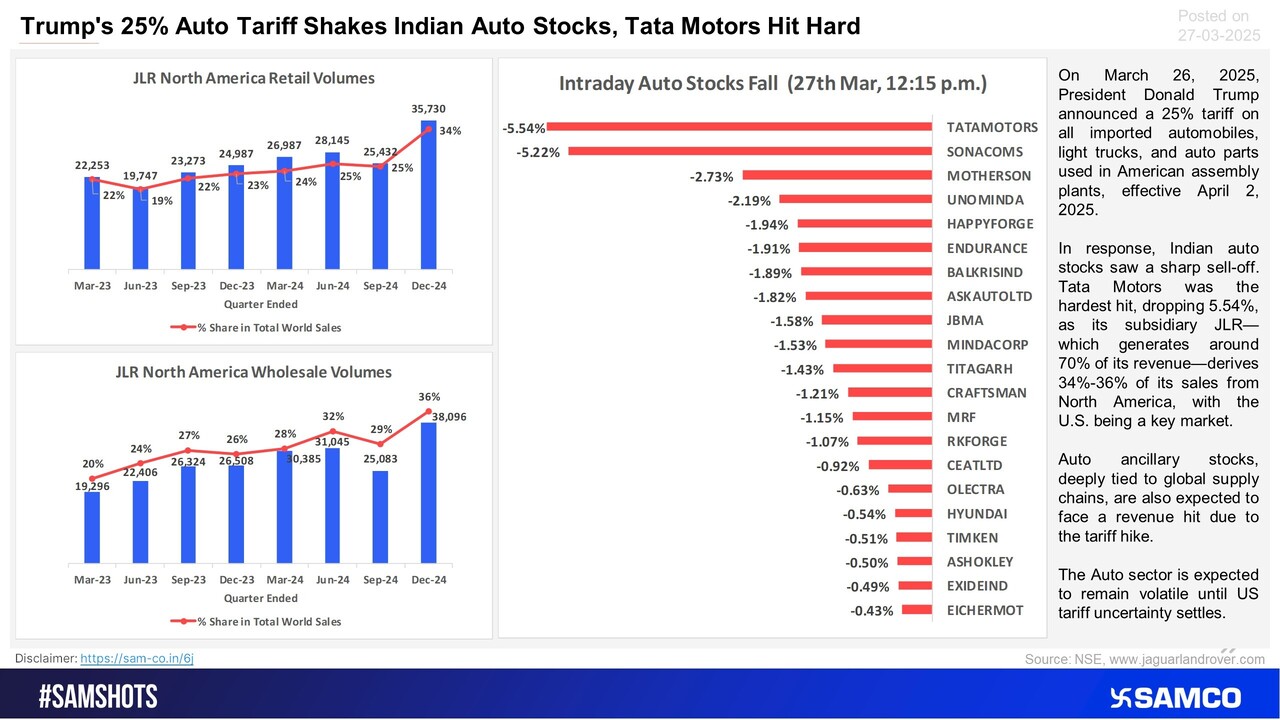
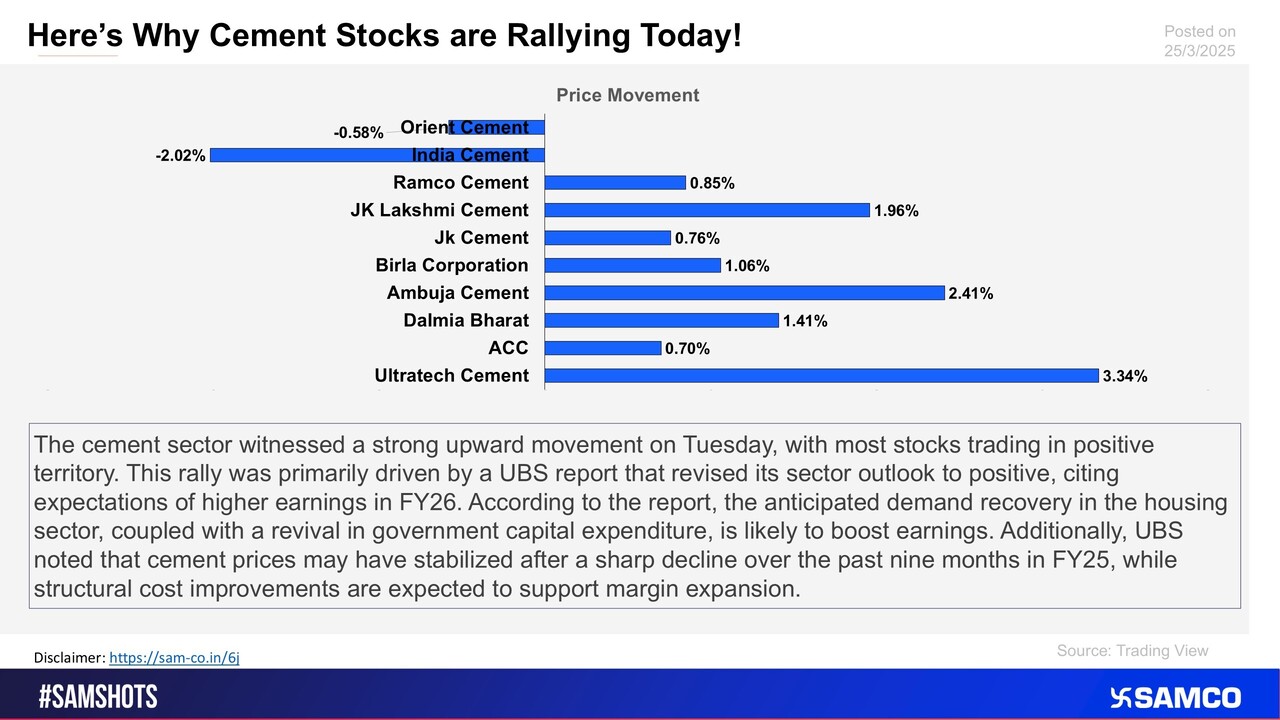
 21 March 2025
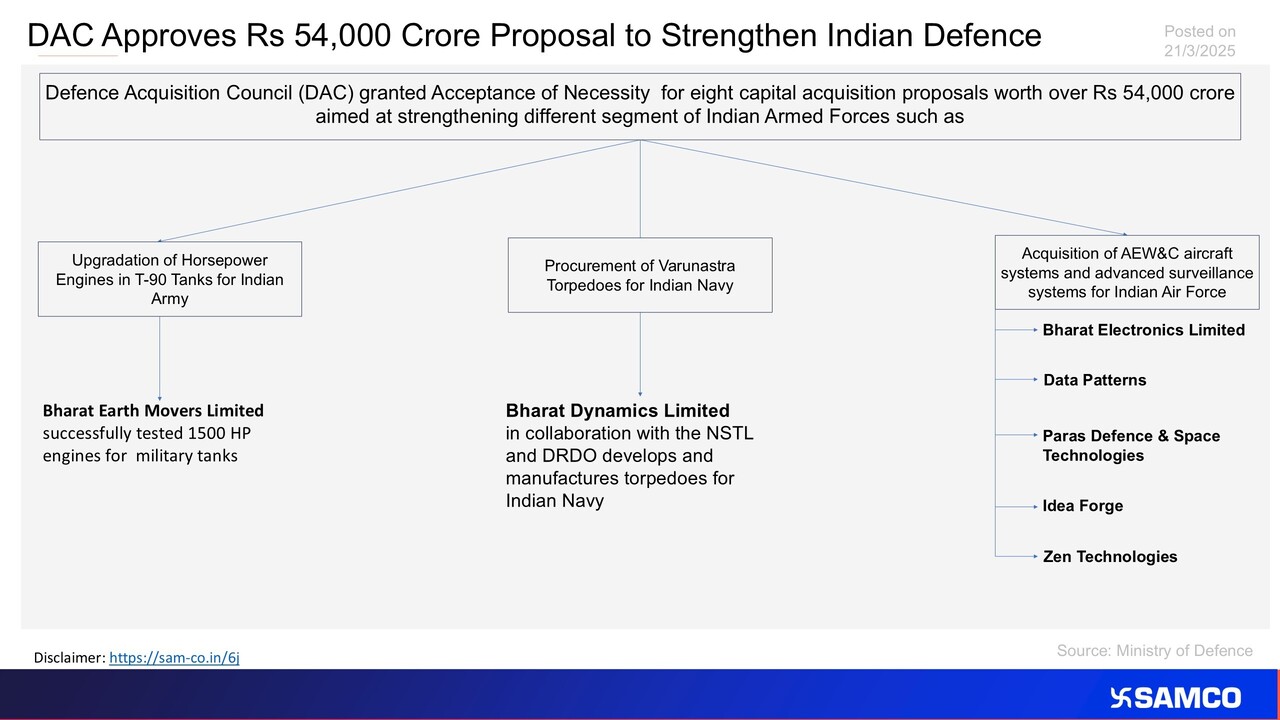

 13 March 2025


 07 March 2025


 28 February 2025
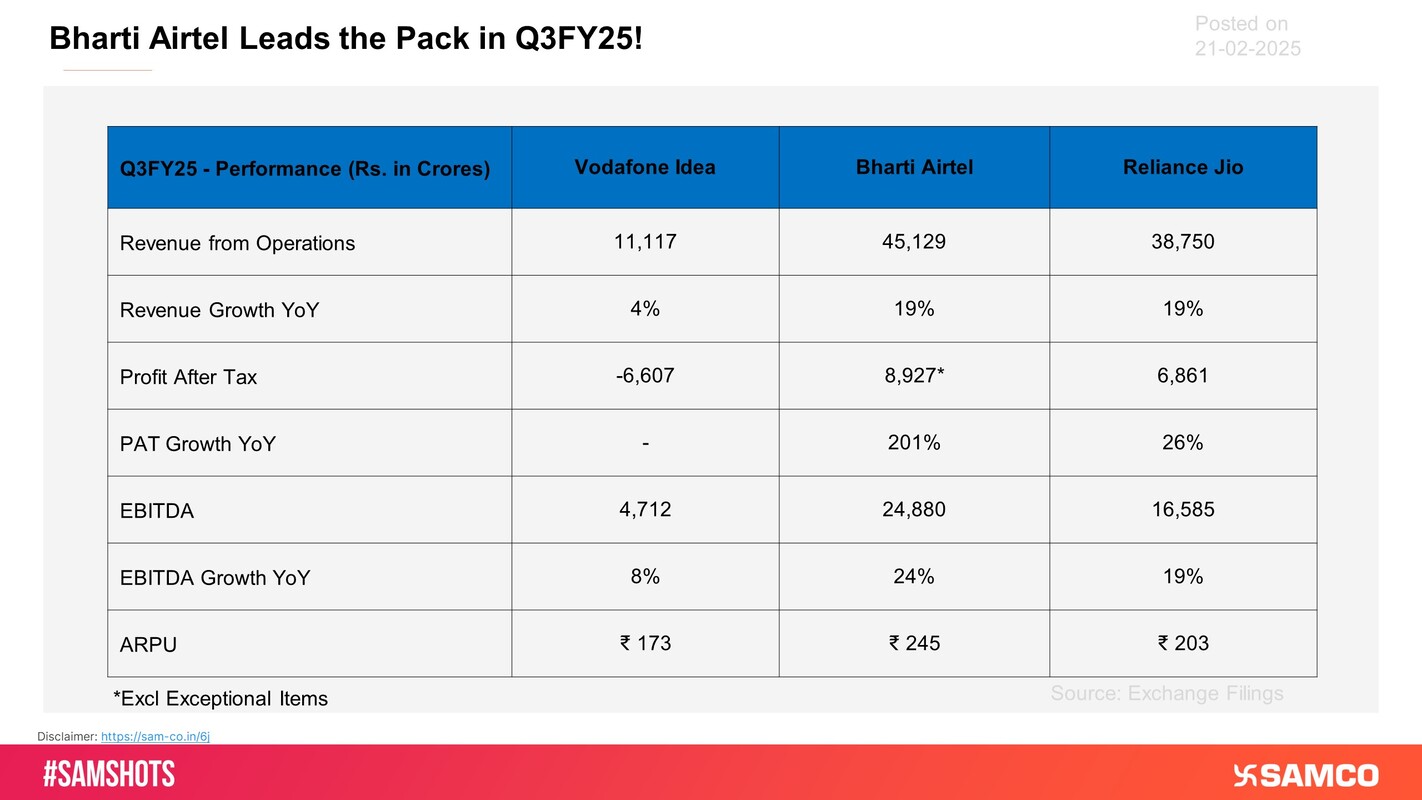
 21 February 2025
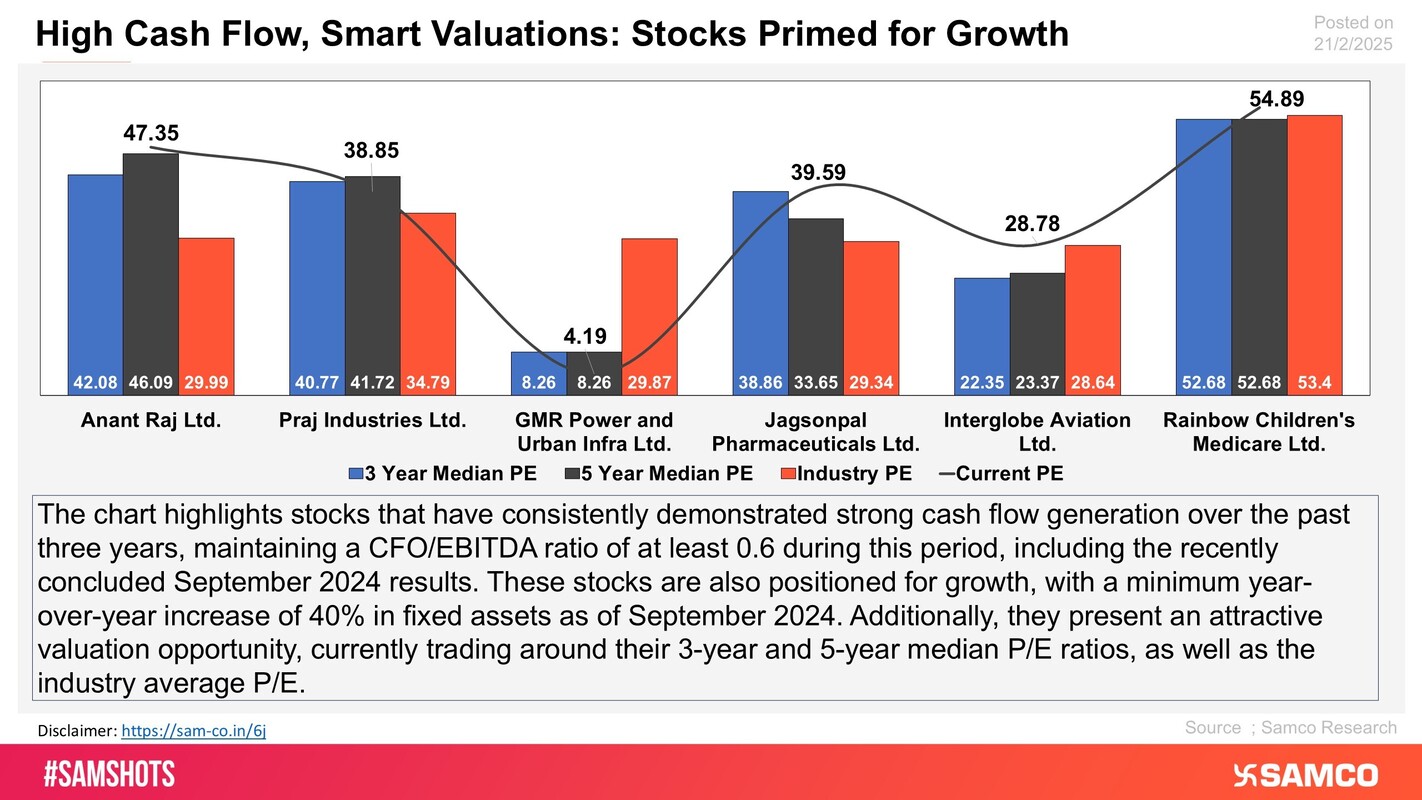


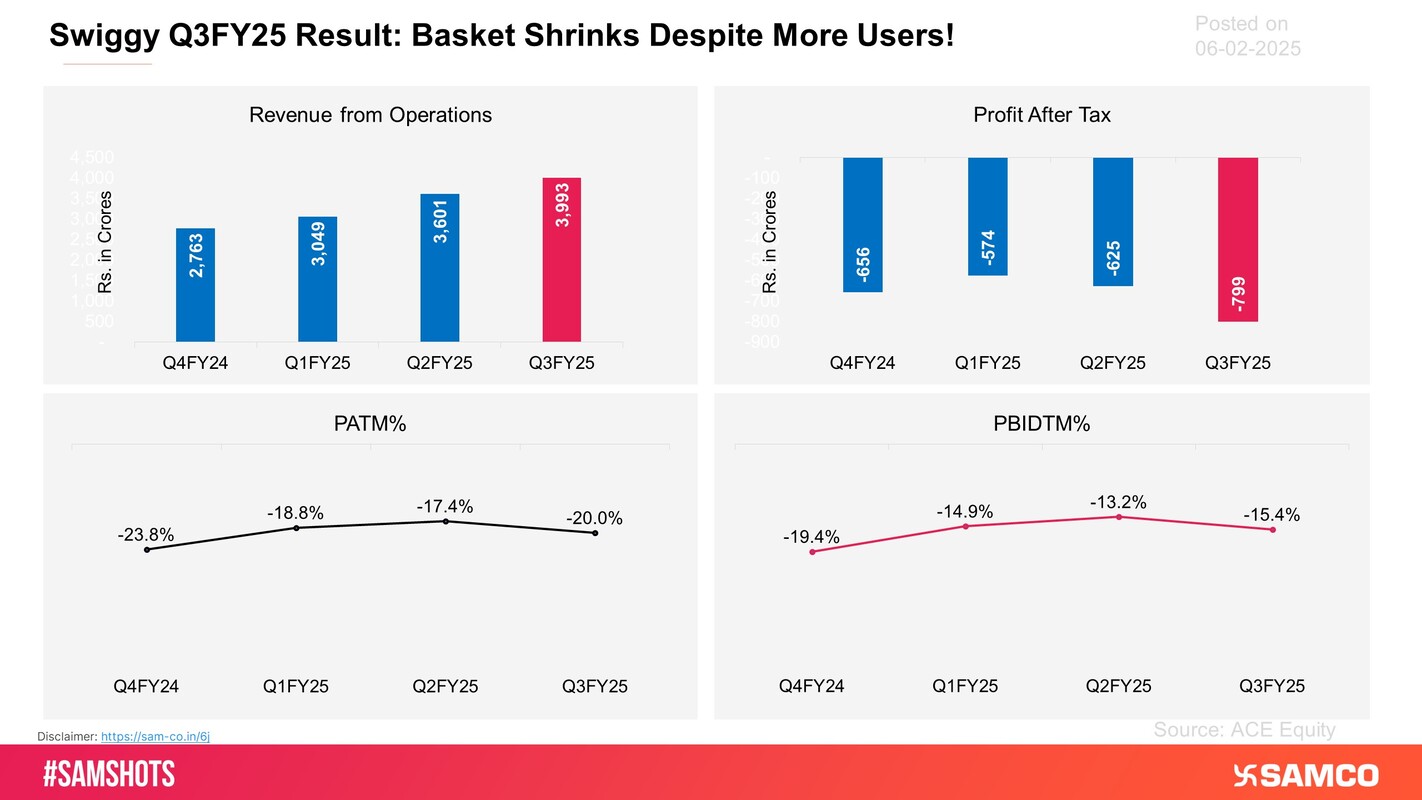
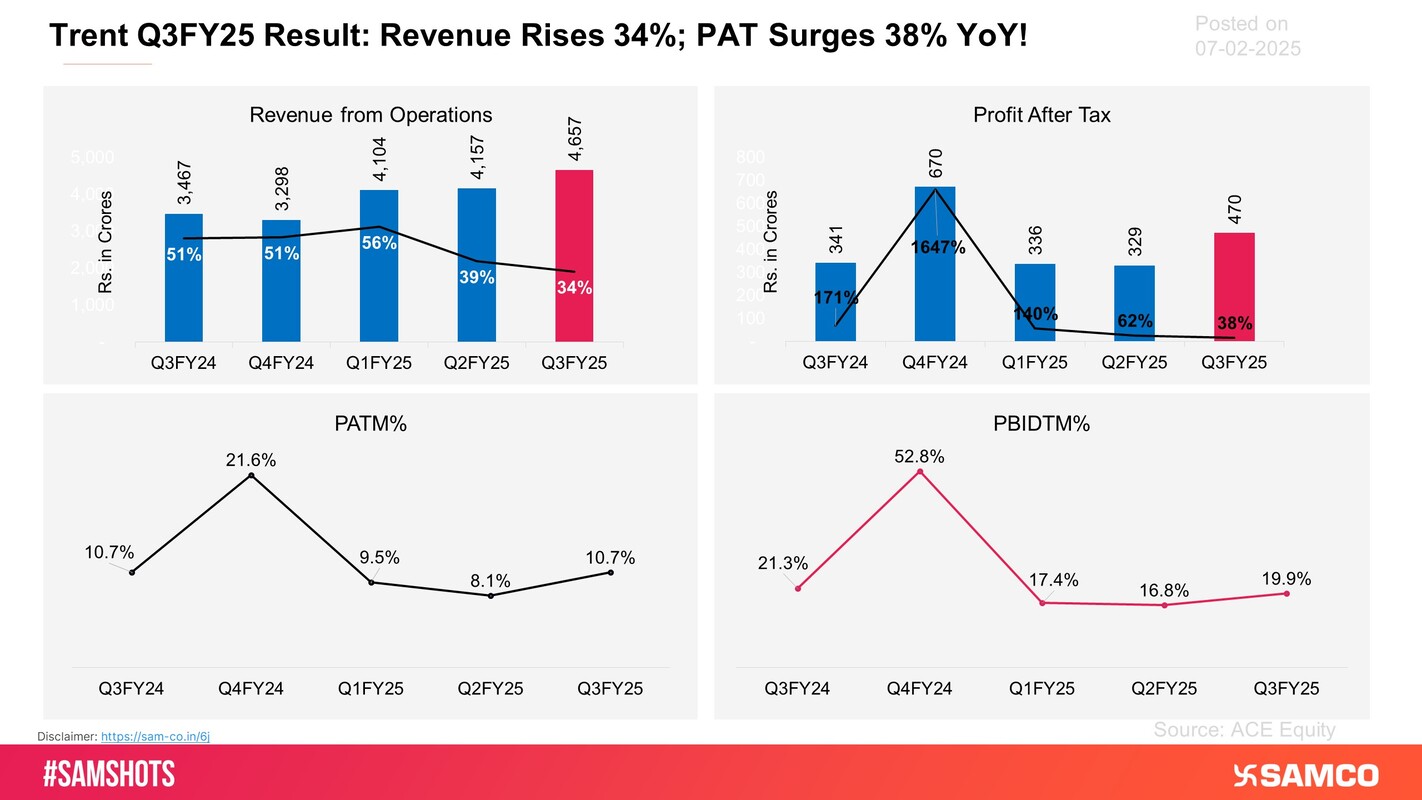
 07 February 2025
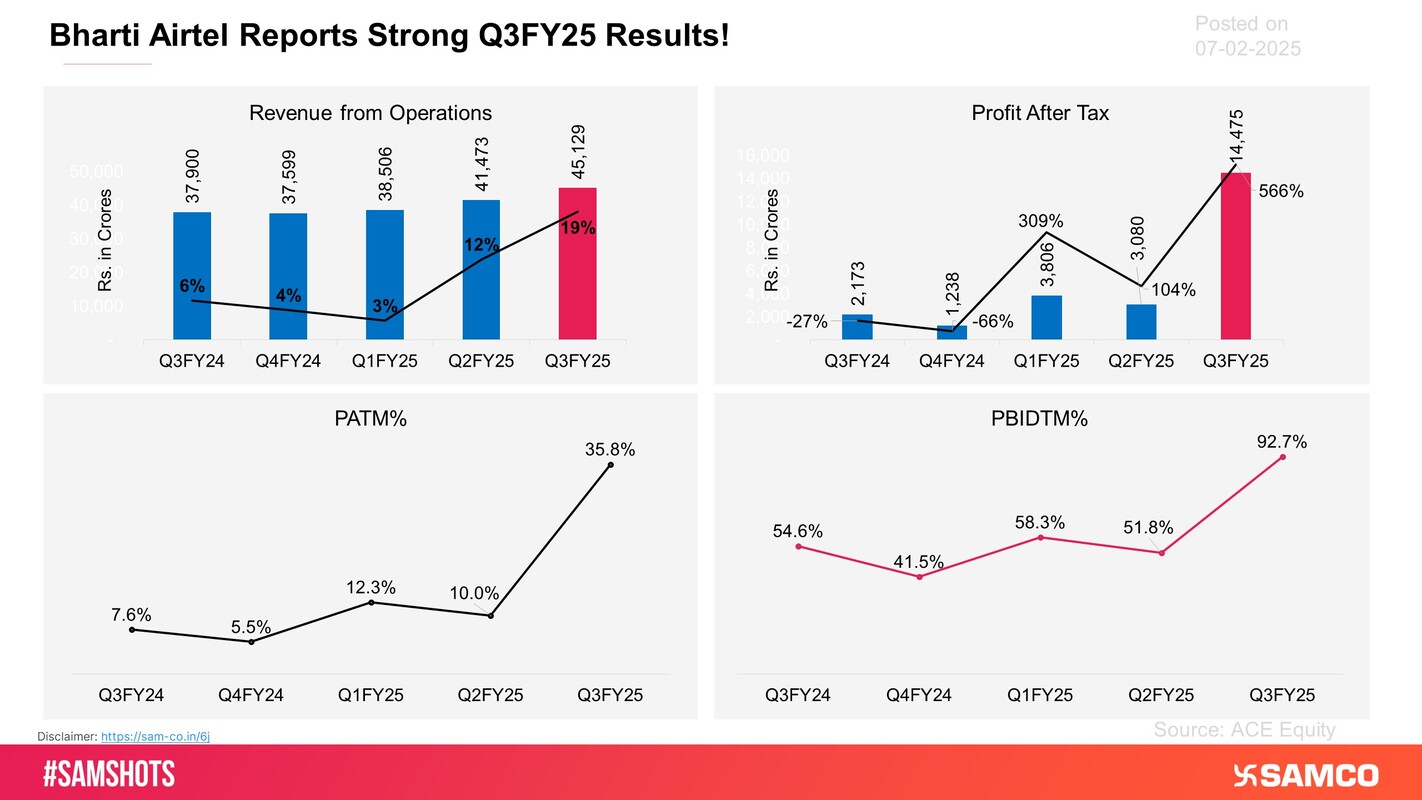
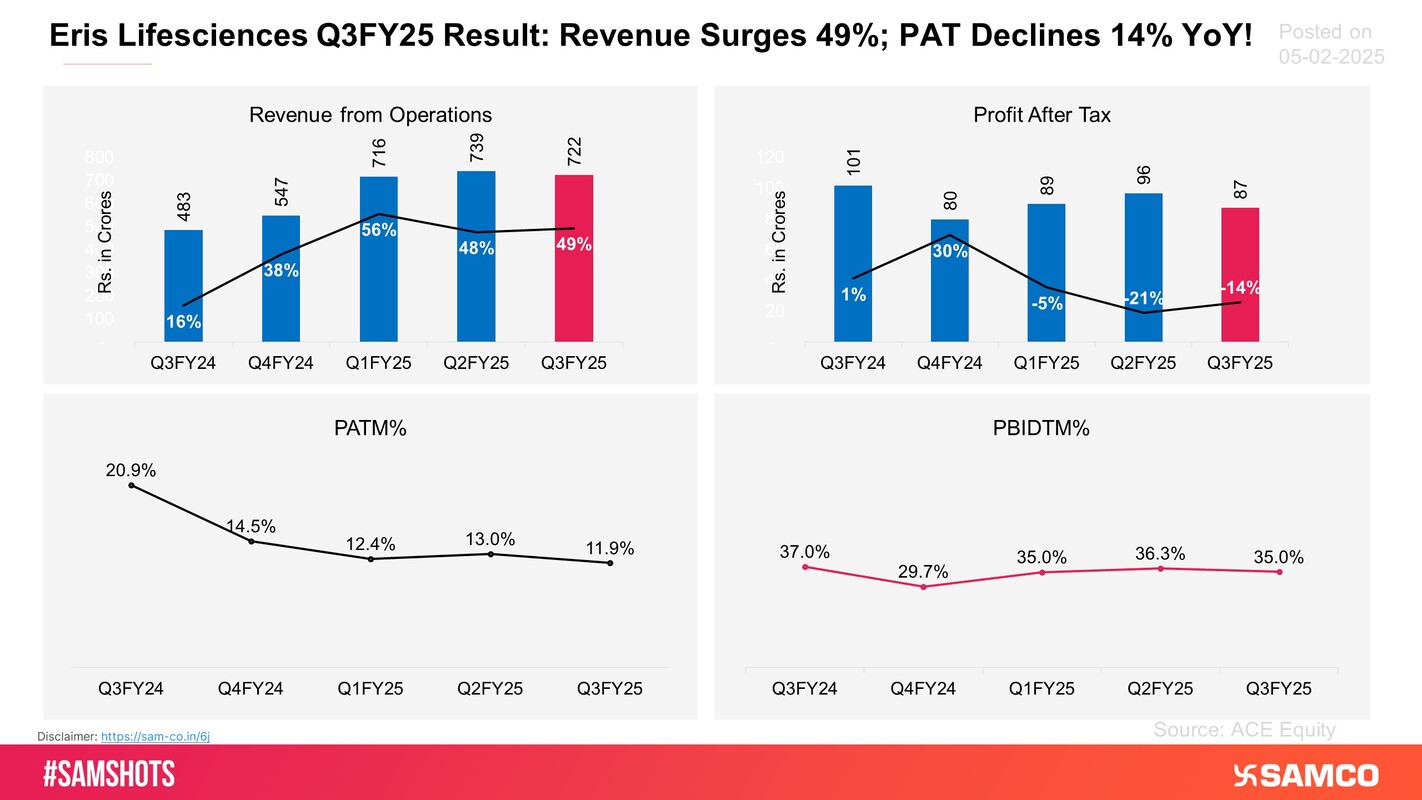
 01 February 2025
Disclaimer: https://sam-co.in/6j
 Easy & quick
1. Register on SCORES portal
2. Mandatory details for filling complaints on SCORES
Name | PAN | Address | Mobile | Number | E-mail ID
3. Benefits
Effective Communication
Speedy redressal of the grievances
