The market witnessed a series of notable events during the week leading to significant fluctuations. On Monday, the Nifty 50 touched a new high on the back of exit polls which indicated 350+ seats for BJP. However, markets slipped by 6% after a poor show by BJP in the election results
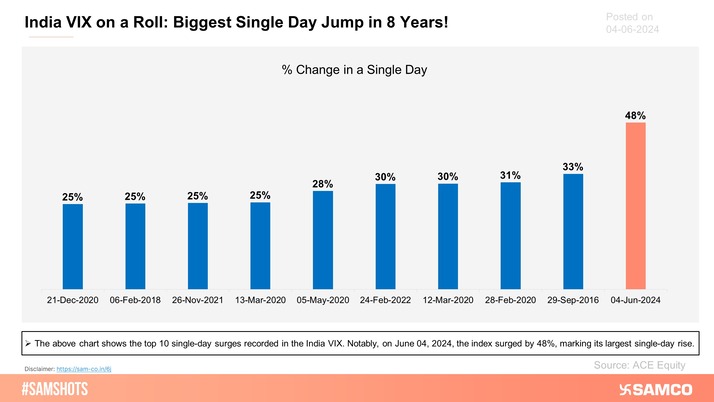
The India VIX surged by 48%, marking its largest single-day rise in 8 years. Defensive sectors such as Nifty IT and Nifty FMCG performed well, while Nifty PSE and Nifty PSU Banks saw declines during the week.
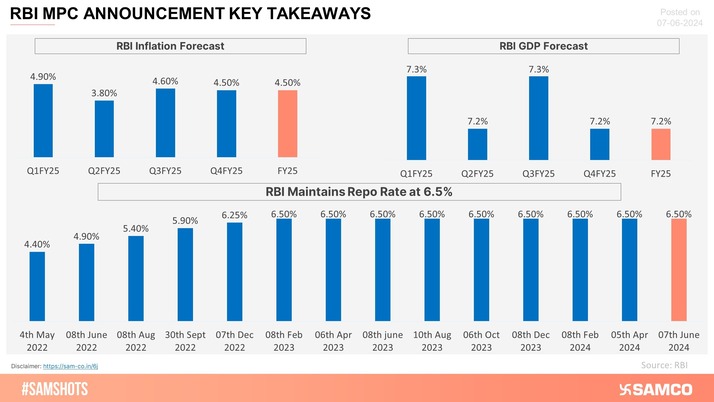
Remarkably, major sectoral indices along with the Nifty 50 recovered from the June 4th fall within just three days. The RBI, in its MPC meeting on Friday, kept the repo rate unchanged at 6.5% further fueling the rally. Despite the mid-week turbulence, major indices managed to recover, delivering positive weekly returns.
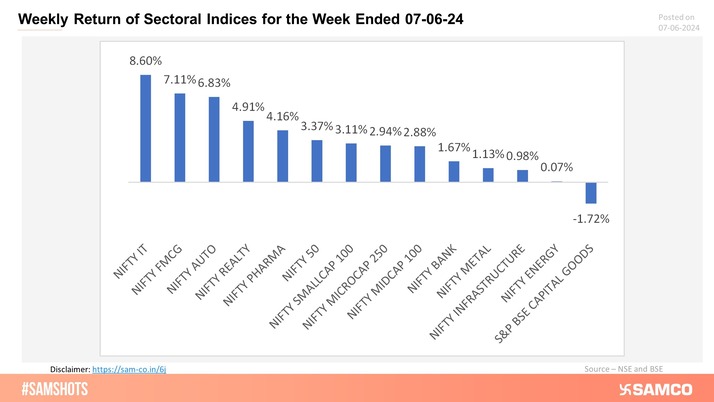
Nifty 50 ended the week 3.37% higher at 23,290. Nifty IT and Nifty FMCG surged the most with a gain of 8.60% and 7.11% respectively.
Scroll down to understand more of such market news and perspectives for the week gone by in easily understandable charts.
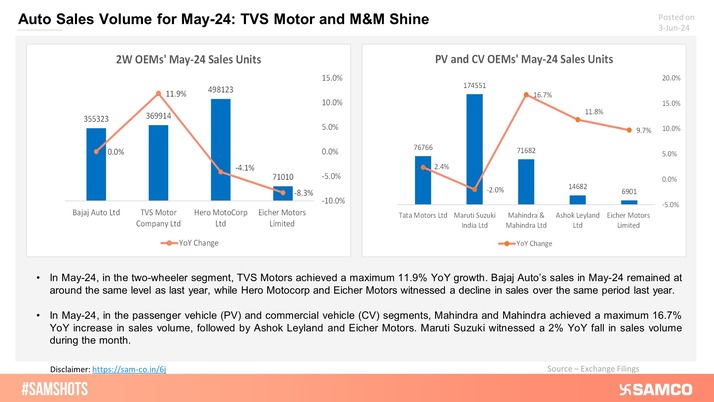
OEMs's auto sales volume numbers for May 24 reflect TVS Motor and M&M claiming the highest YoY growth in the 2W and PV-CV sales during the month, respectively.


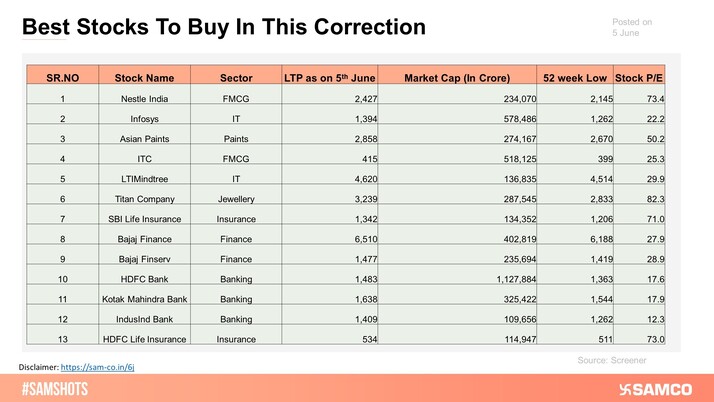
The chart below presents a list of stocks with a market capitalization exceeding Rs. 1 lakh crore, which are trading near their 52-week low as of June 5, 2024.
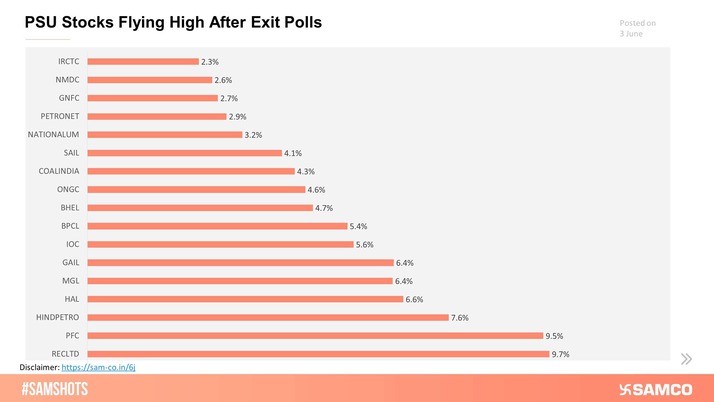
PSU Stocks led the rally from the front on June 03, 2024 as exit polls indicated a positive outcome for BJP.
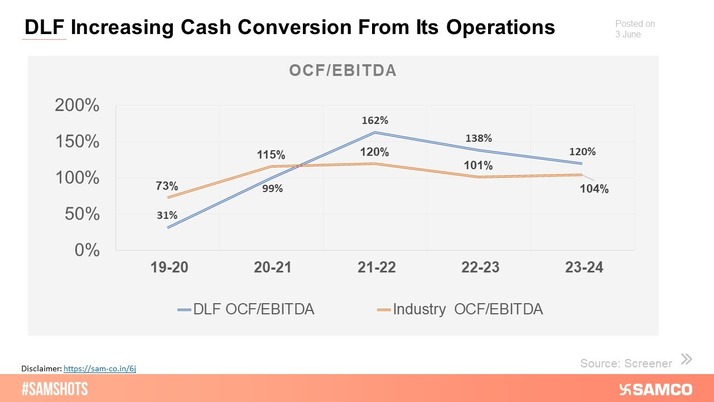
The below chart represents DLF's cash conversion capability compared to other industry players as of March 31, 2024.
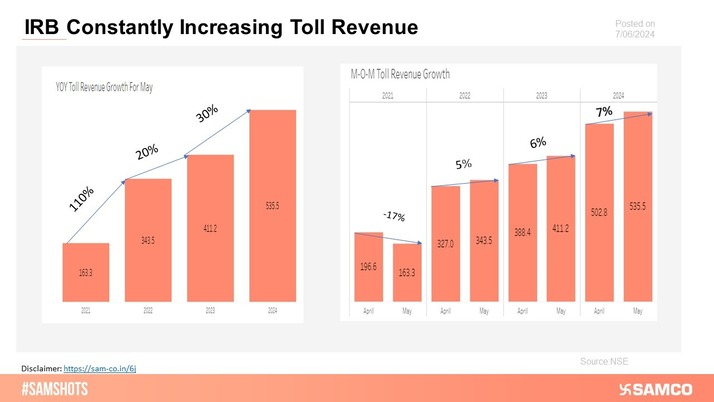
The below chart indicates the toll revenue growth of IRB Infrastructure for May 2024.
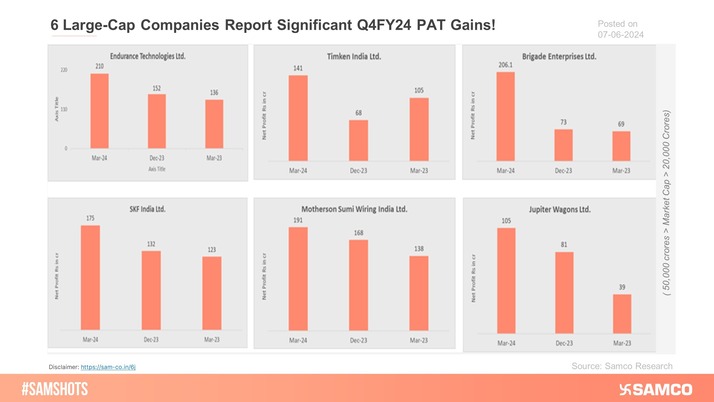
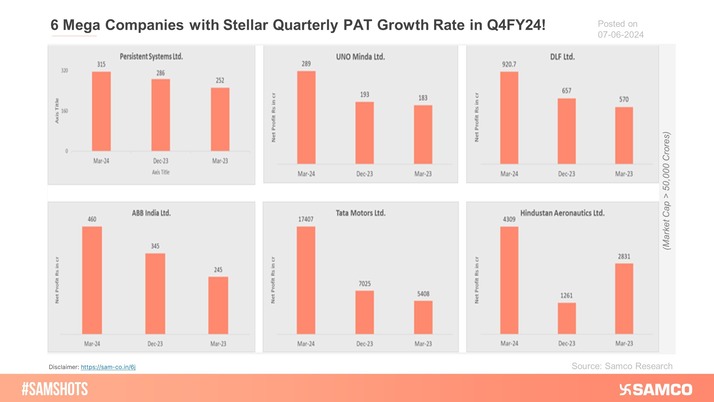
Here are the 6 large companies that have posted significant PAT growth.
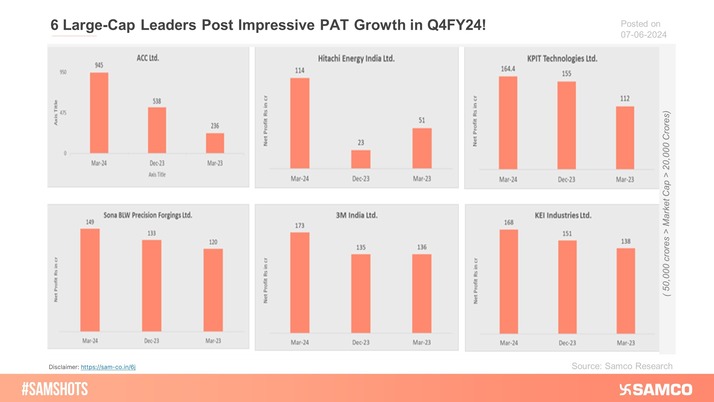
Below is the list of 6 large companies with stellar quarterly PAT growth in Q4FY24.
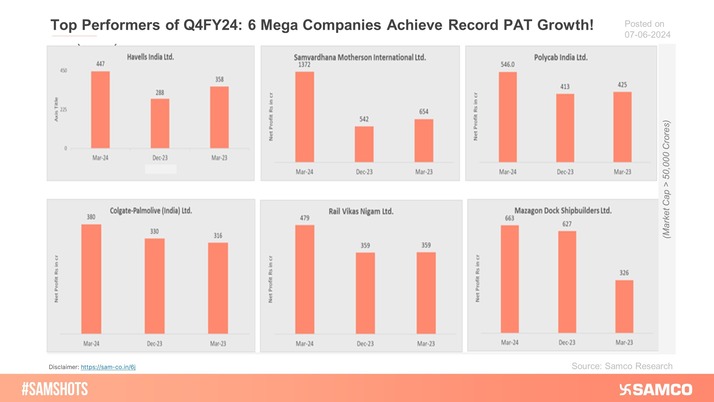
Here are the top performers of Q4FY24 of 6 mega-cap companies that achieved record PAT growth.
Here are the 6 mega-cap companies that have achieved stellar Q4FY24 PAT growth.
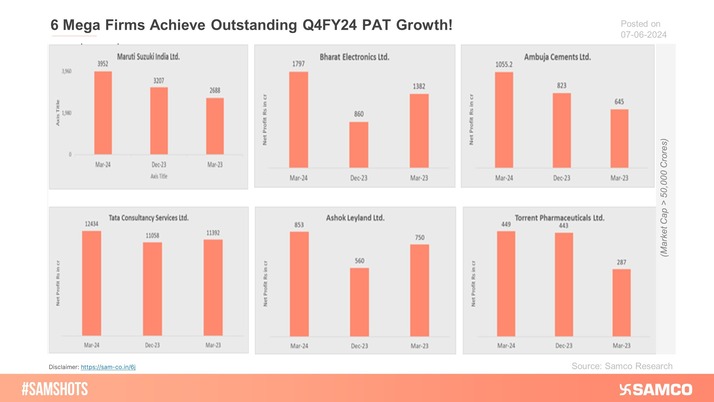
The below chart presents the 6 mega firms that achieved outstanding Q4FY24 PAT growth.
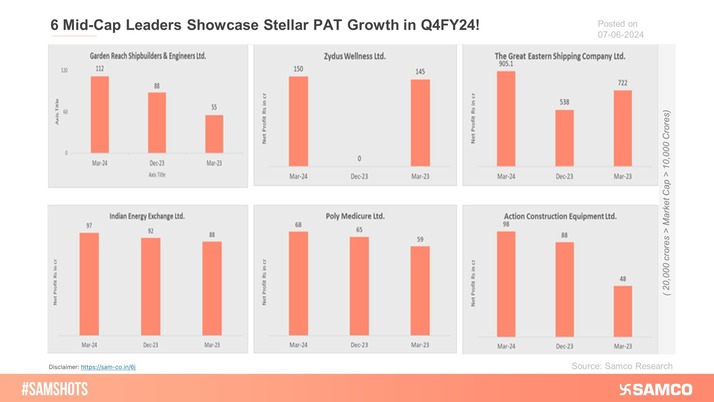
Here's the list of 6 mid-cap leaders that showcased stellar PAT growth in Q4FY24.
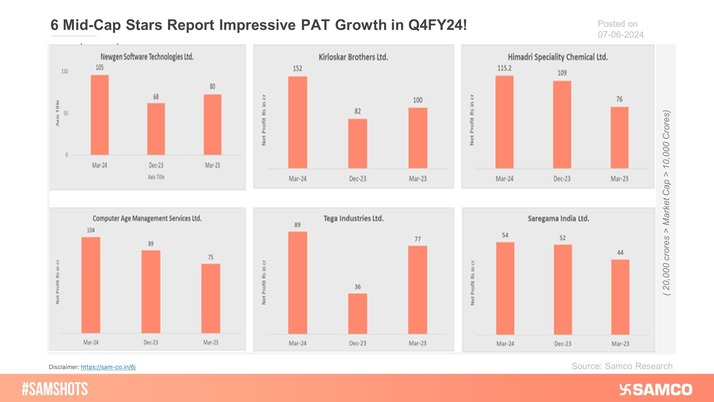
The accompanying chart represents the 6 mid-cap stars that report impressive PAT growth in Q4FY24.
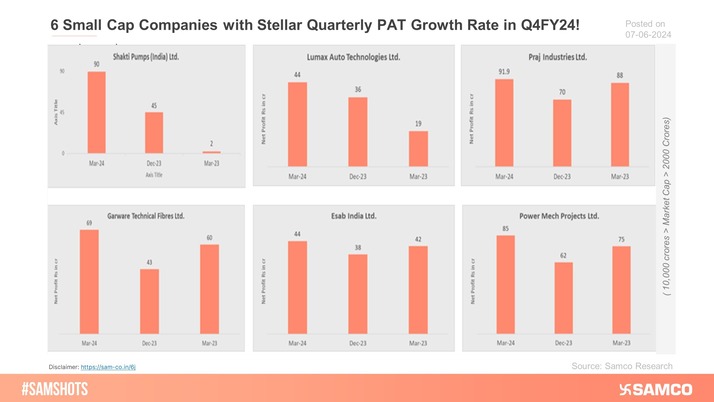
Below is the list of 6 small-cap companies that have reported stellar PAT growth in Q4FY24.
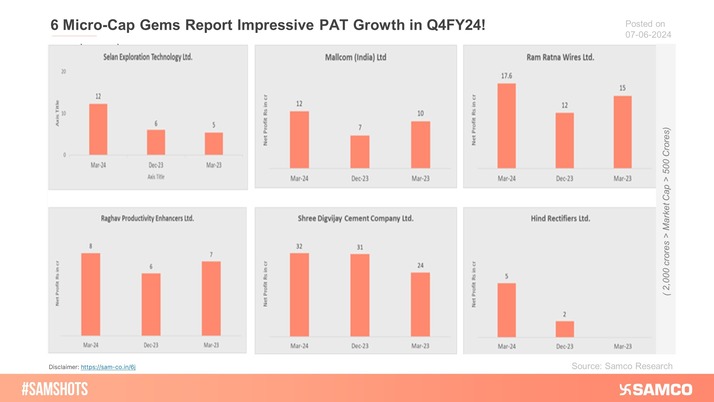
Here is the list of 6 micro-cap gems that report impressive PAT growth in Q4FY24.
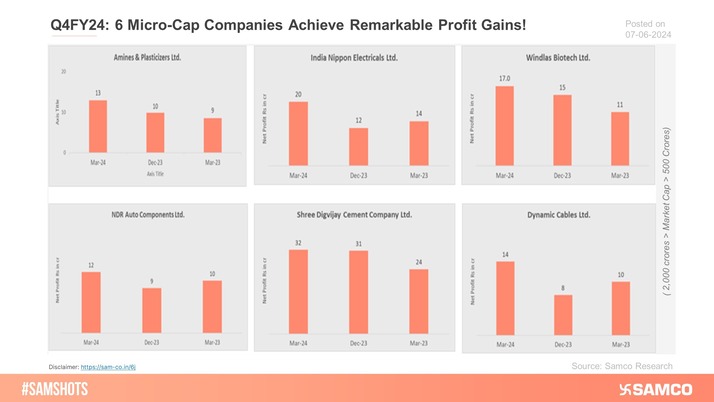
The below chart indicates the results of 6 micro-cap companies that achieved remarkable profit gains in Q4FY24.
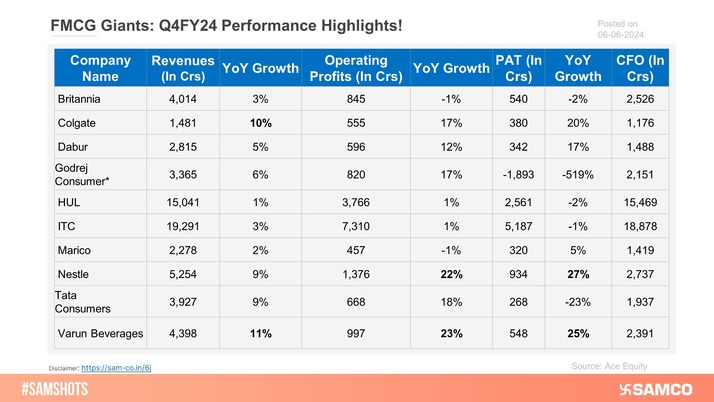
The FMCG giant's Q4FY24 financial performance has been indicated in the below chart.
On June 04, 2024, the index surged by 48%, marking its largest single-day rise in 8 years.
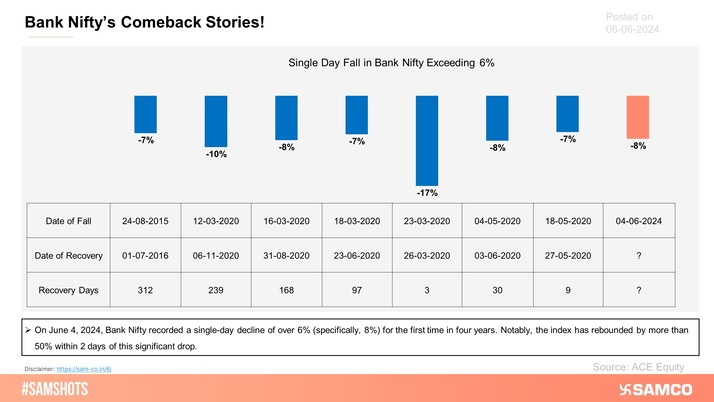
The chart above illustrates the number of days it takes for Bank Nifty to fully recover after falling by more than 6% in a single day over the past 13 years.
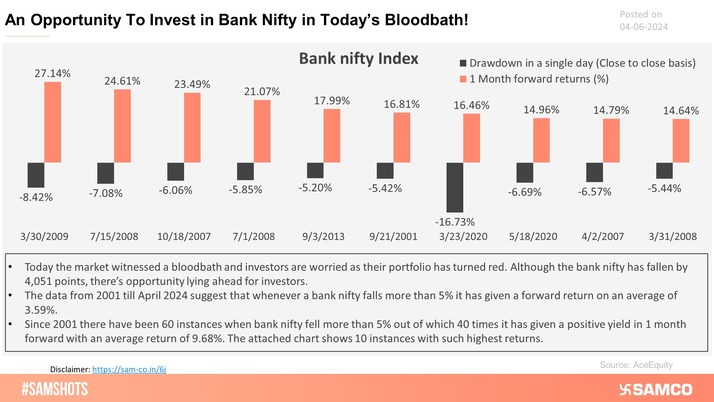
The below chart indicates 1-month forward returns in Bank Nifty when it declines by over 5% intraday.
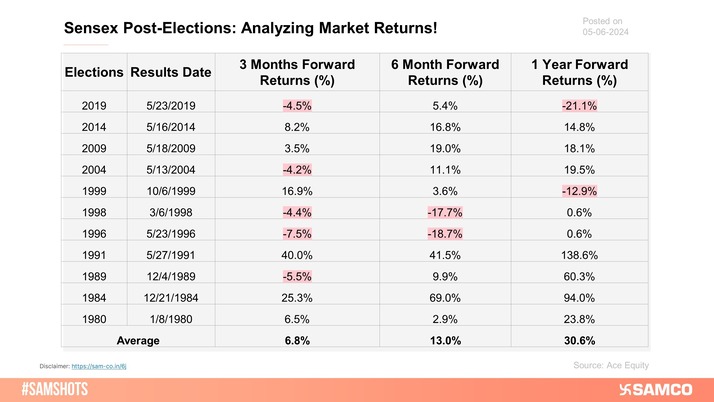
Here are the historical Sensex returns post-elections in different time frames!
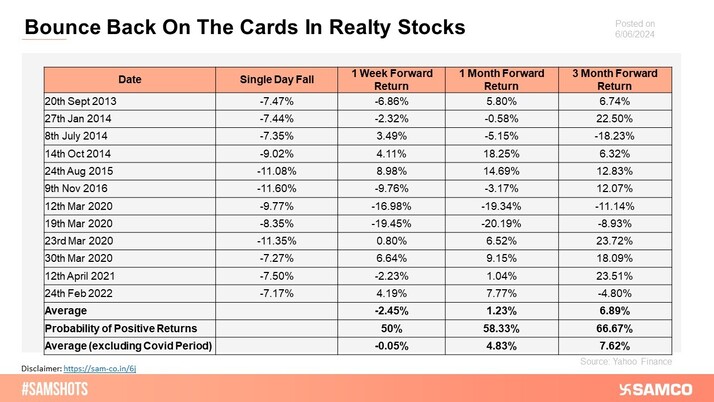
Here's how Nifty Realty reacts when it declines by over 7% intraday!
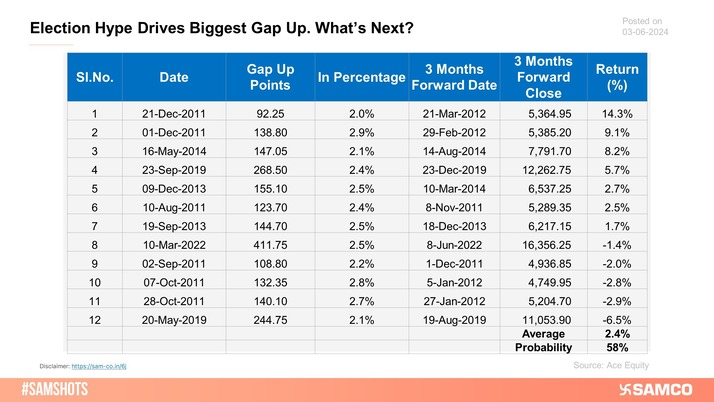
The below chart presents 3-month forward returns of Nifty 50, post-gap up opening of over 2% excluding post-Covid recovery.
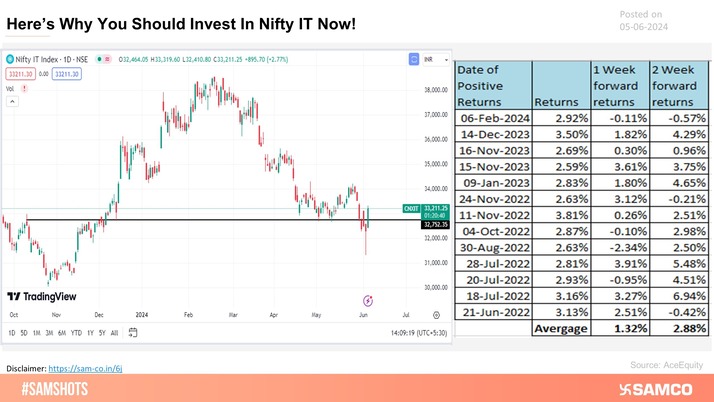
Nifty IT sectors likely starts a fresh new rally after a big downtrend!
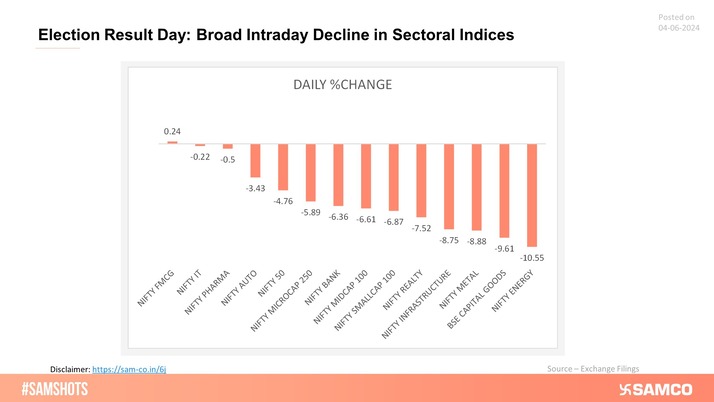
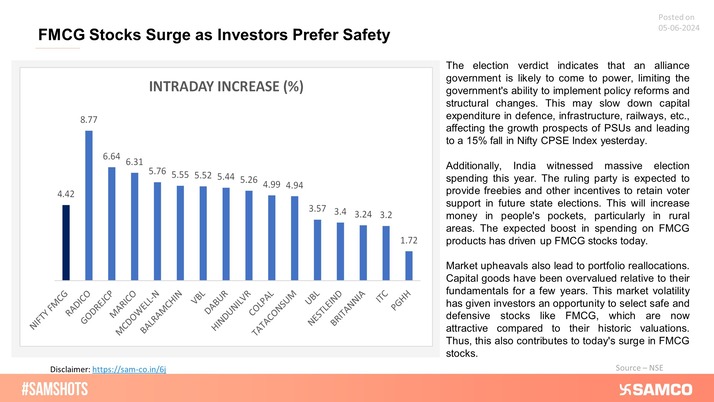
FMCG, IT, and Pharma survived the broad market crash on June 04, 2024 due to their defensive nature.
FMCG stocks rallied the day after the election results, as staples provide safety during market uncertainty!
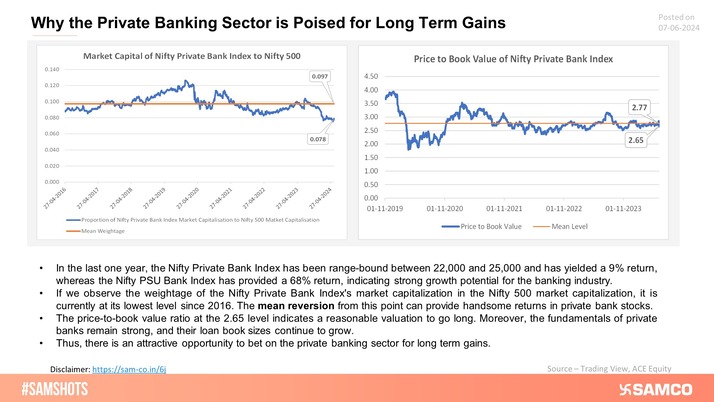
Market Capitalization of Nifty Private Bank to Nifty 500 is at its lowest level since 2016!
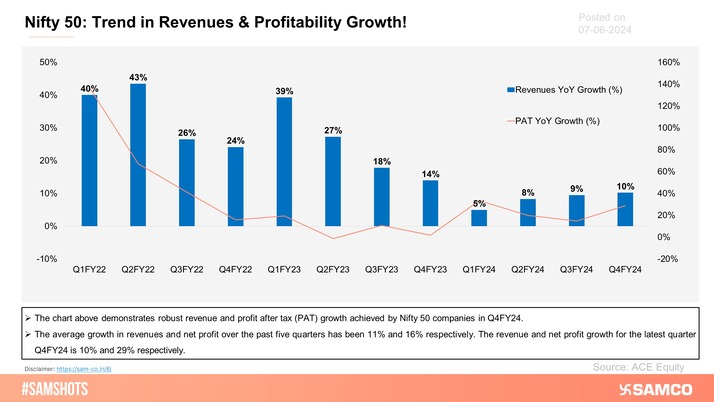
Nifty has maintained its trend of delivering the highest revenue in Q4 in the past three financial years.
Presented below are the weekly returns of the sectoral indices!
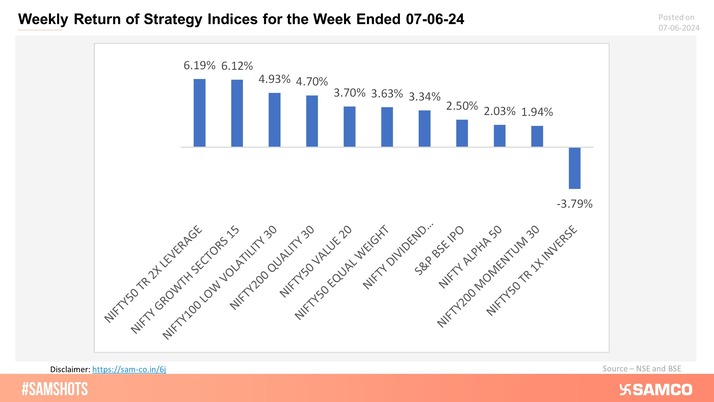
Presented below are the weekly returns of the strategy indices!
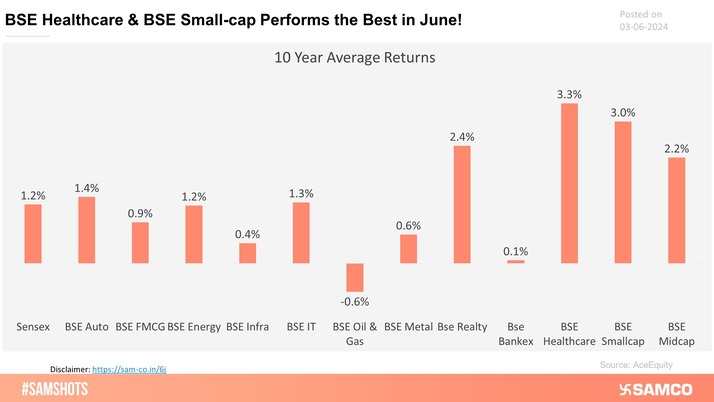
The chart below displays the average returns of various indices in June over the past 10 years.
In the MPC meeting, RBI kept the repo rate unchanged and announced a 20 bps upward GDP estimation in FY25.
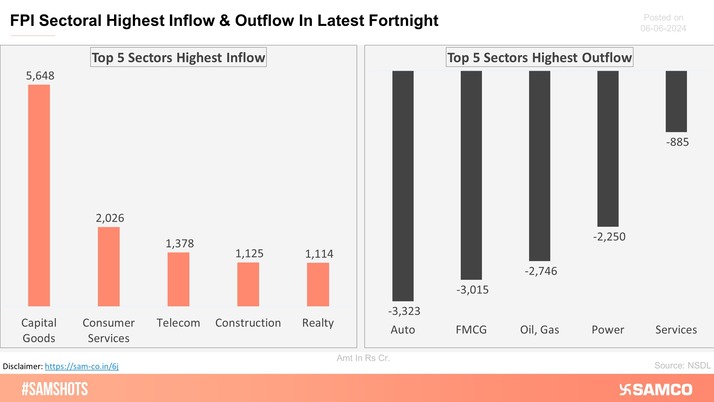
The below chart shows the highest & lowest sectoral investment made by FPI in the latest fortnight.
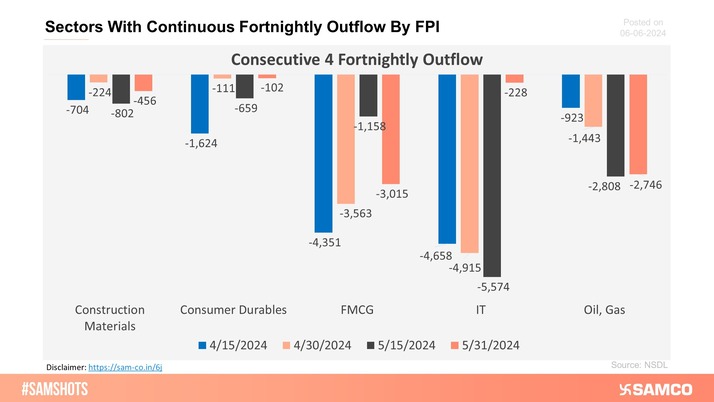
The chart depicts sectors that attract continuous outflow of FPI in consecutive 4 fortnights.
UTIAMC ends consolidation, sustains above 50 DMA
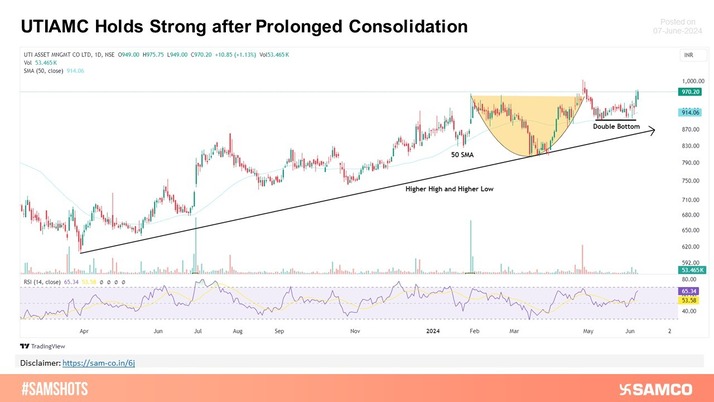
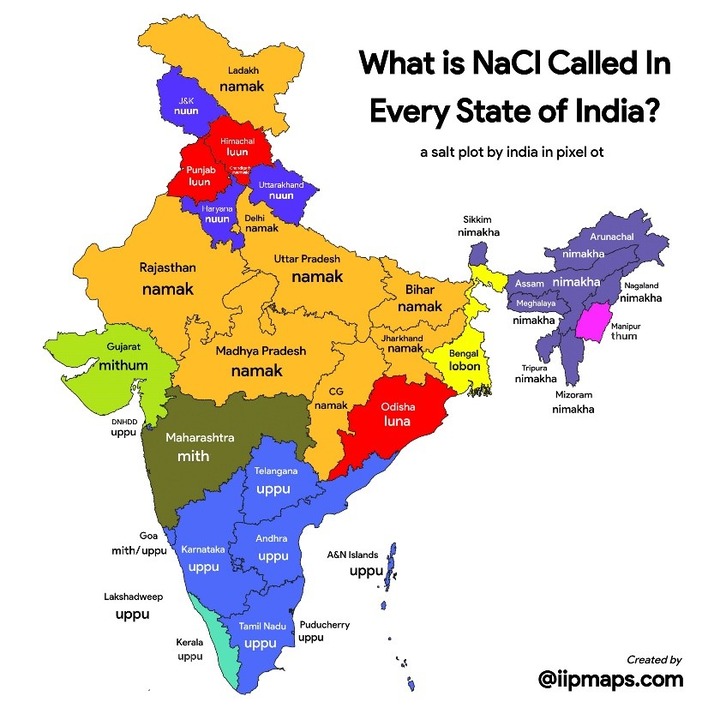
Image Source: @indiainpixels (Twitter)
 Easy & quick
1. Register on SCORES portal
2. Mandatory details for filling complaints on SCORES
Name | PAN | Address | Mobile | Number | E-mail ID
3. Benefits
Effective Communication
Speedy redressal of the grievances
