The Indian markets had a sell-on-rise kind of week, where every bounce was met with selling pressure. Banking stocks took a hit, mainly because of the sharp fall in IndusInd Bank, which kept the sector under pressure. On the other hand, telecom stocks like Airtel and Reliance were buzzing after teaming up with Starlink to bring high-speed internet to India. Despite some stock-specific action, the broader market struggled, with midcaps and smallcaps facing continued selling pressure.
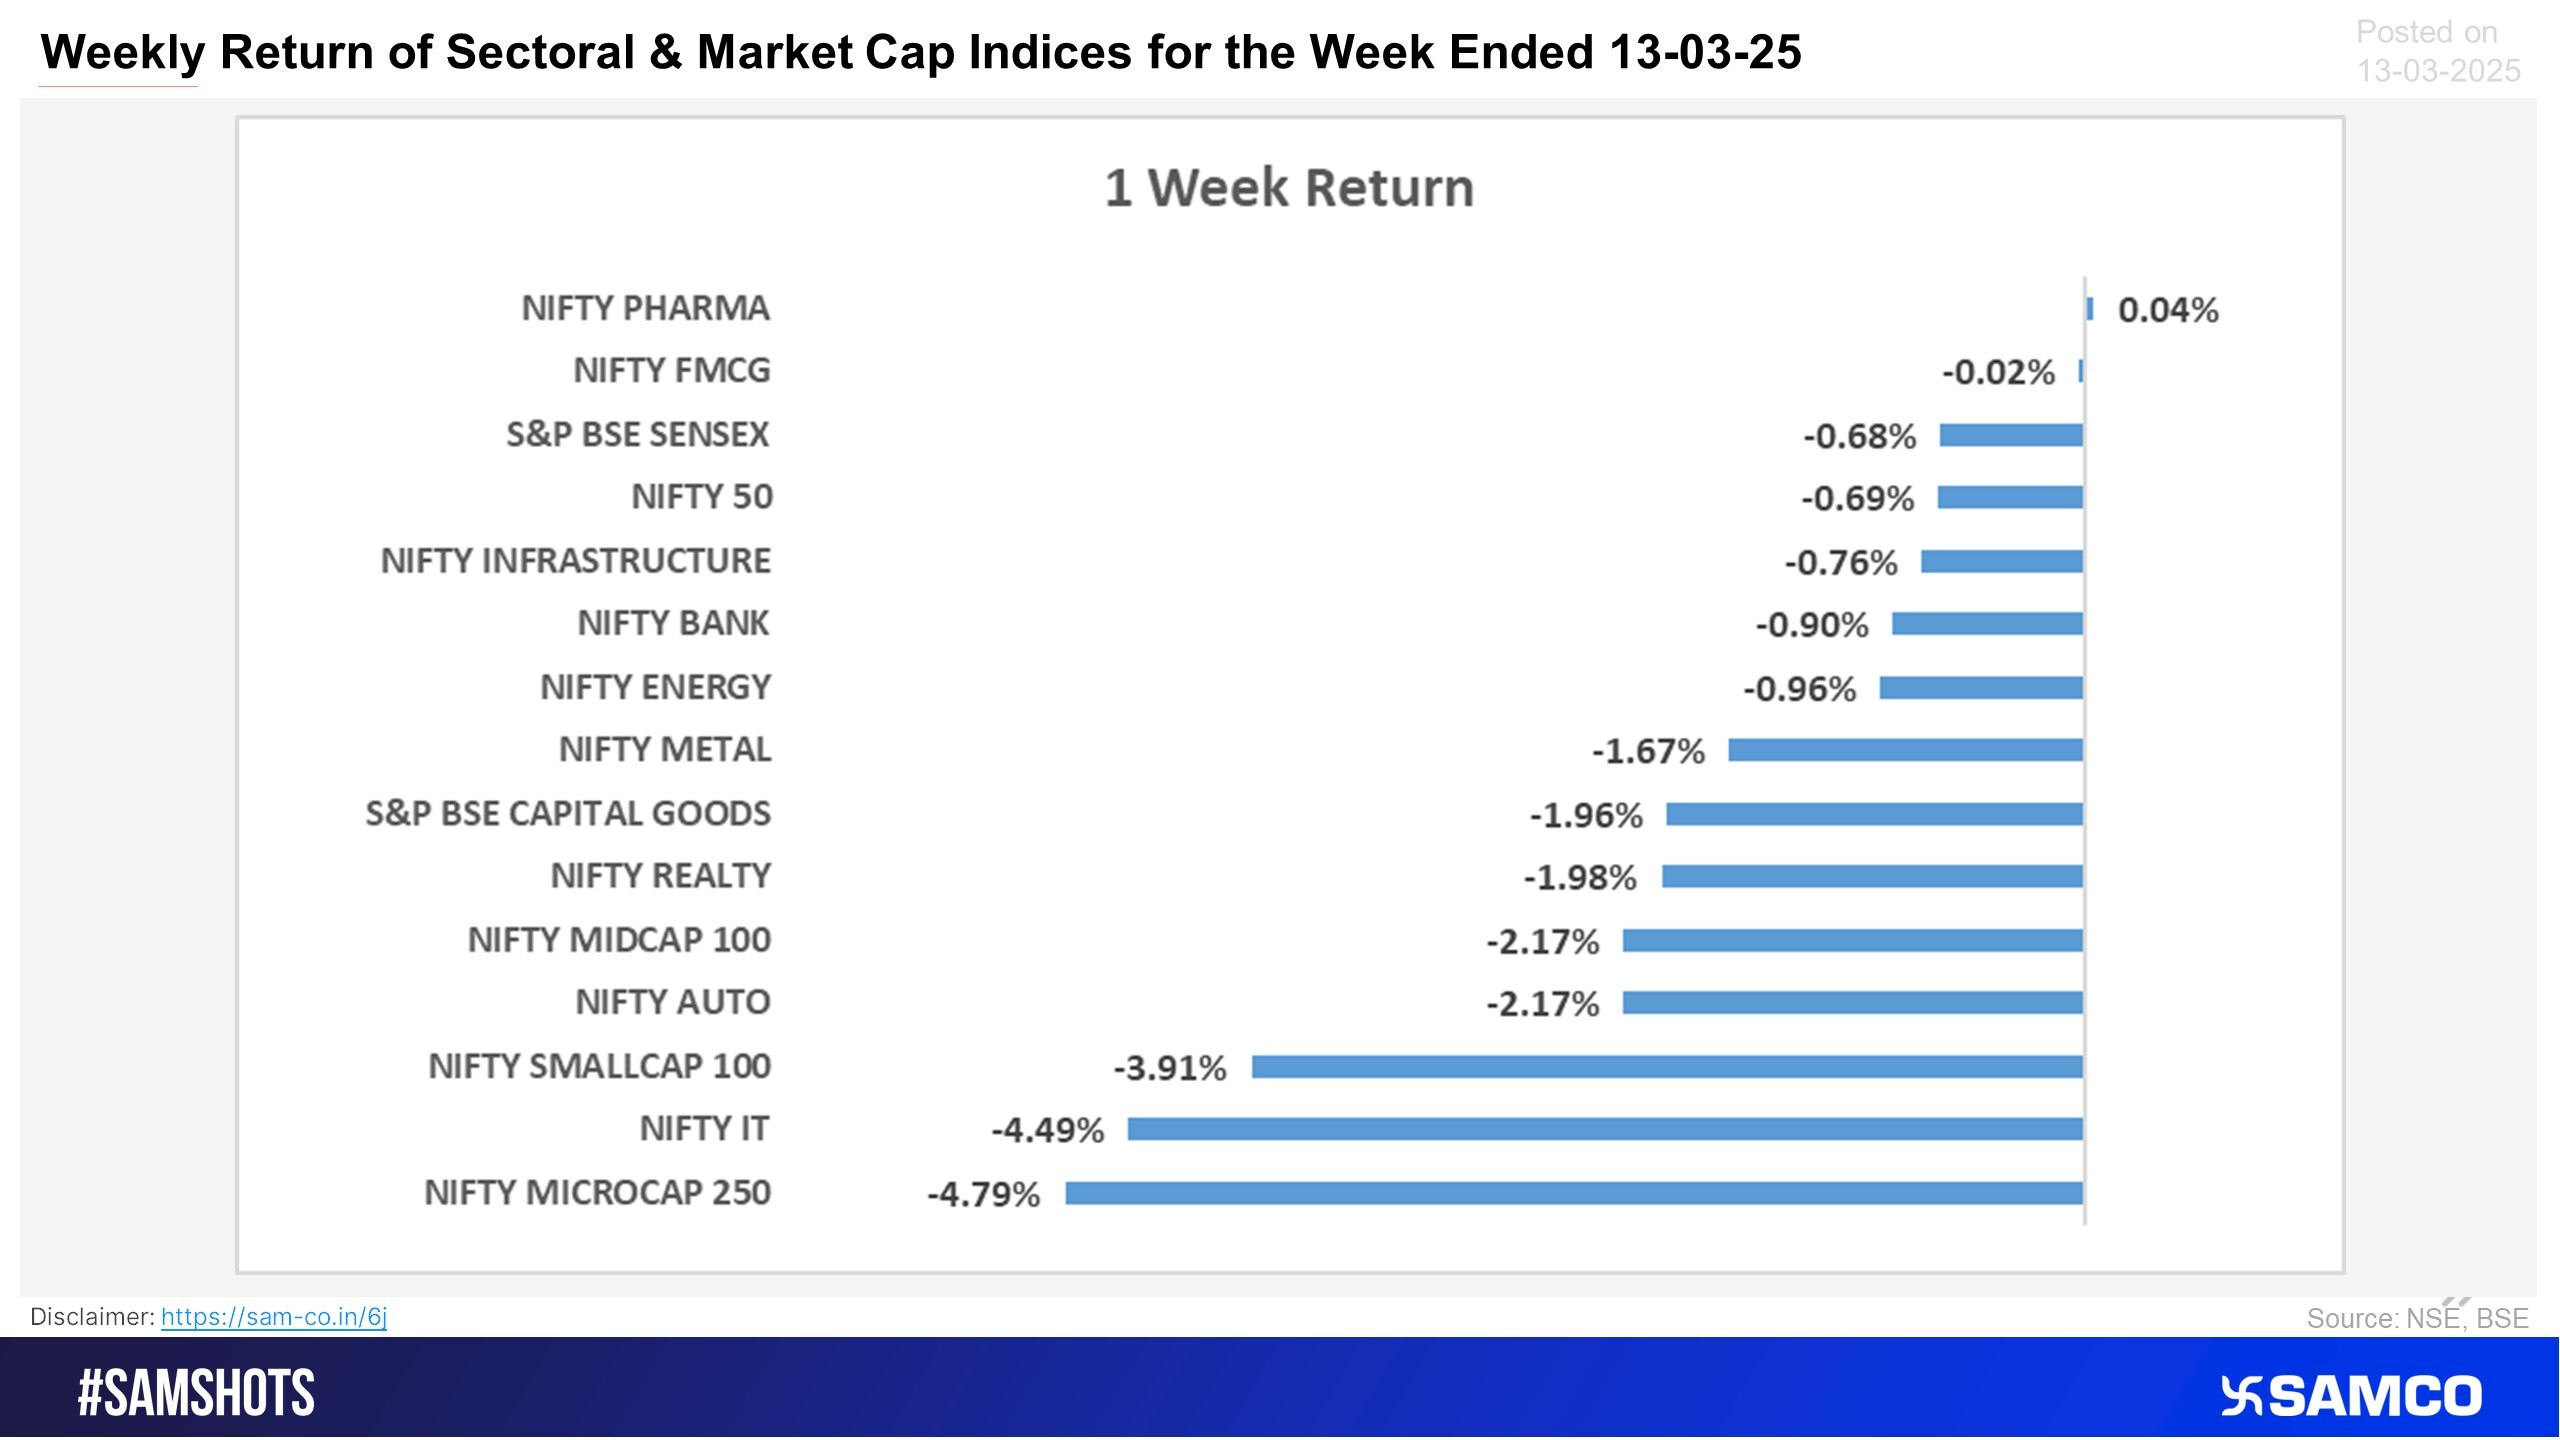
The Nifty 50 ended the week 0.69% lower at 22,397. Except Nifty Pharma, all the sectoral indices ended the week in red with Nifty IT declining the most by 4.49%.
Scroll down to understand more of such market news and perspectives for the week gone by in easily understandable charts.
Here's why IndusInd shares faced a bloodbath on 11th March 2025.
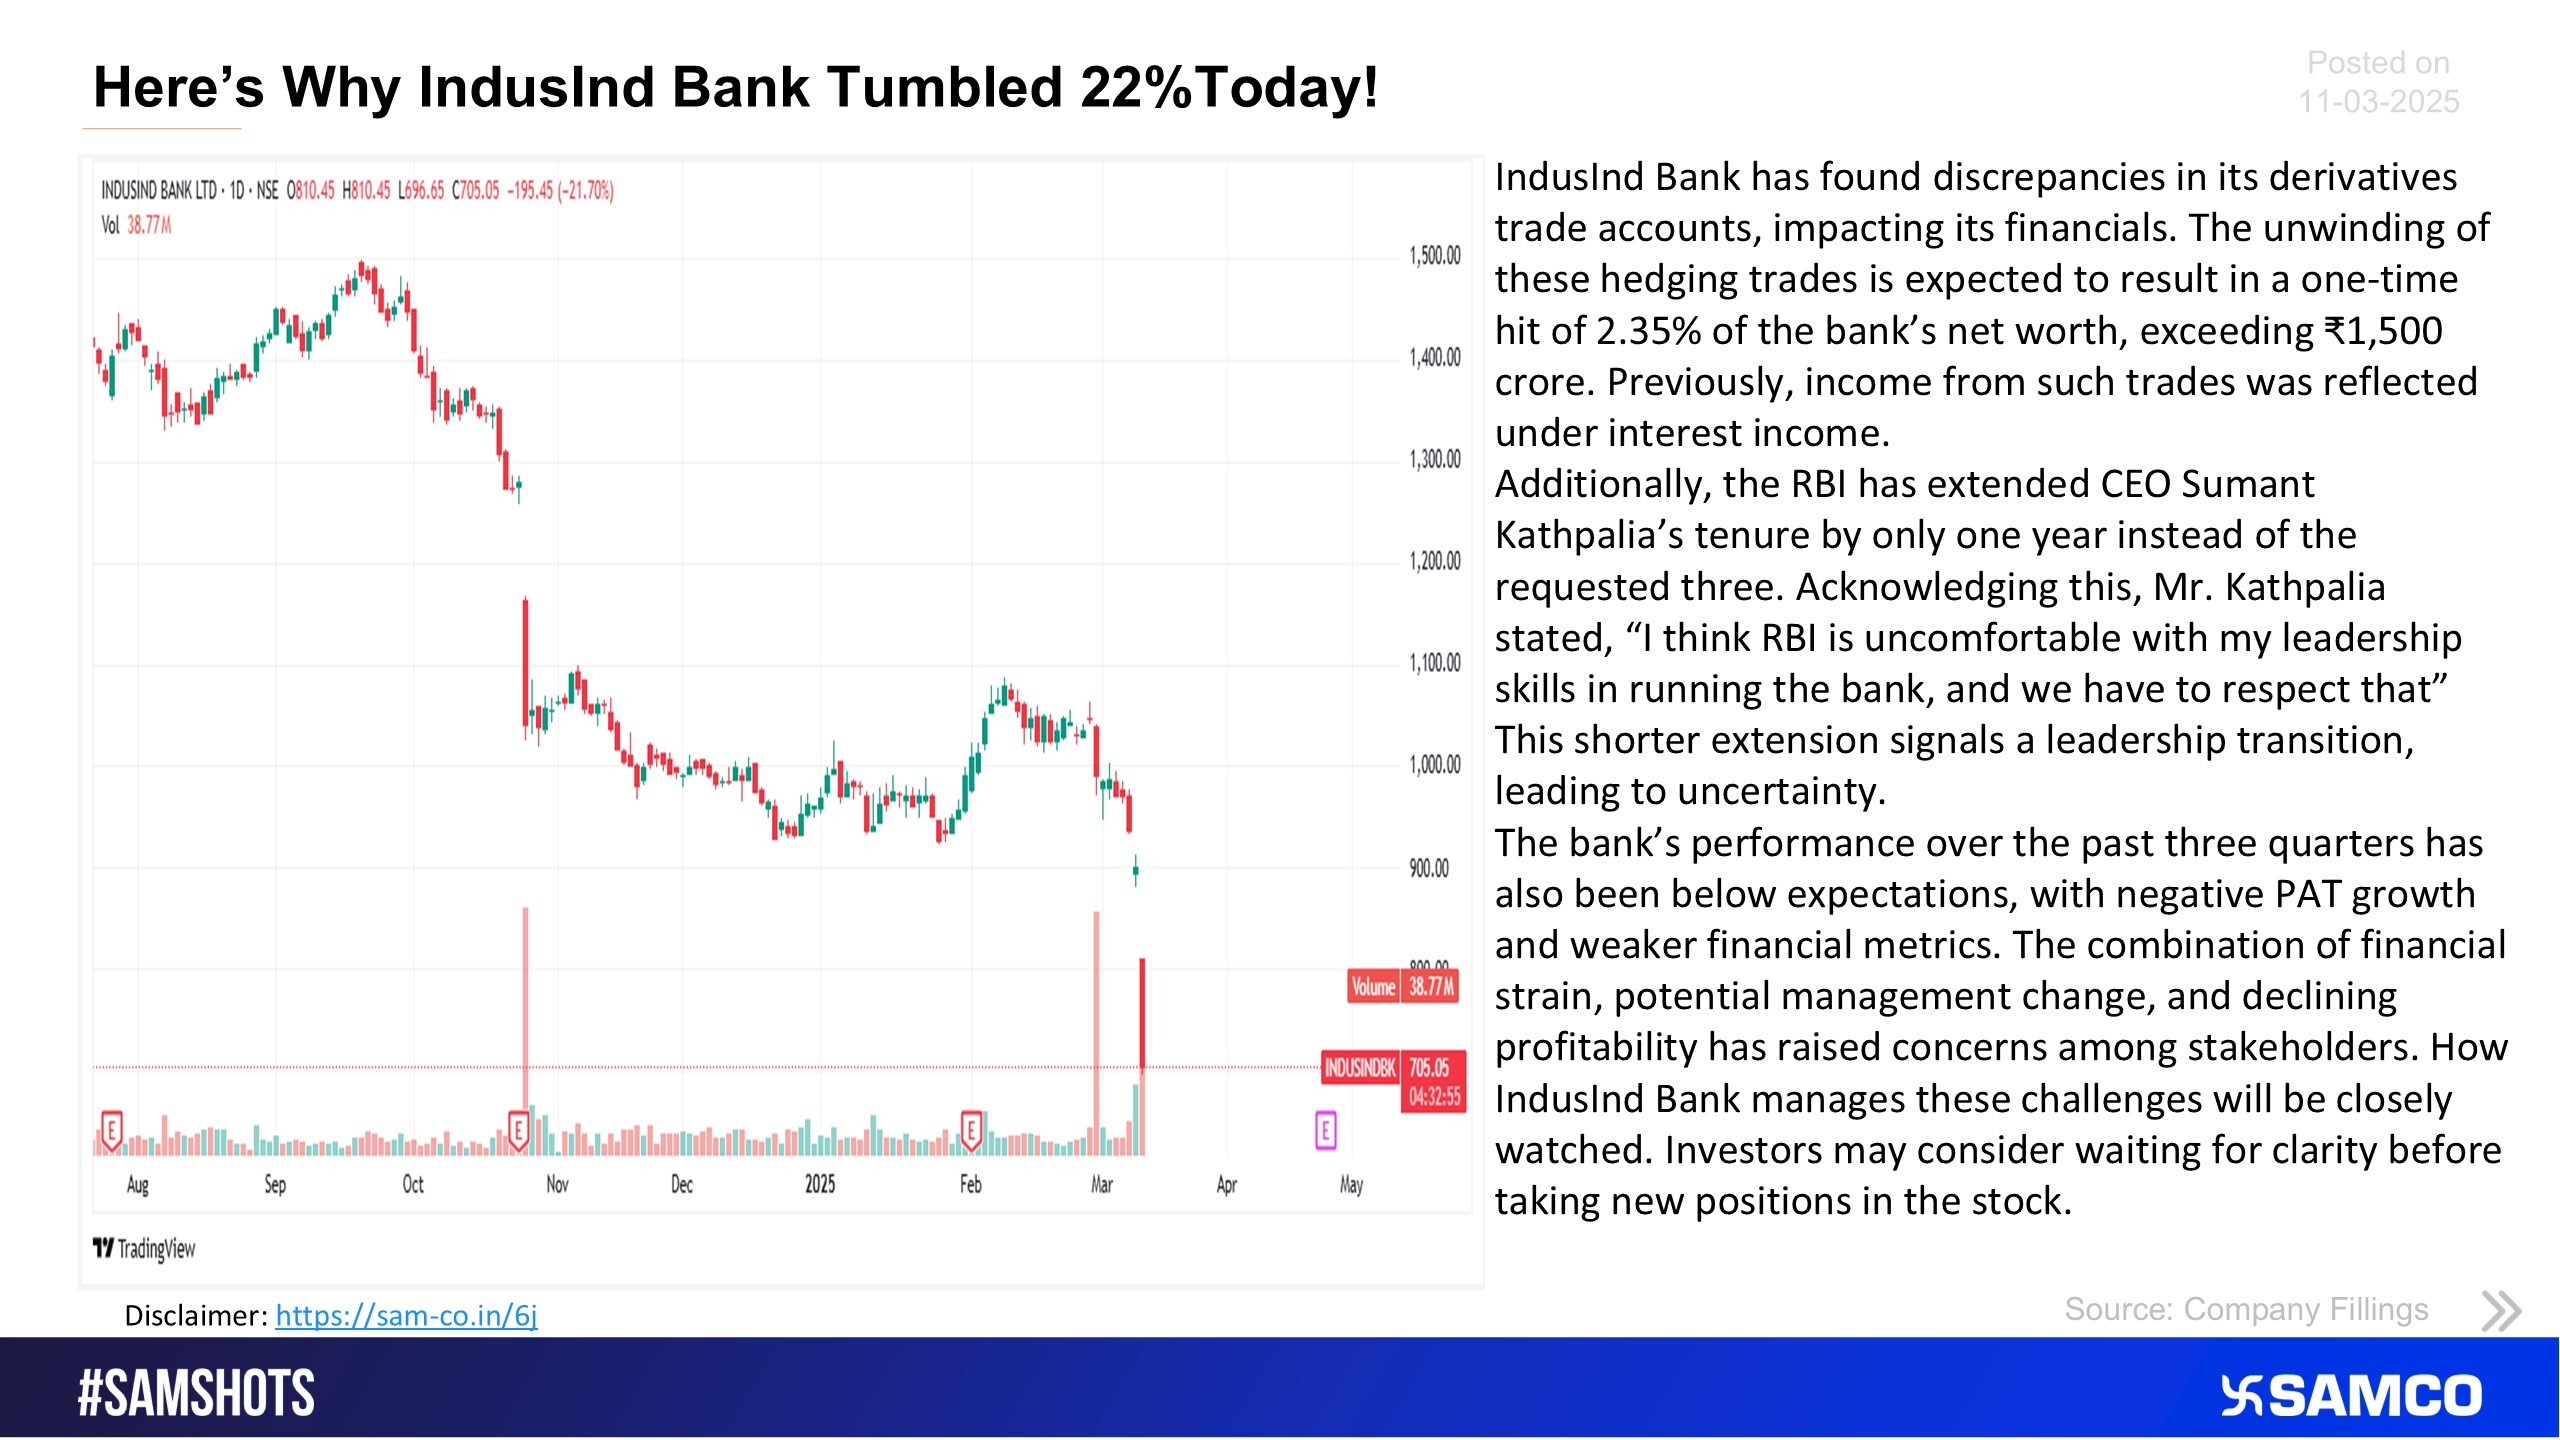


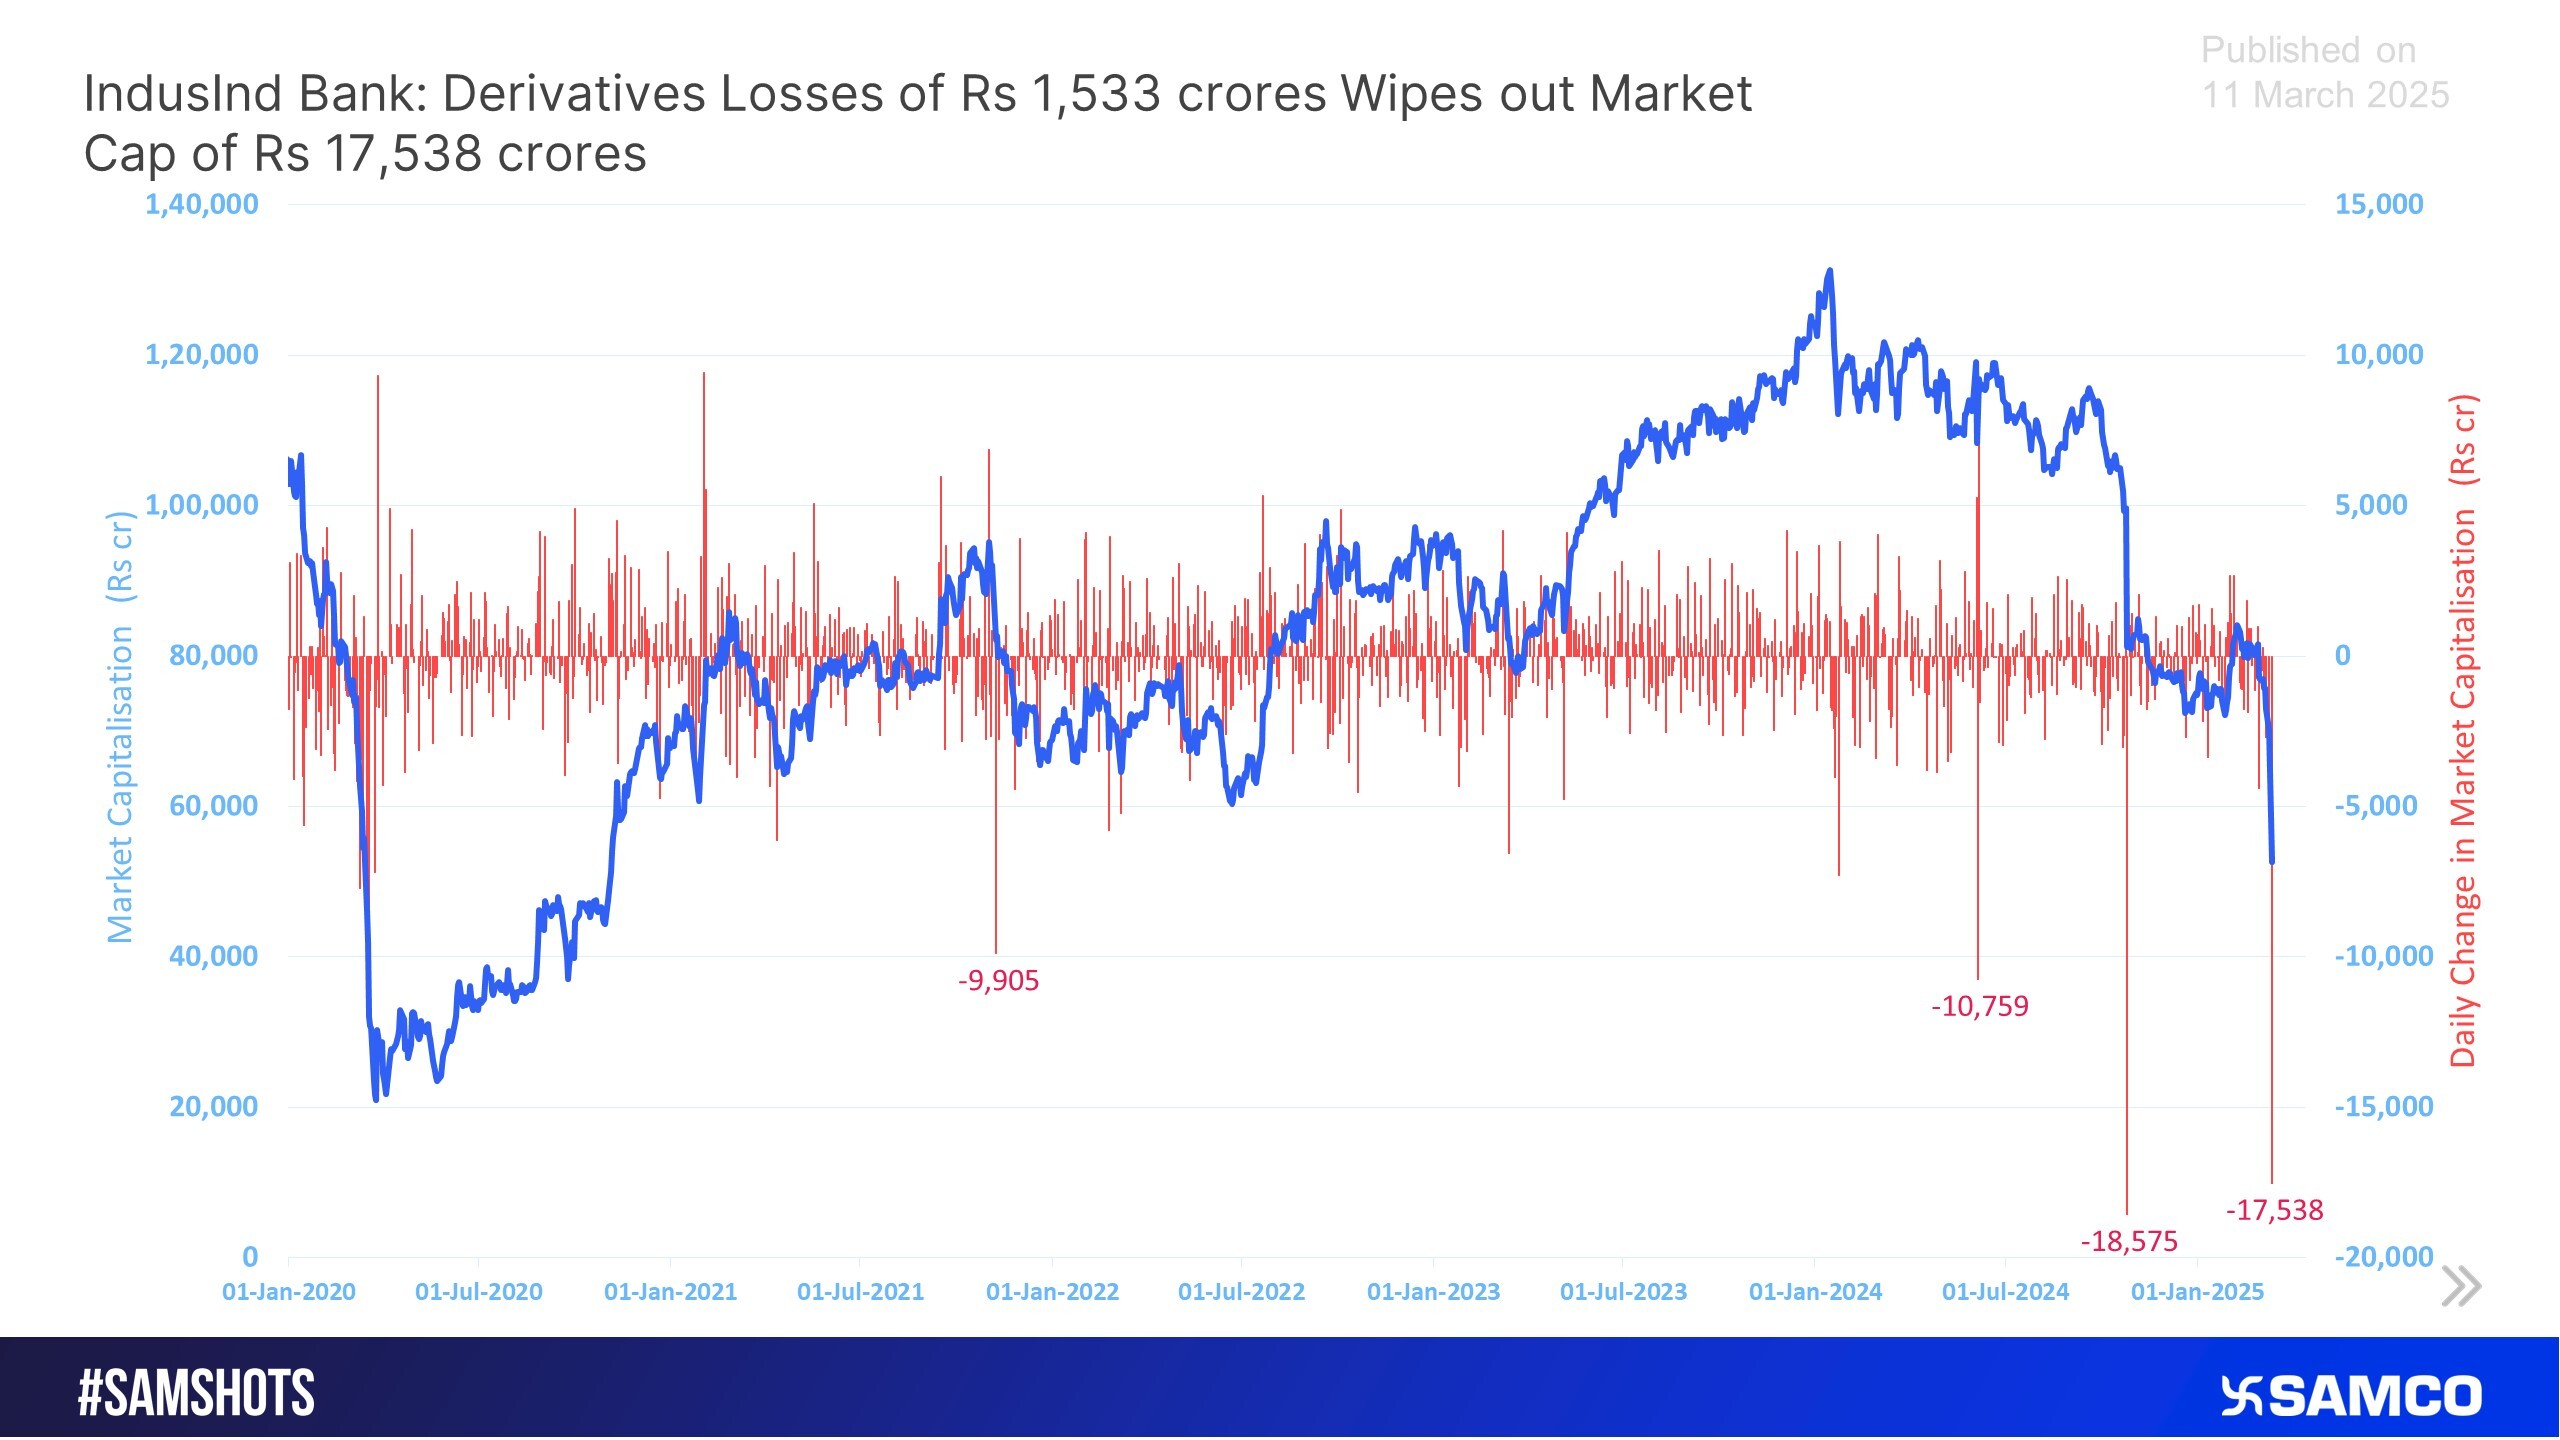
Derivative losses at IndusInd Bank of Rs. 1,533 crores have led to a crash in the stocks by 25%.
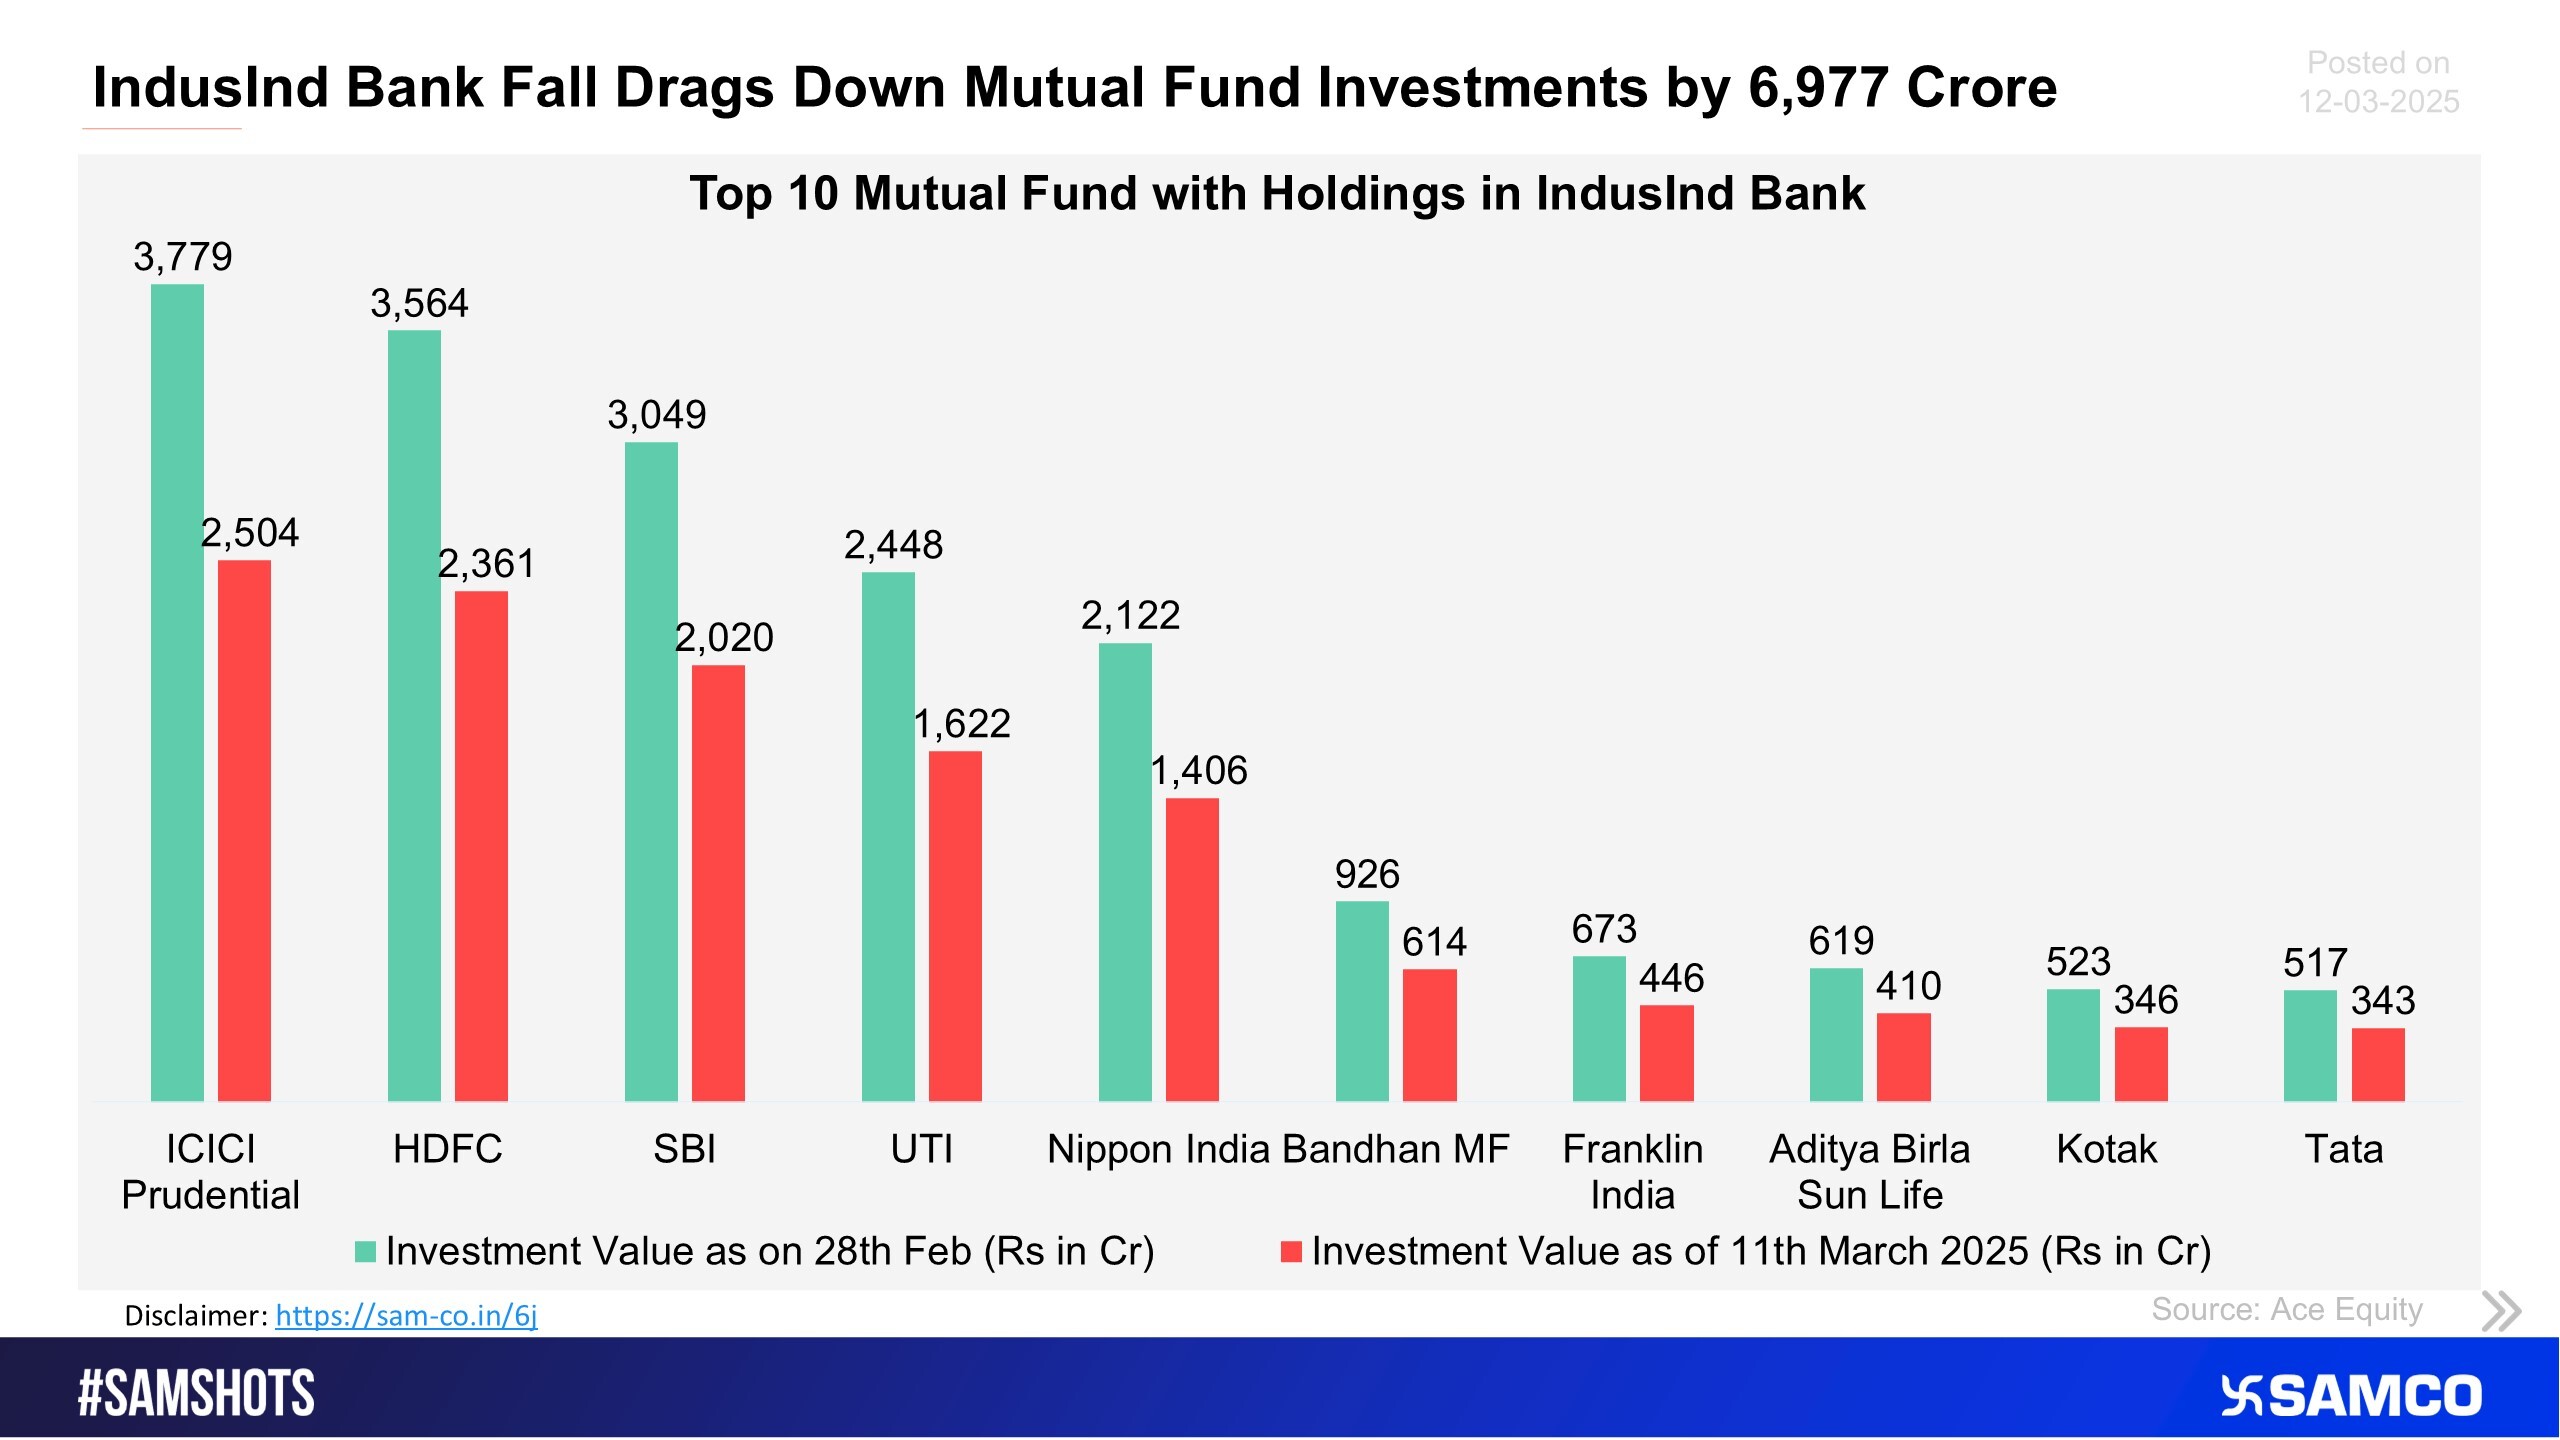
The below chart displays the top 10 mutual funds that were impacted most due to a fall in share price of IndusInd Bank.
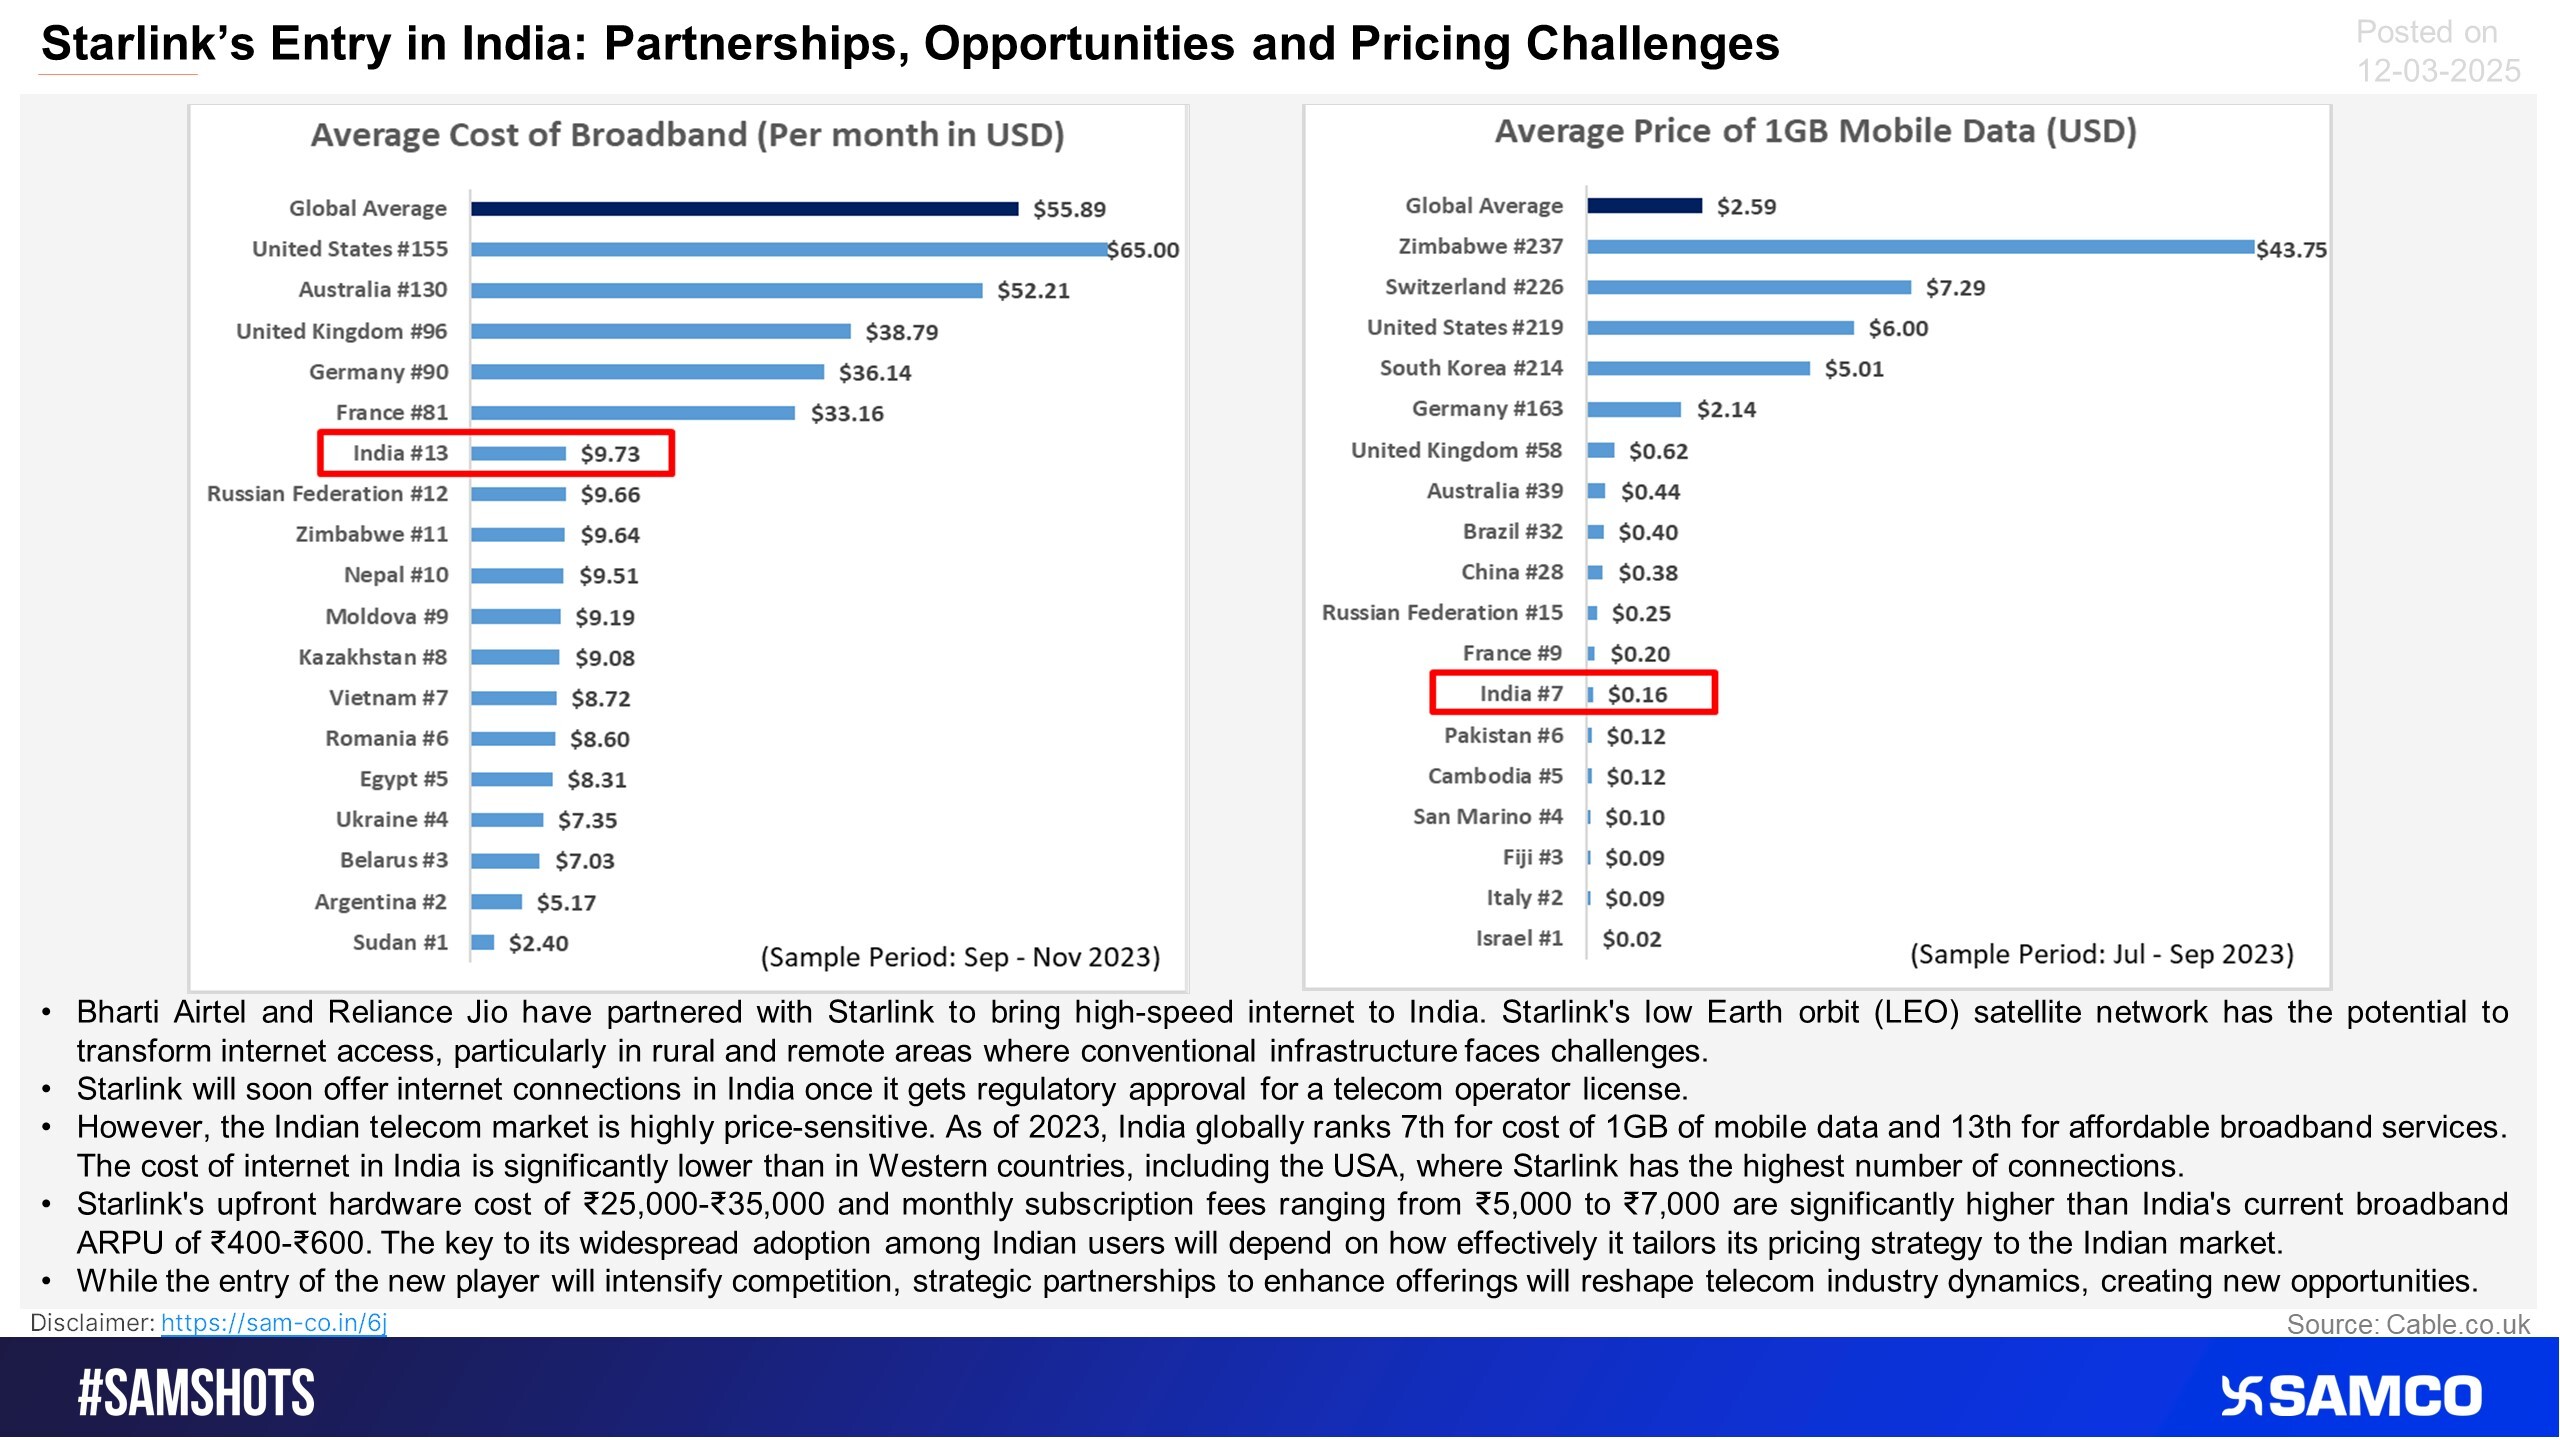
Airtel & Jio have agreed with Starlink, opening new opportunities for the industry, but let’s analyse the challenge that Starlink will face in India.
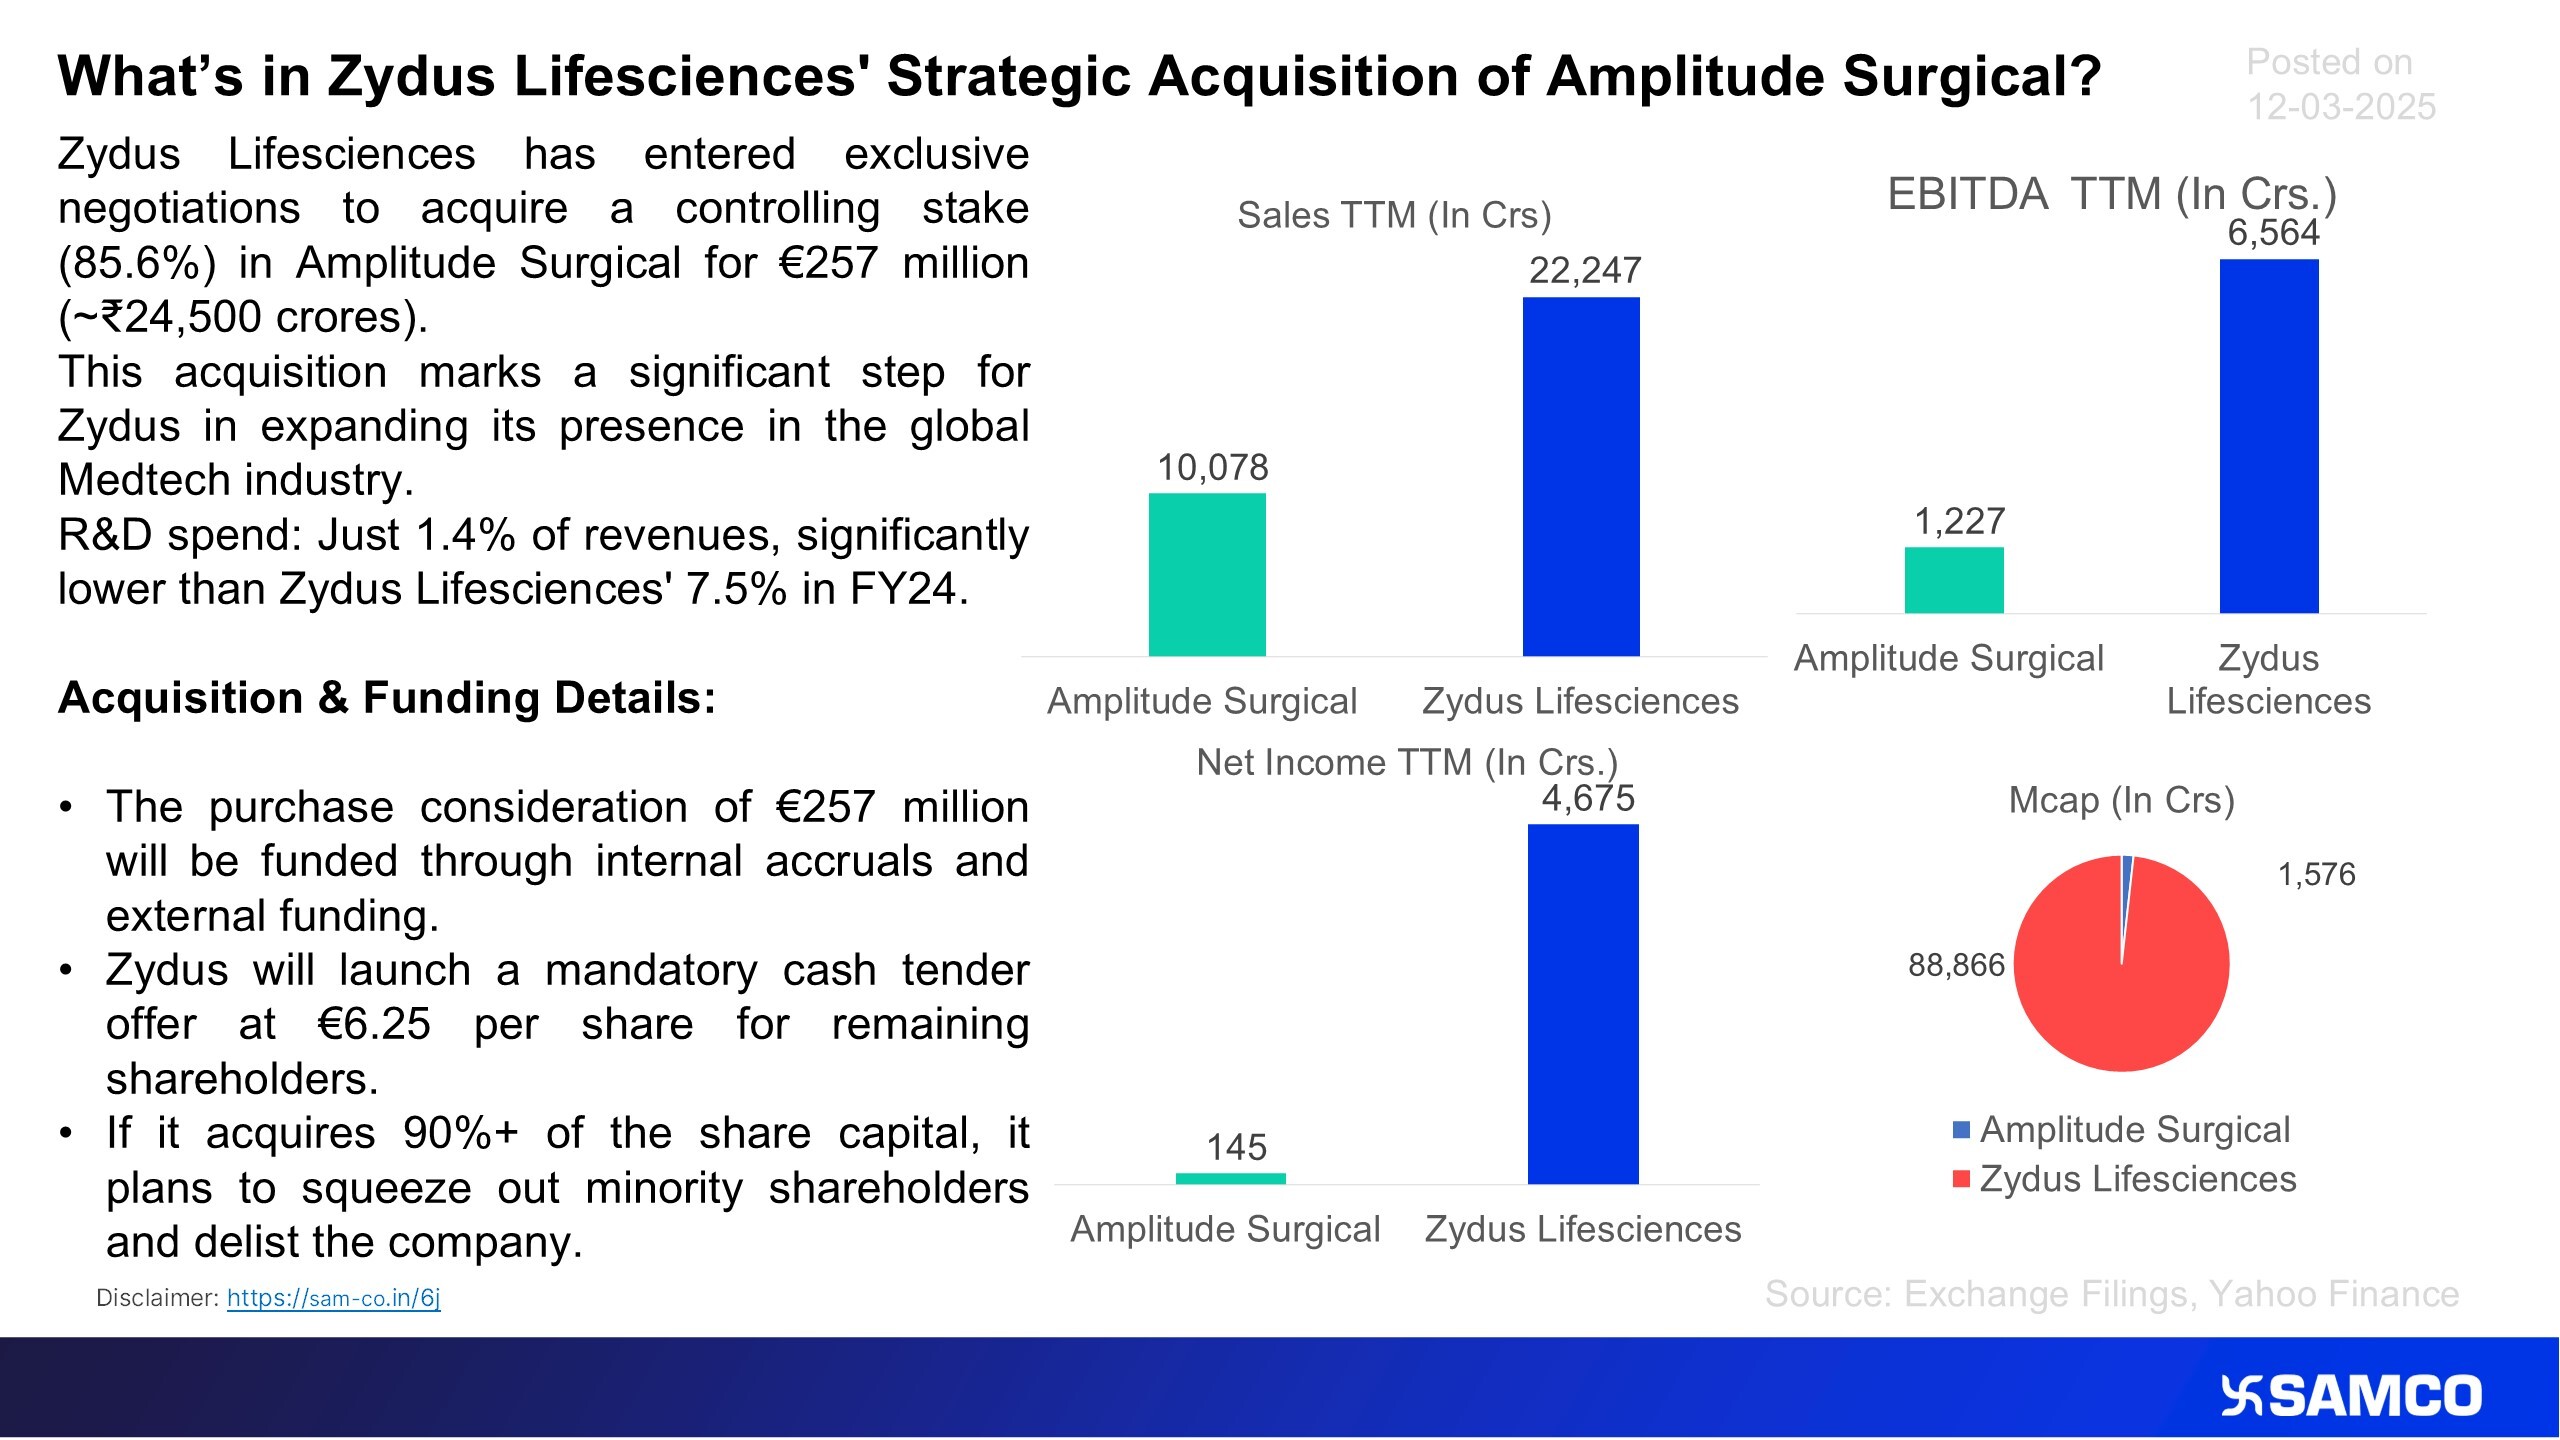
Here’s how the transaction would take place in the acquisition of Amplitude Surgical by Zydus.
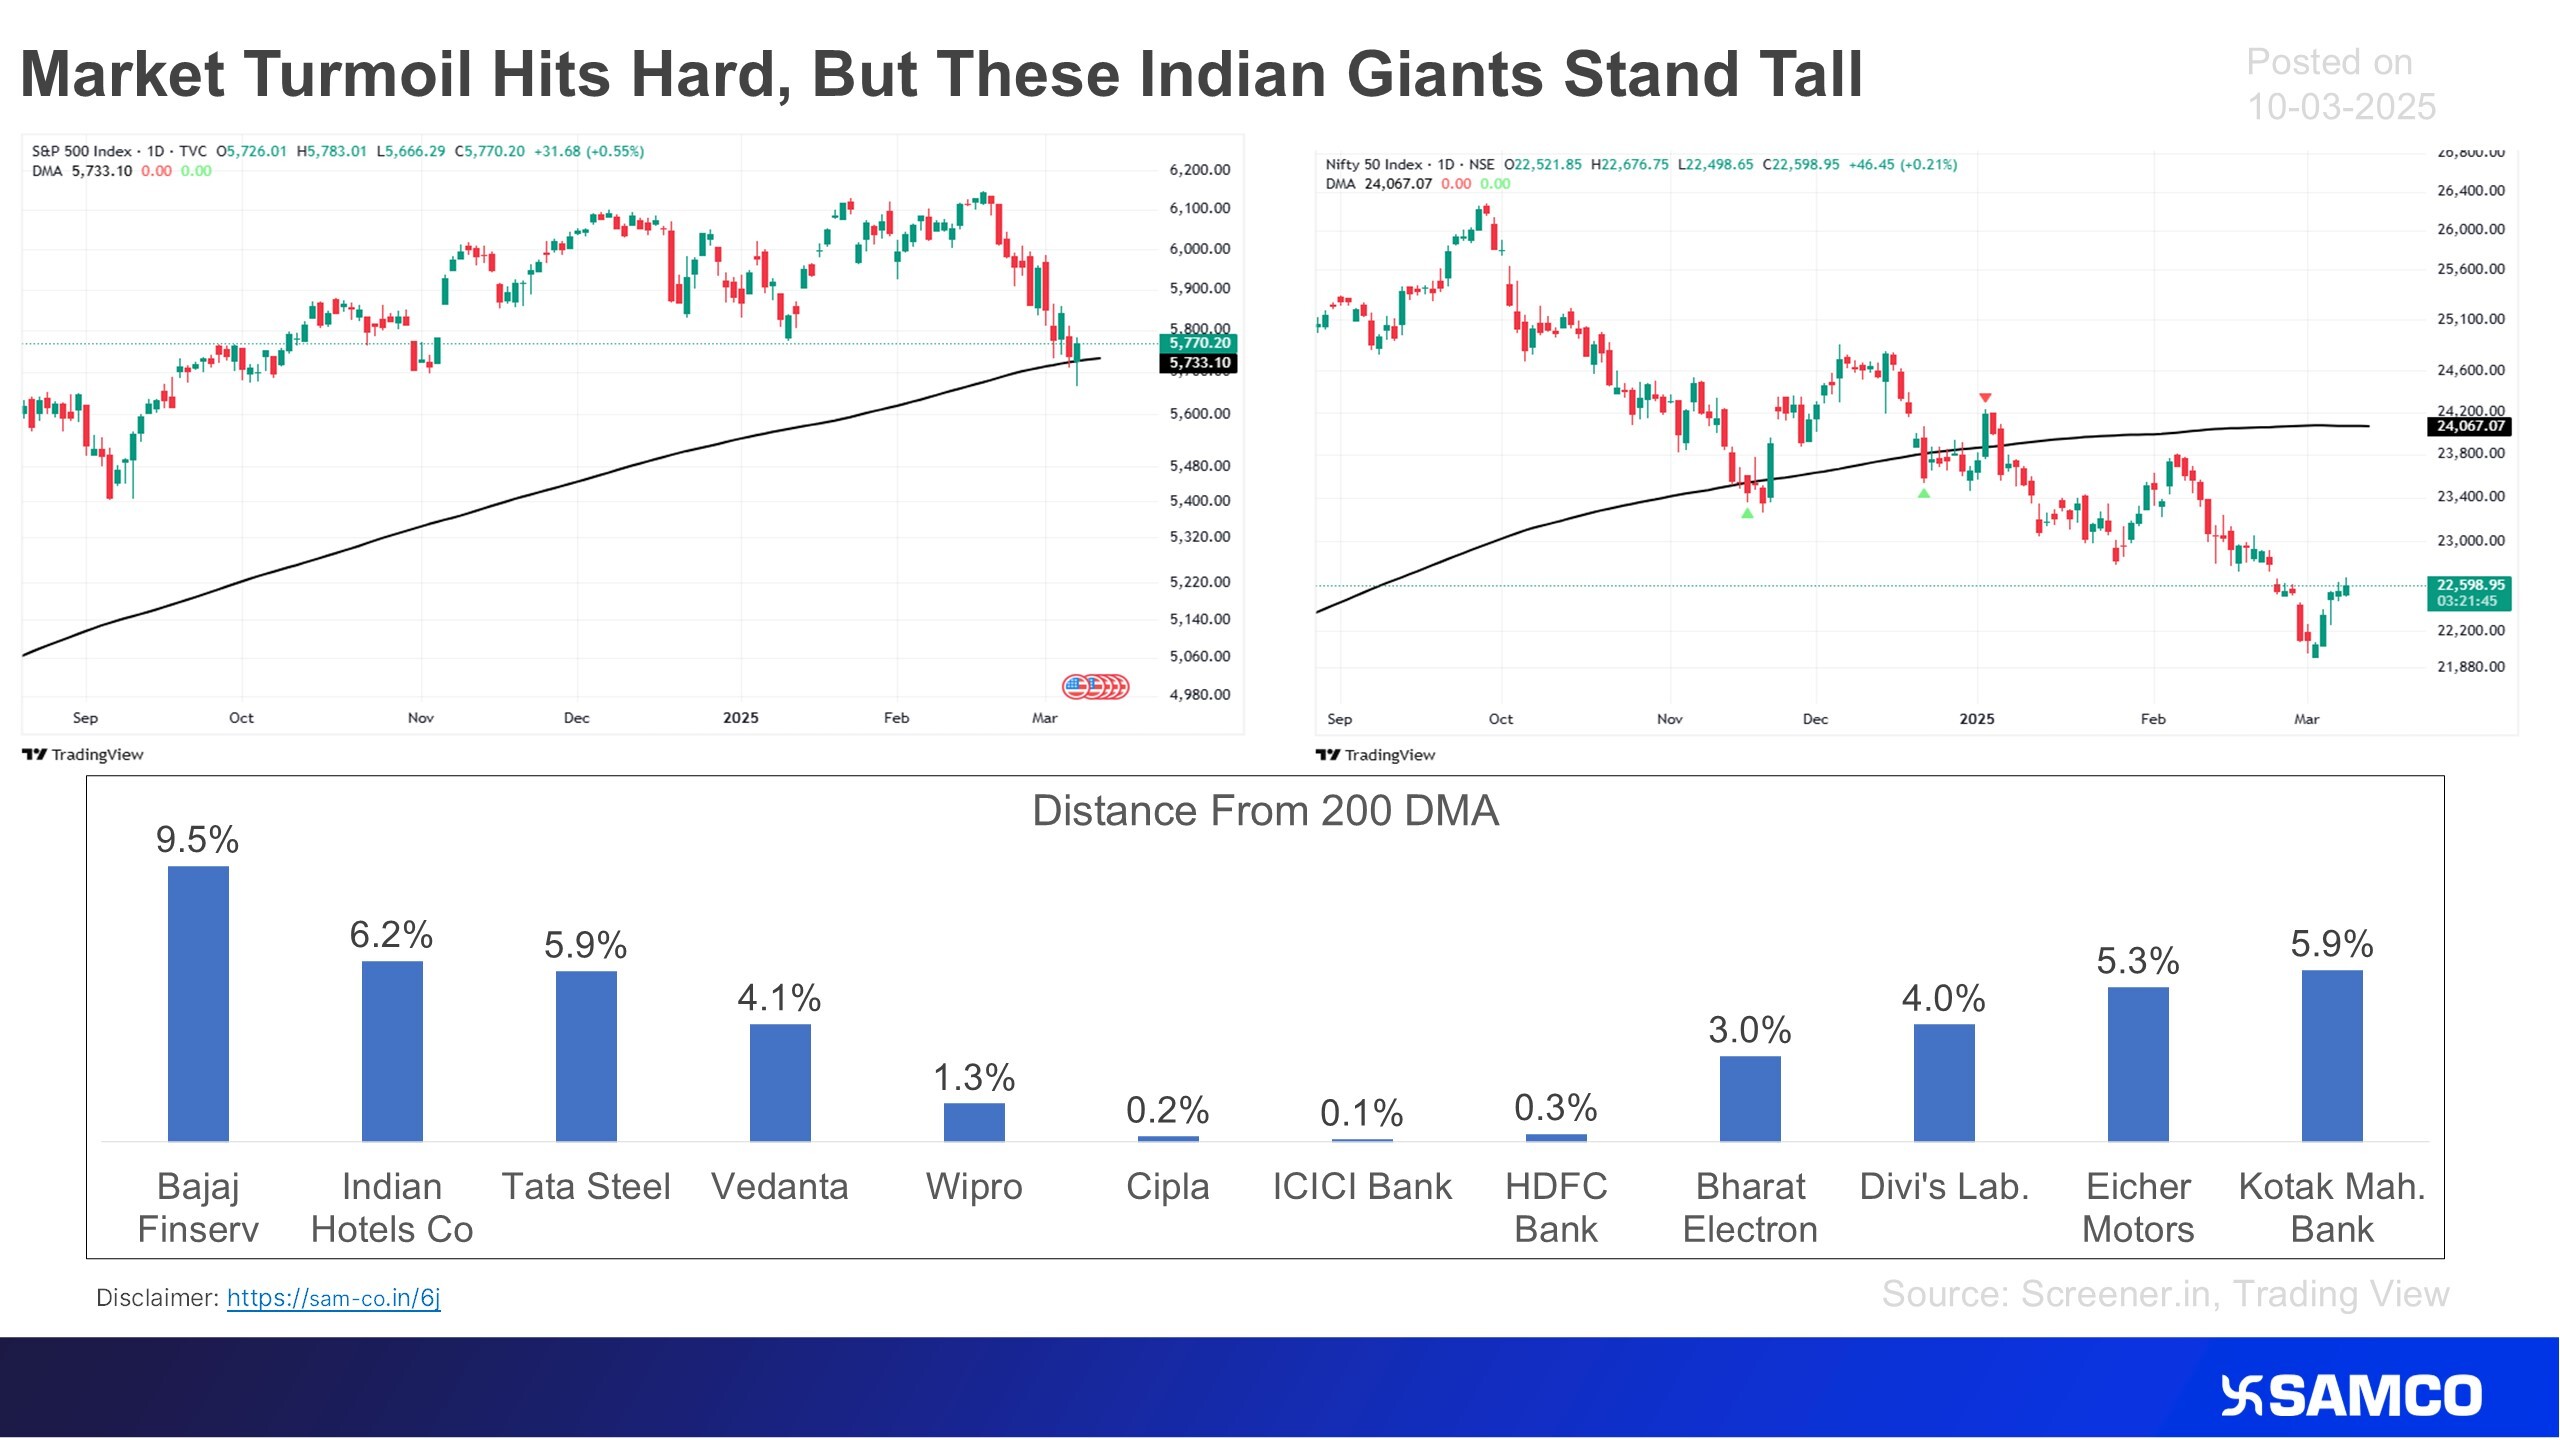
The accompanying chart presents the list of companies that stood strong even during the market fall.
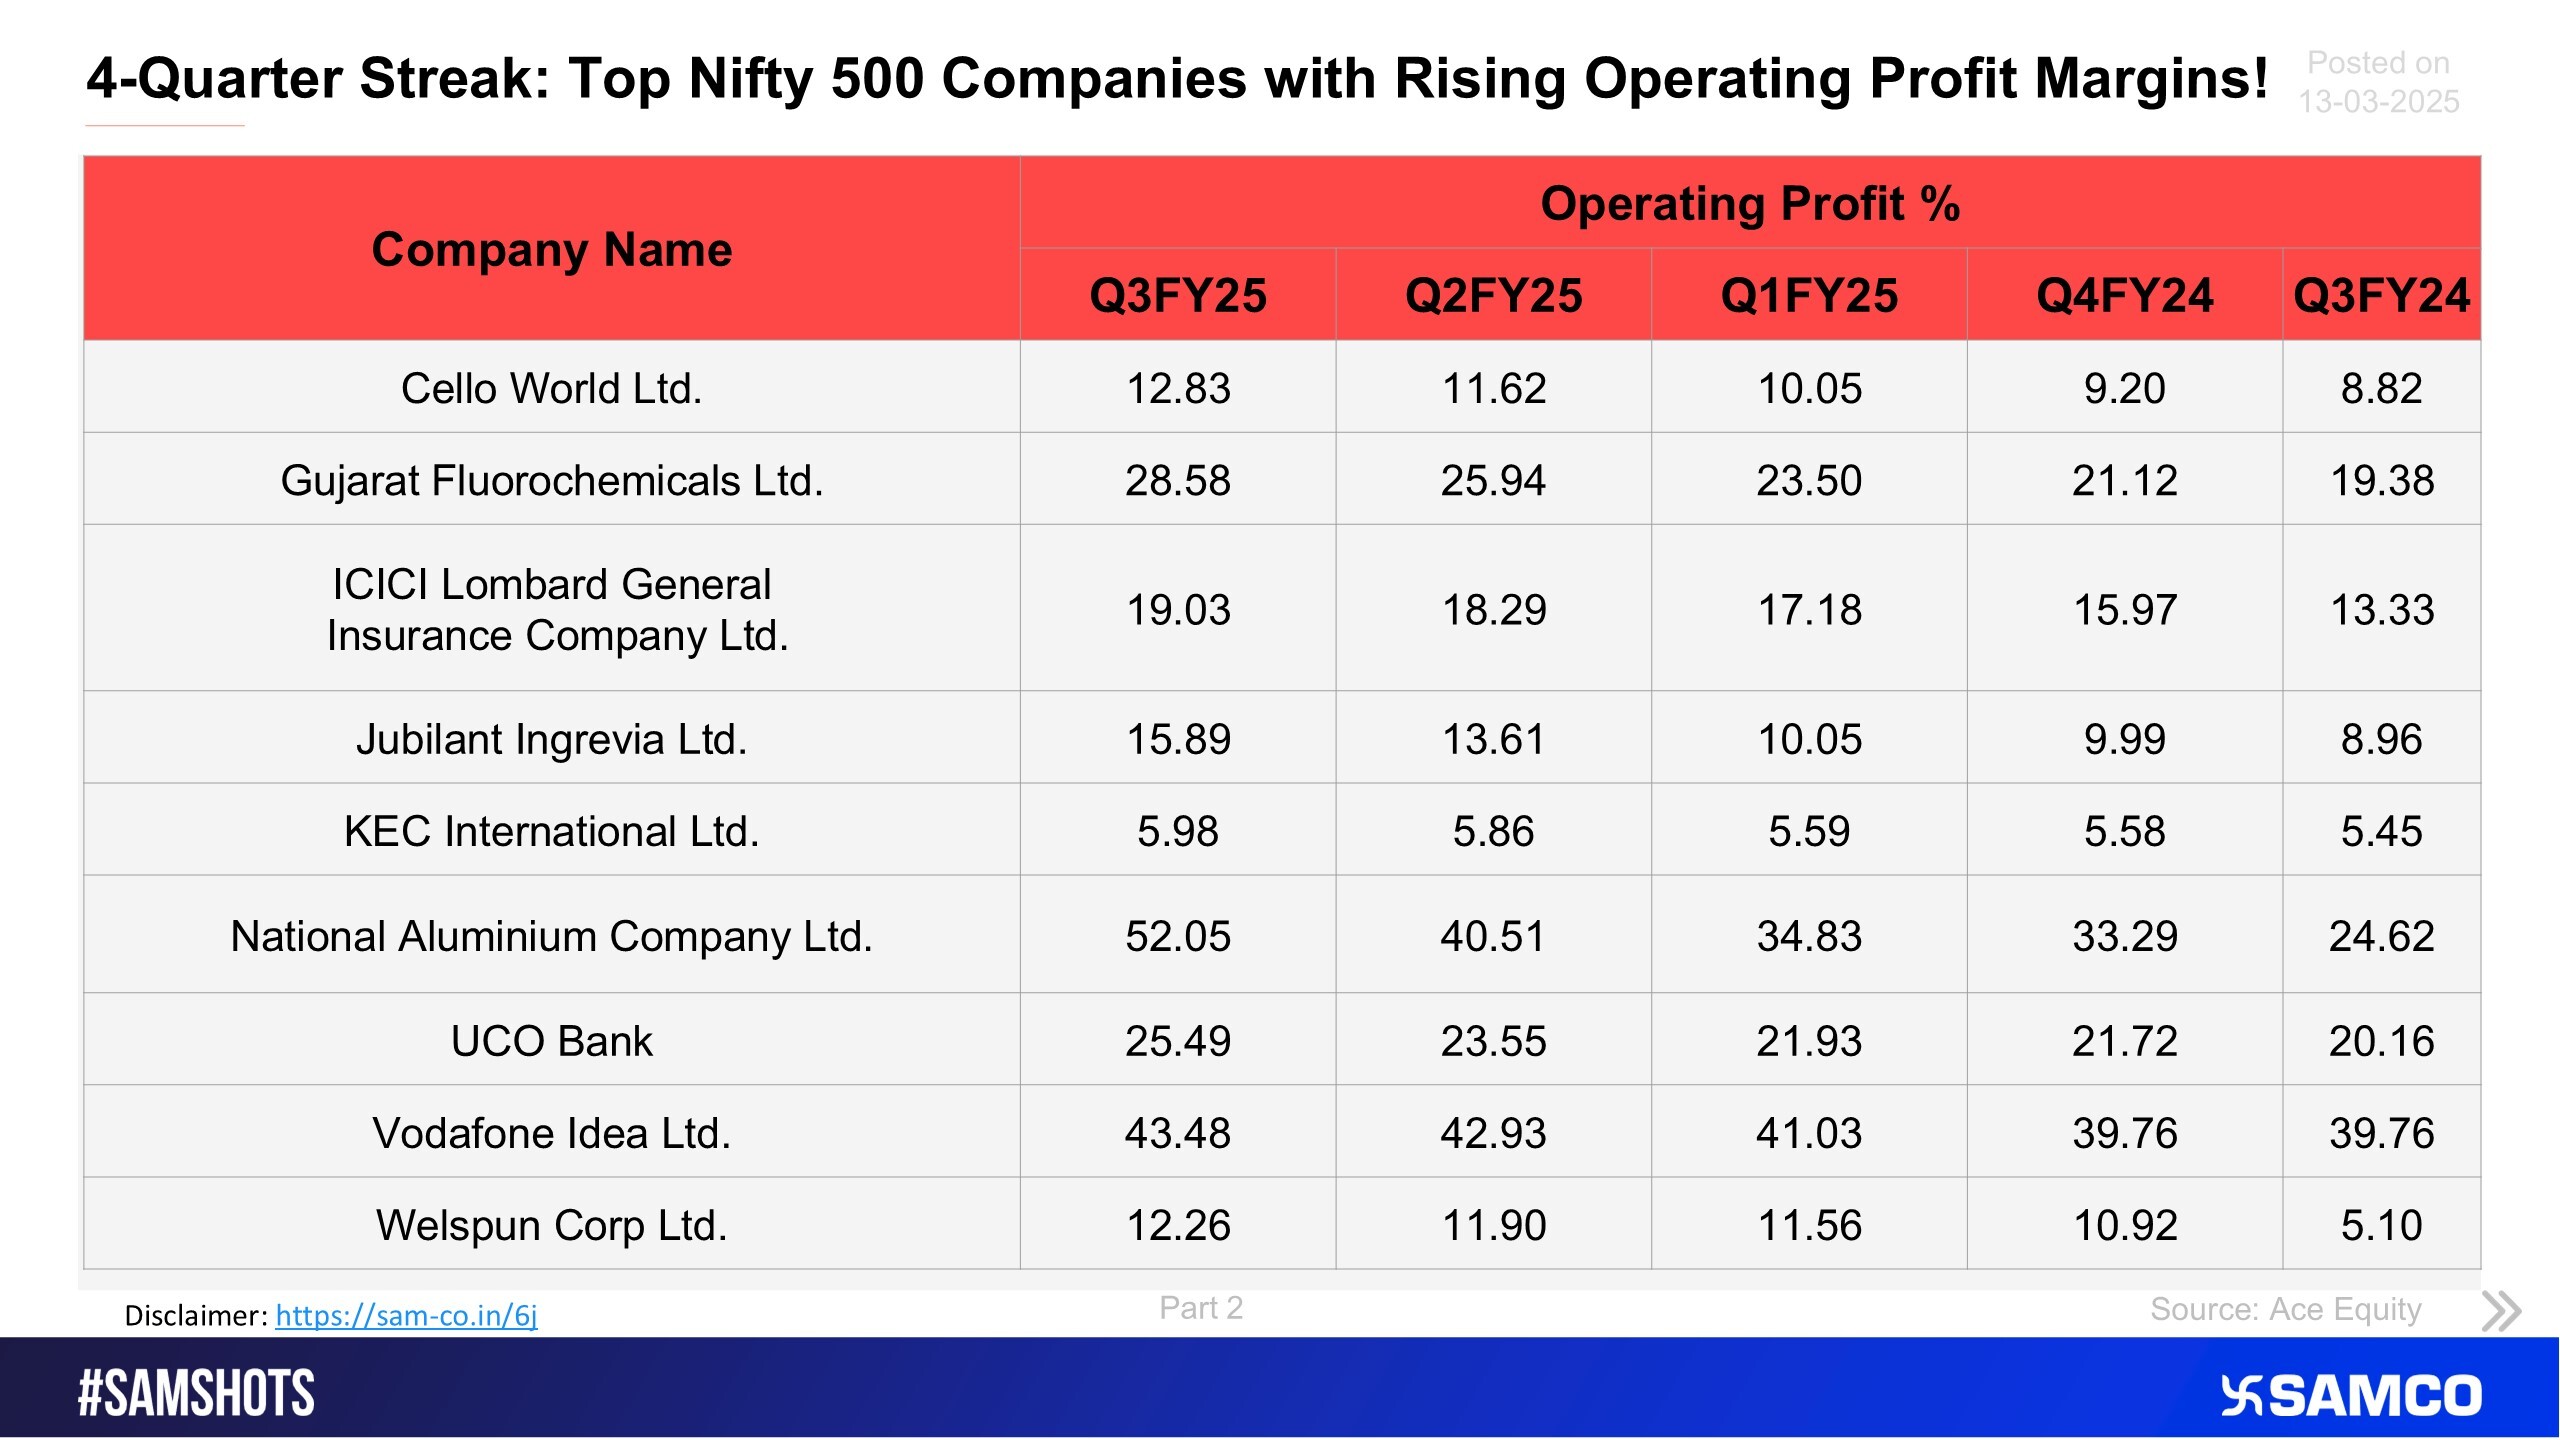
The table below presents a list of companies that have demonstrated an increasing operating profit margin over the past four quarters.
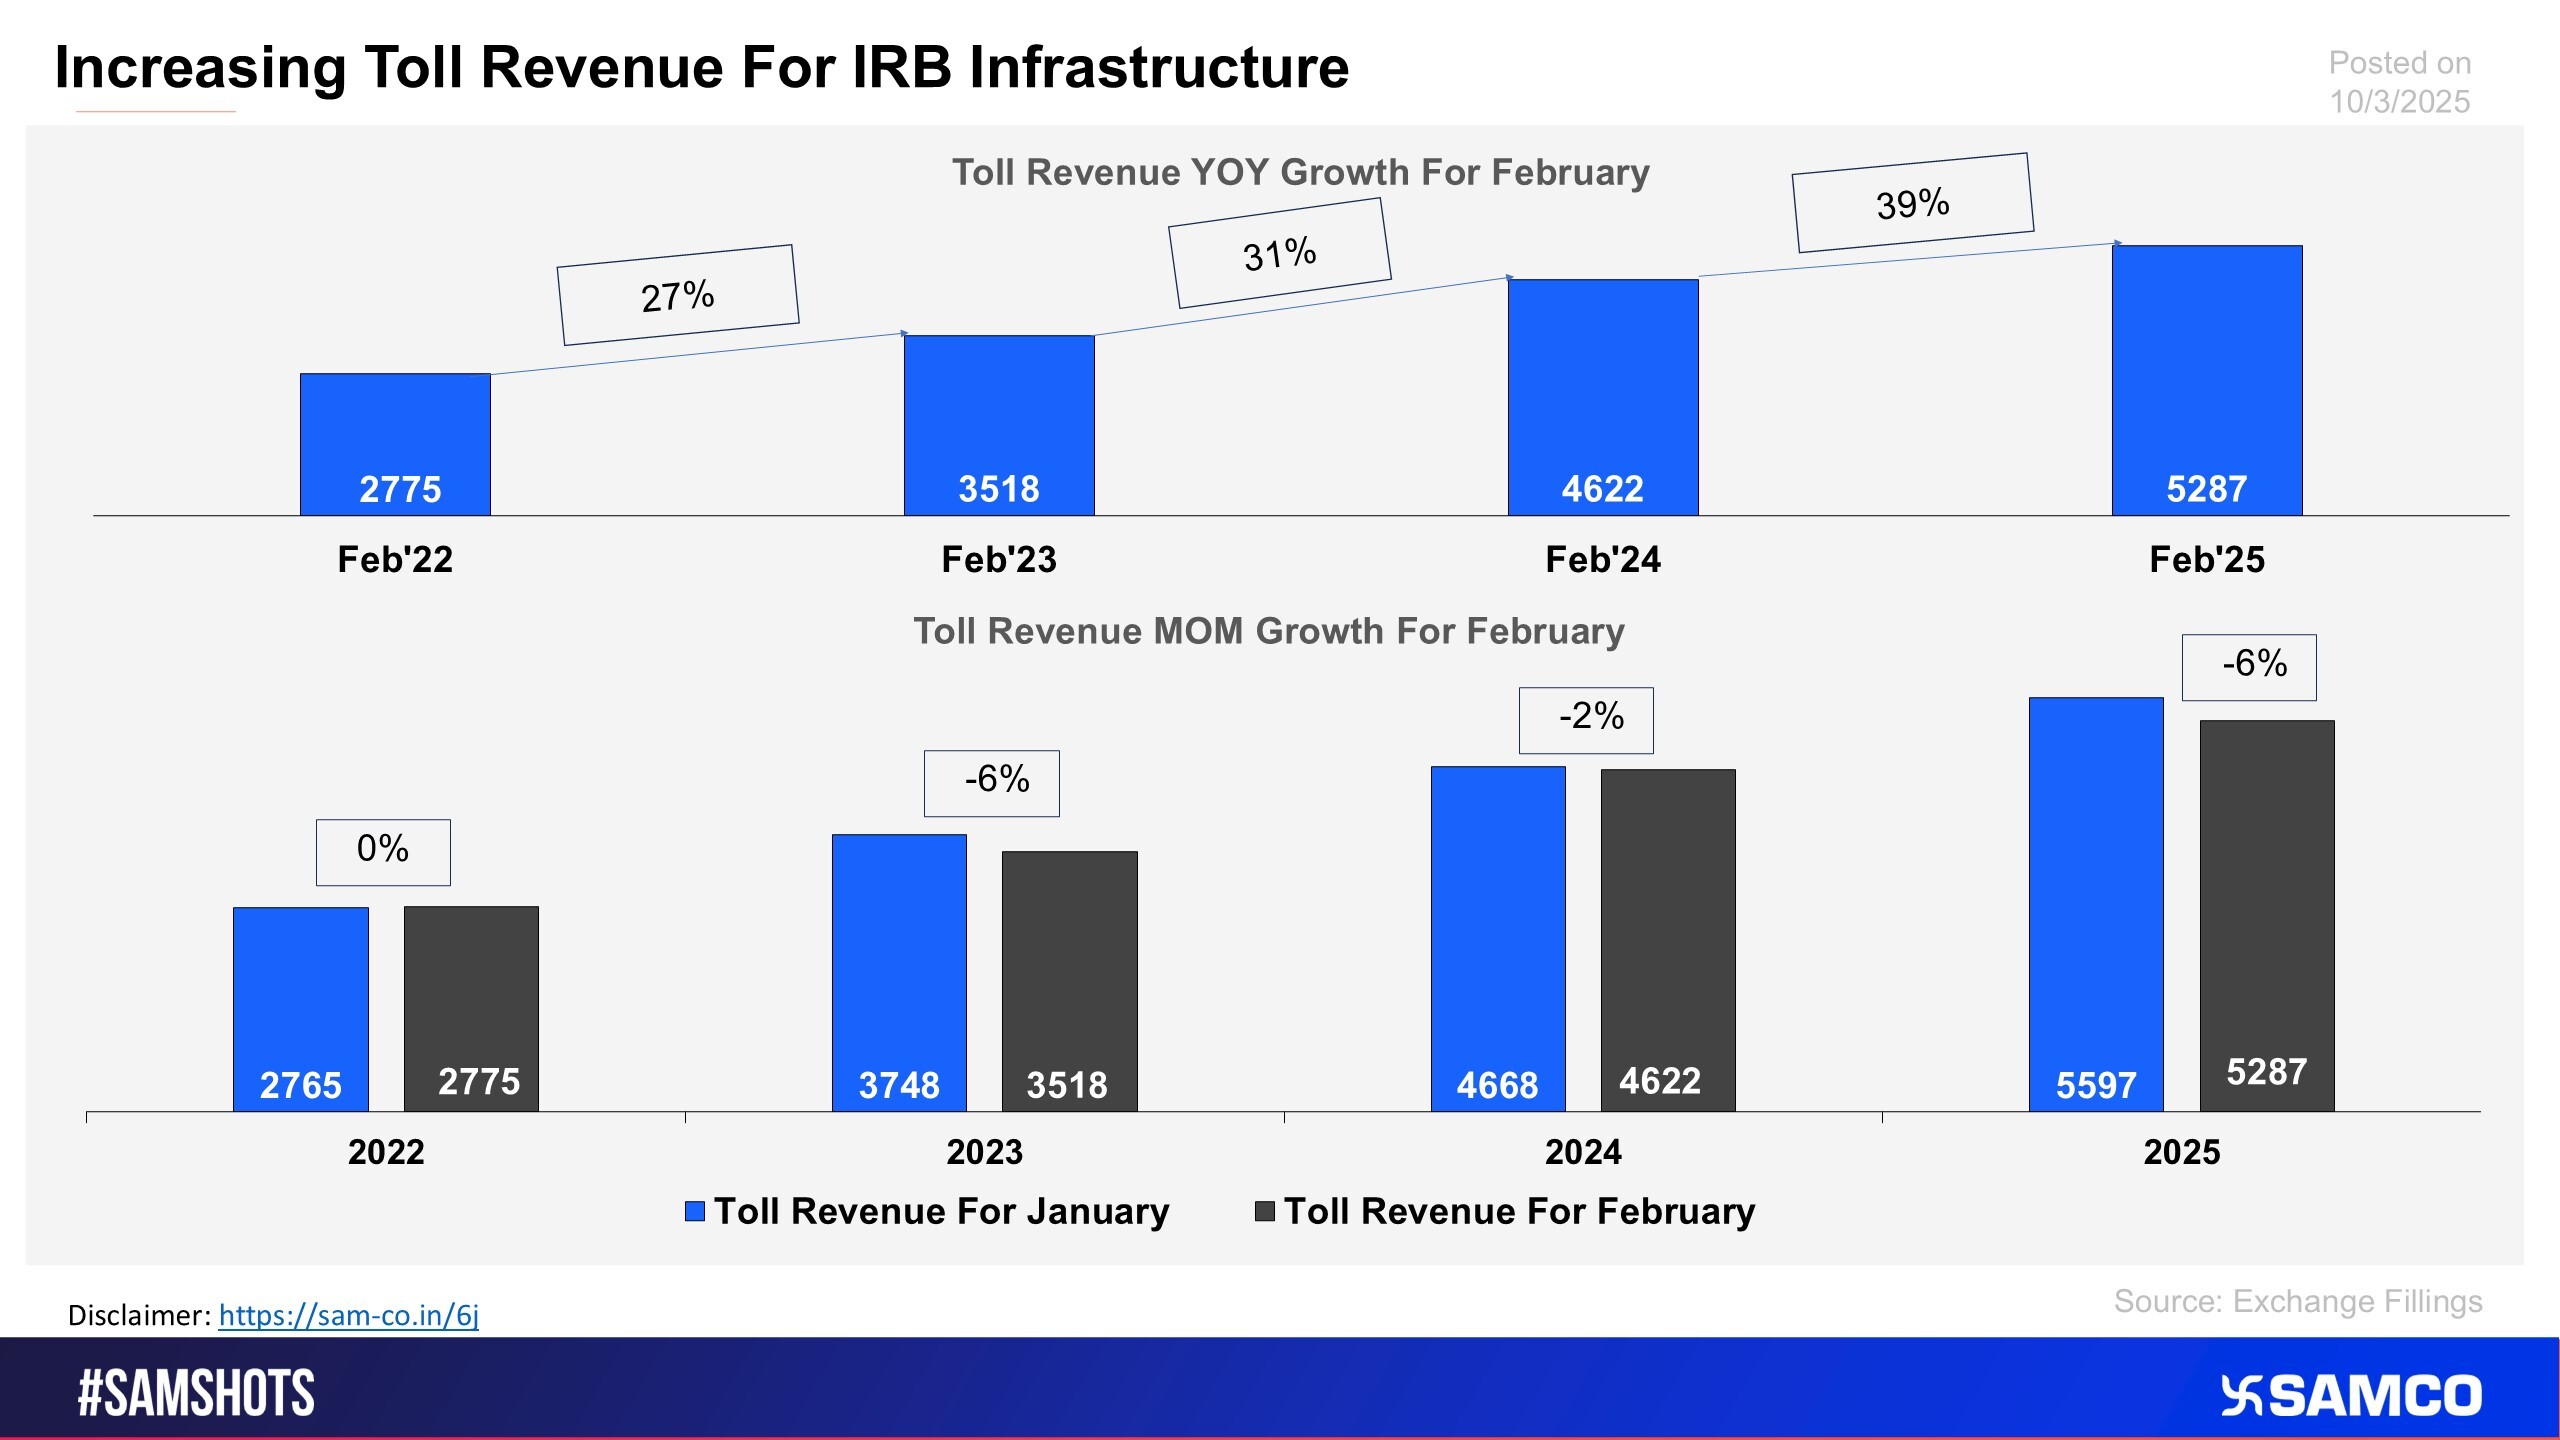
The chart displays the toll revenue growth for IRB in February.
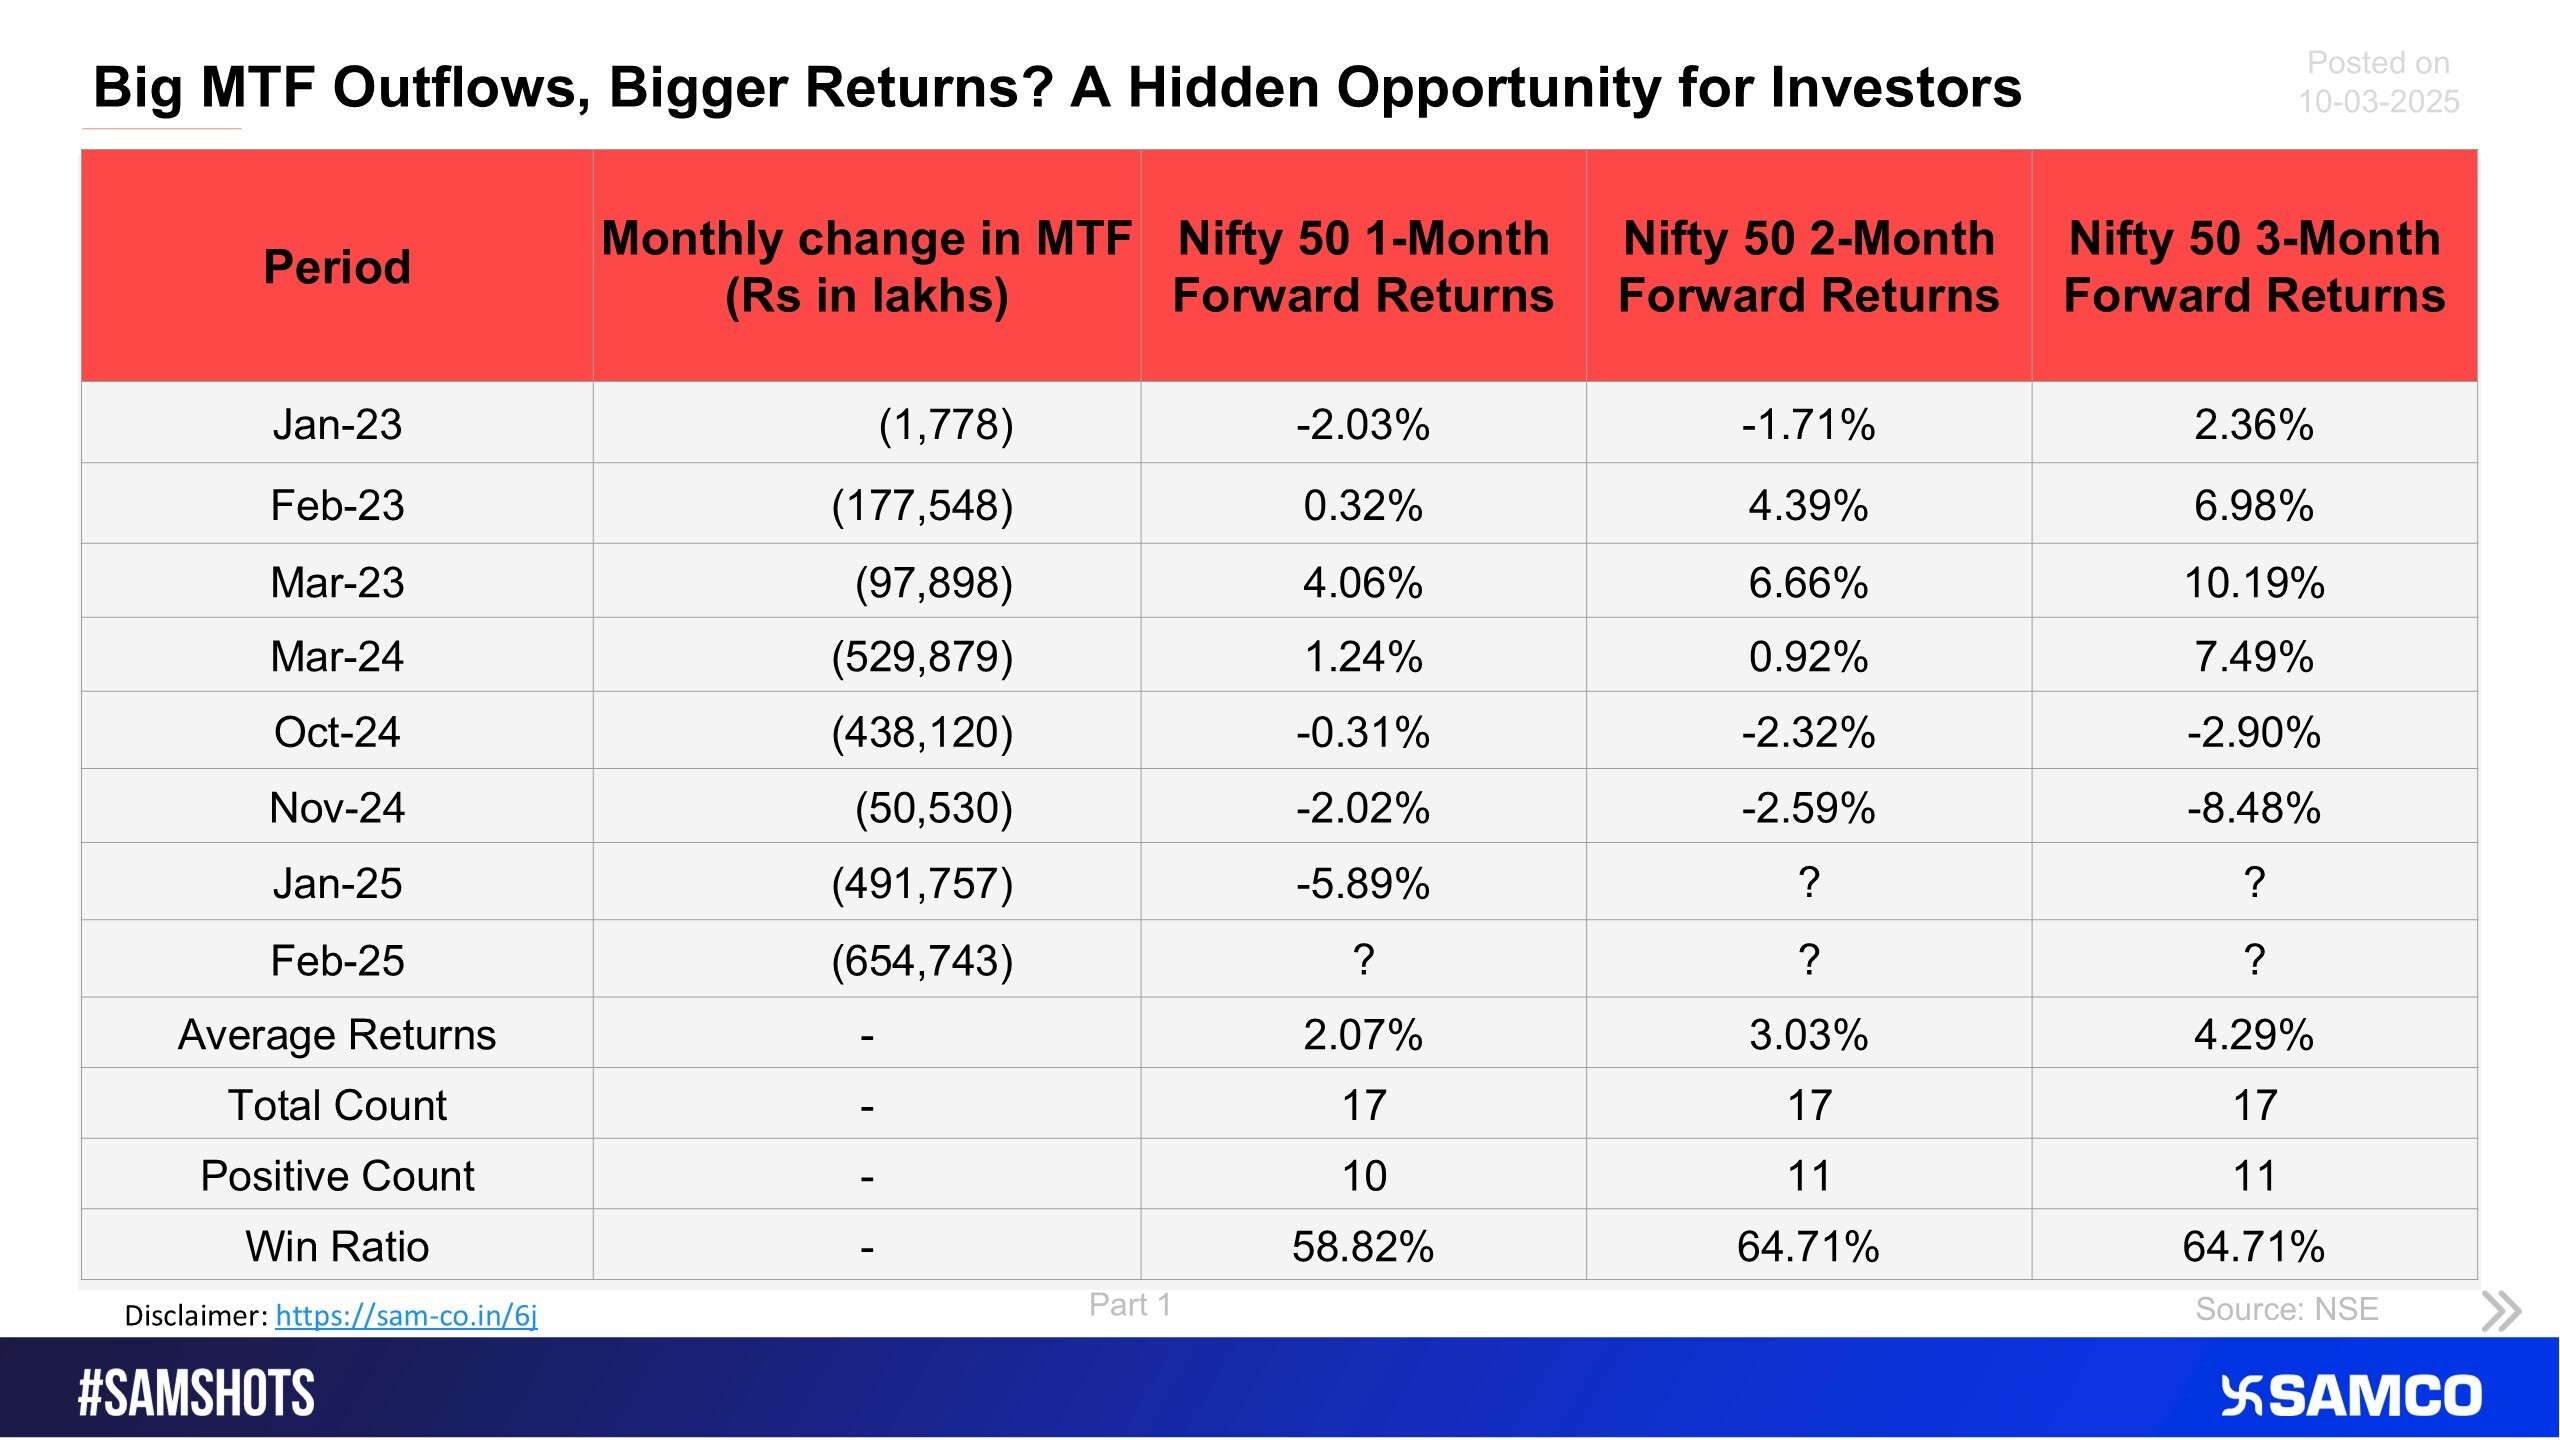
Here’s the list of months with negative monthly data for the marginal trading fund, along with the Nifty 50 index’s forward returns (Part 1).
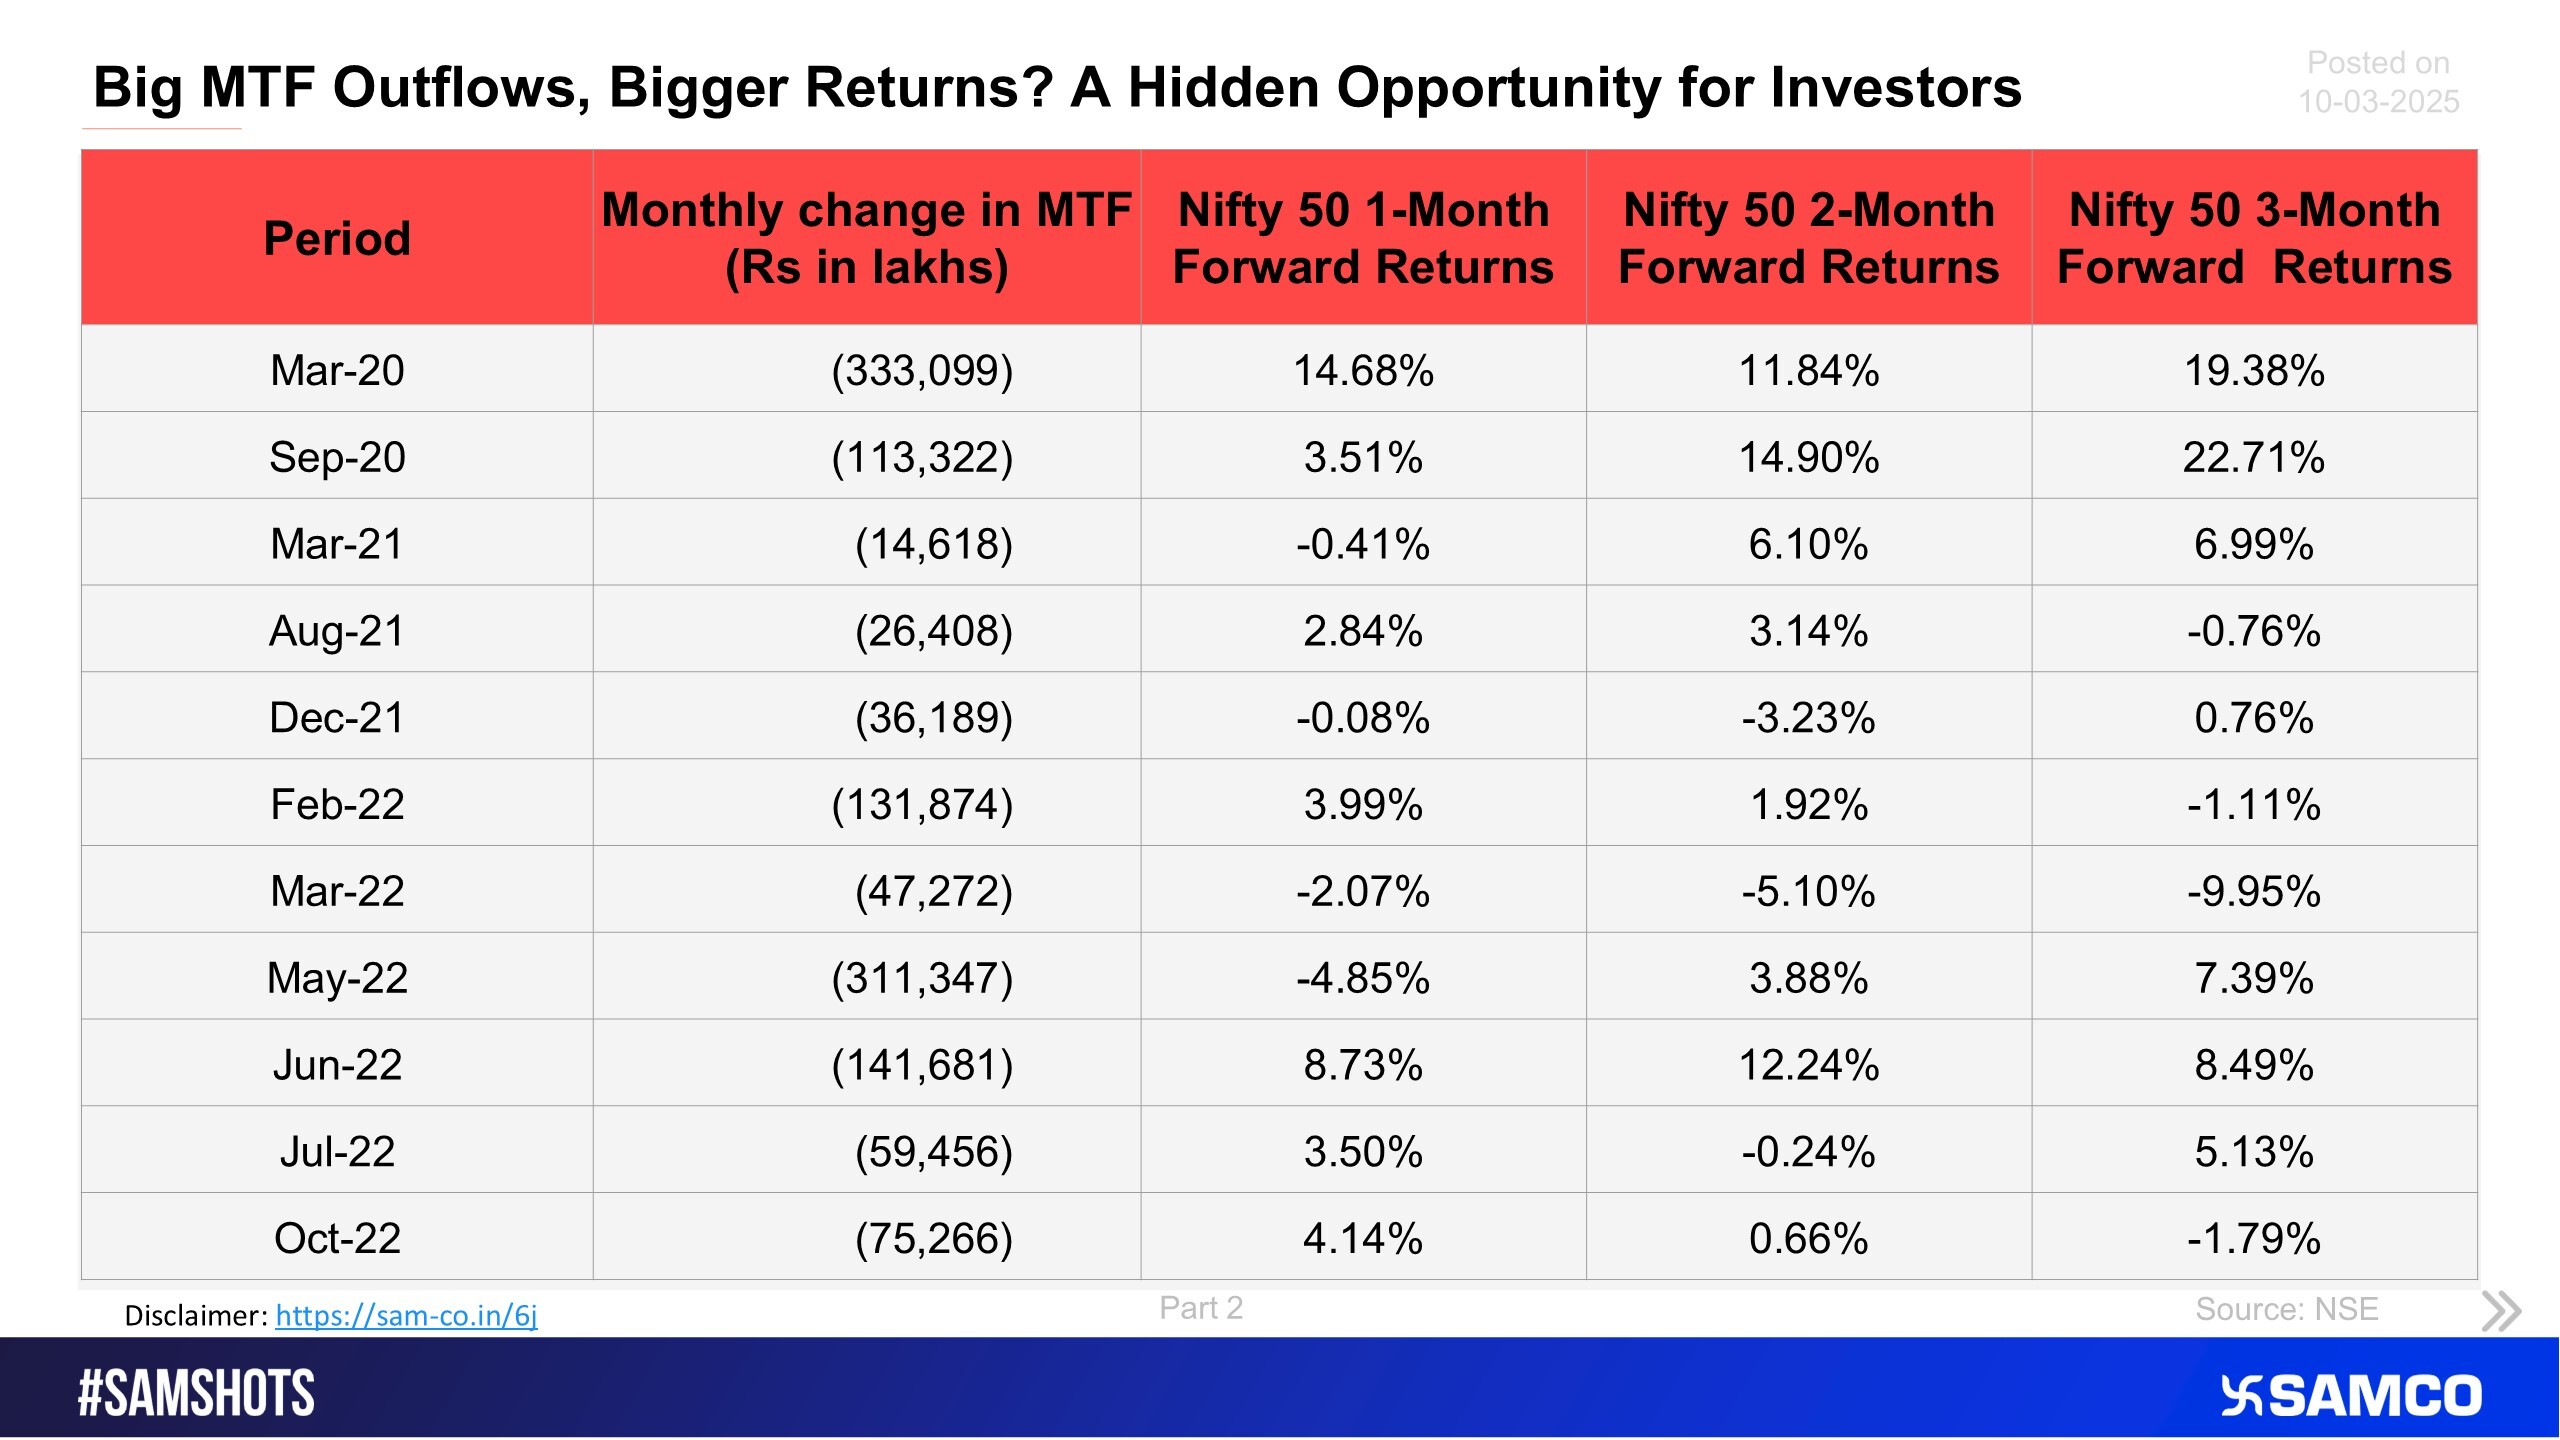
Here’s the list of months with negative monthly data for the marginal trading fund, along with the Nifty 50 index’s forward returns (Part 2).
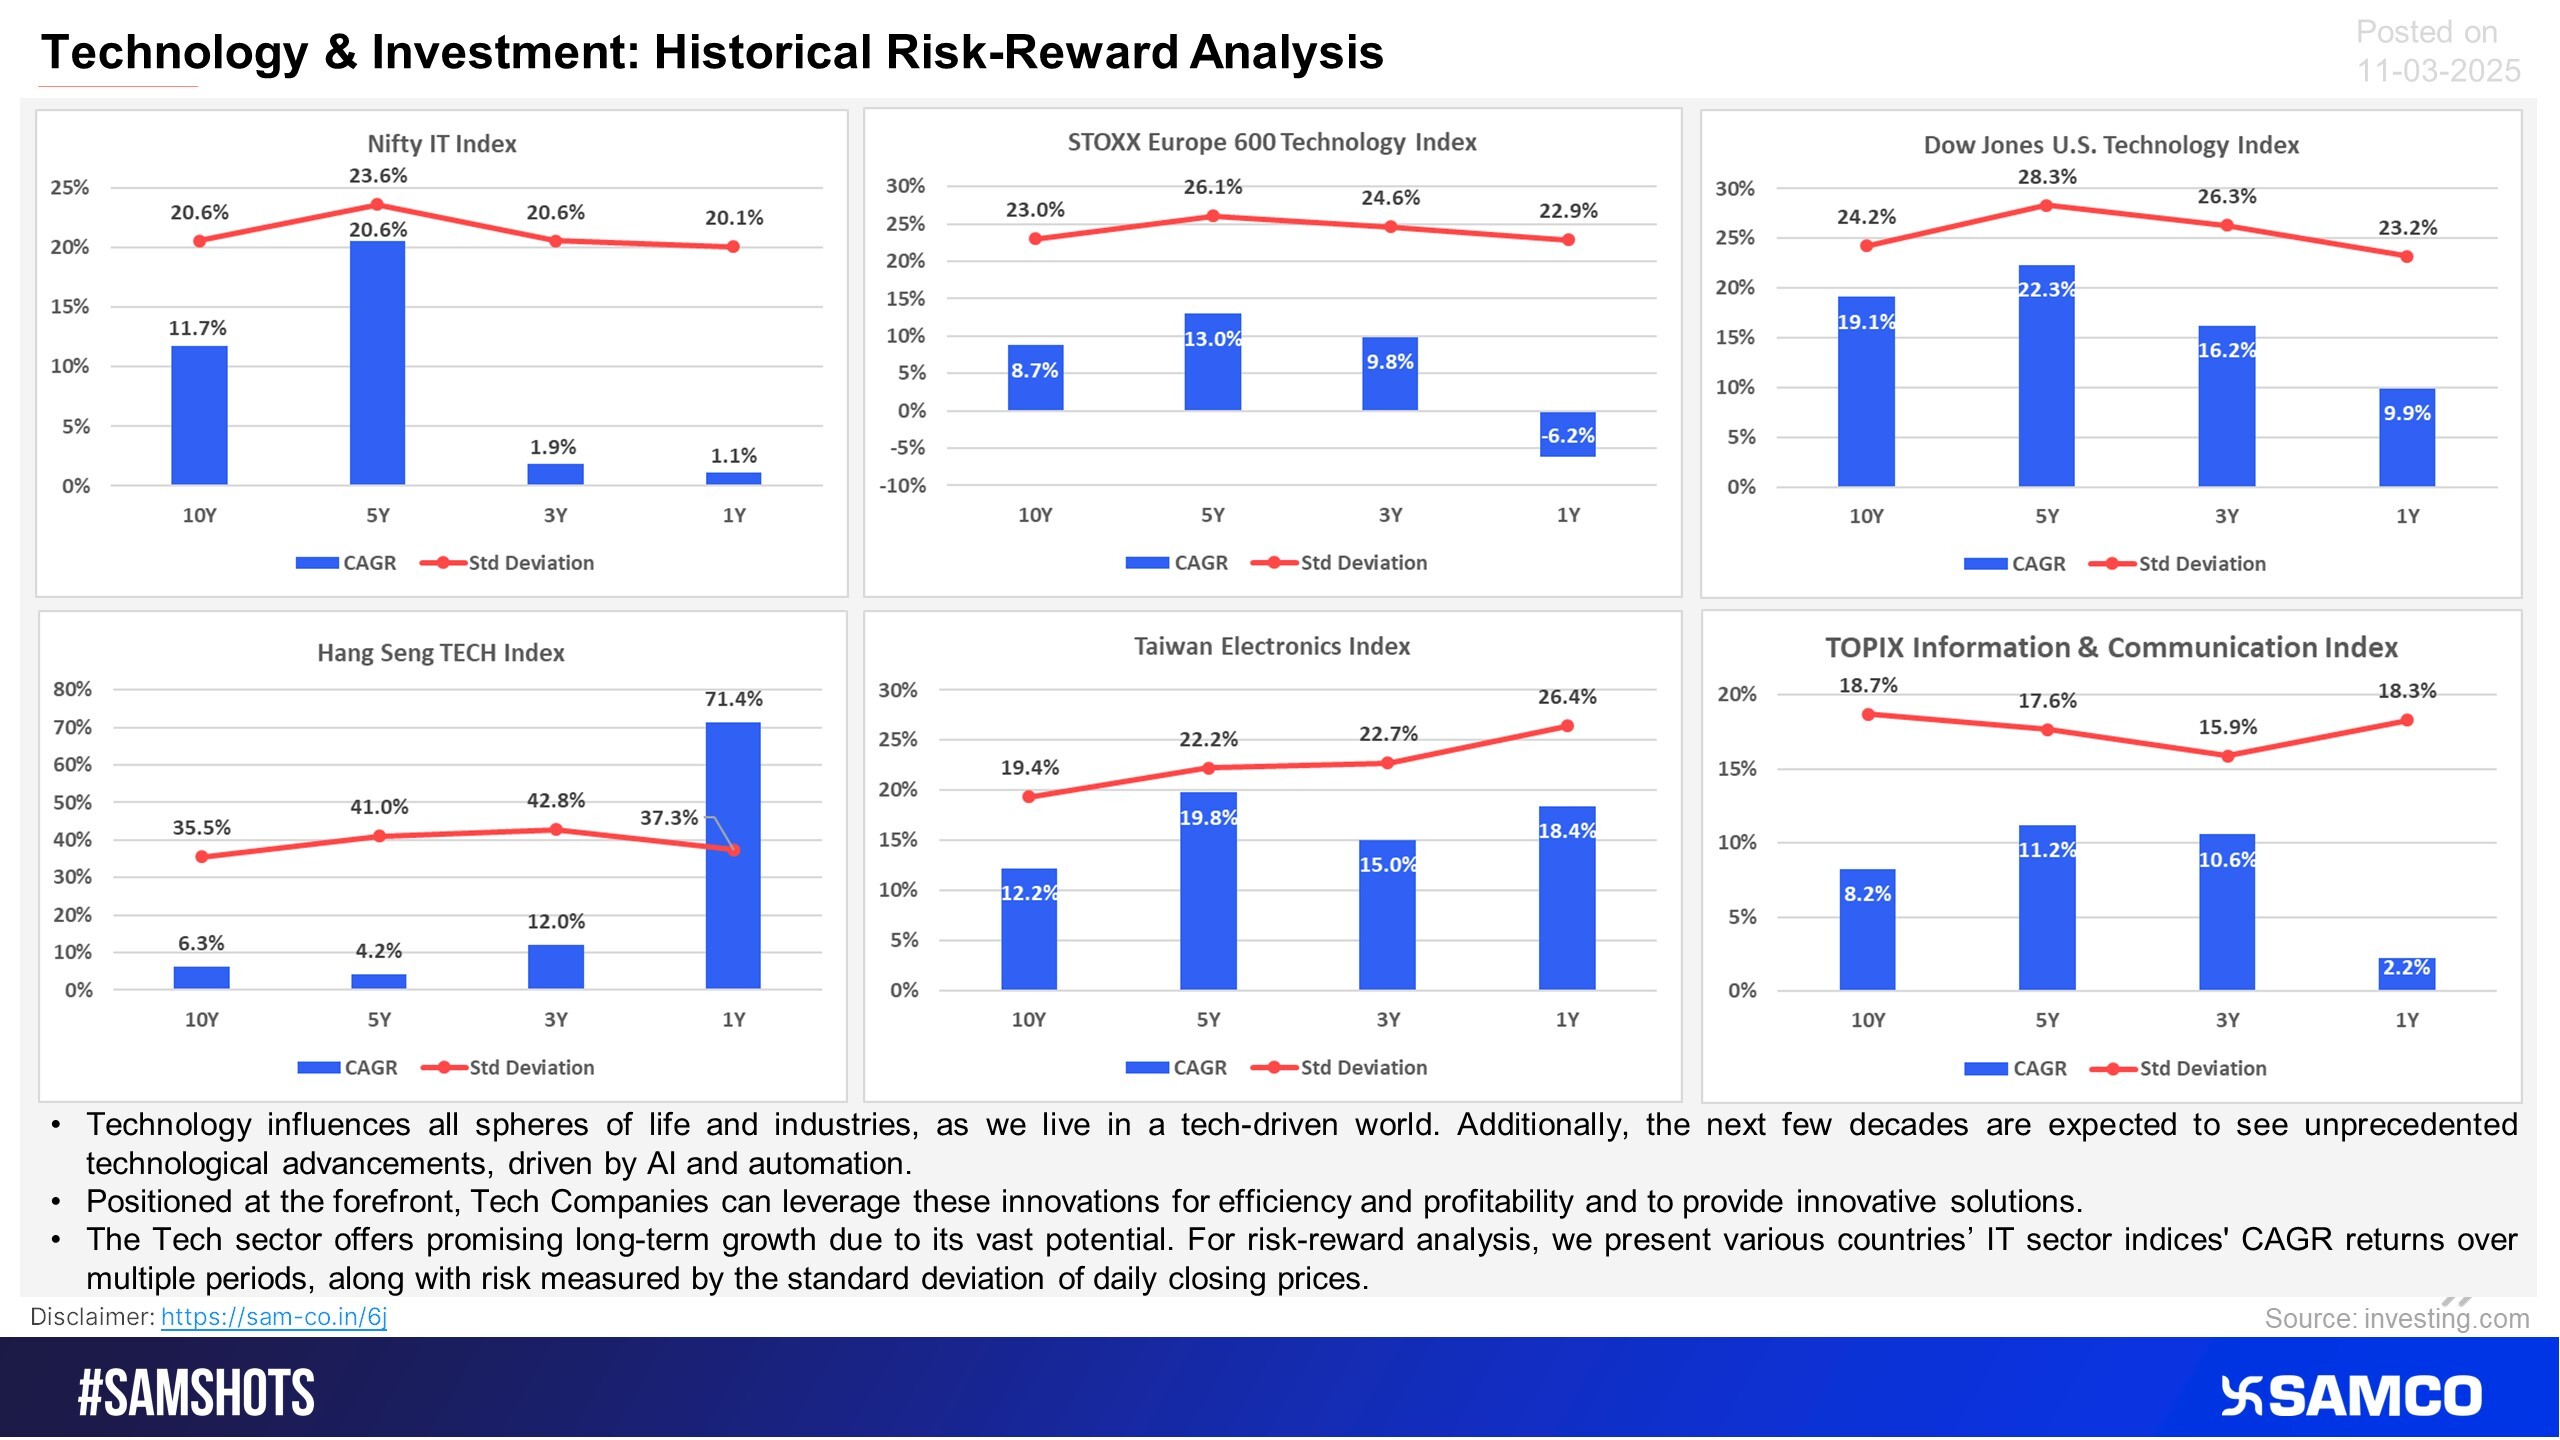
Let’s take a look at how major tech indices in different markets have performed over different periods.
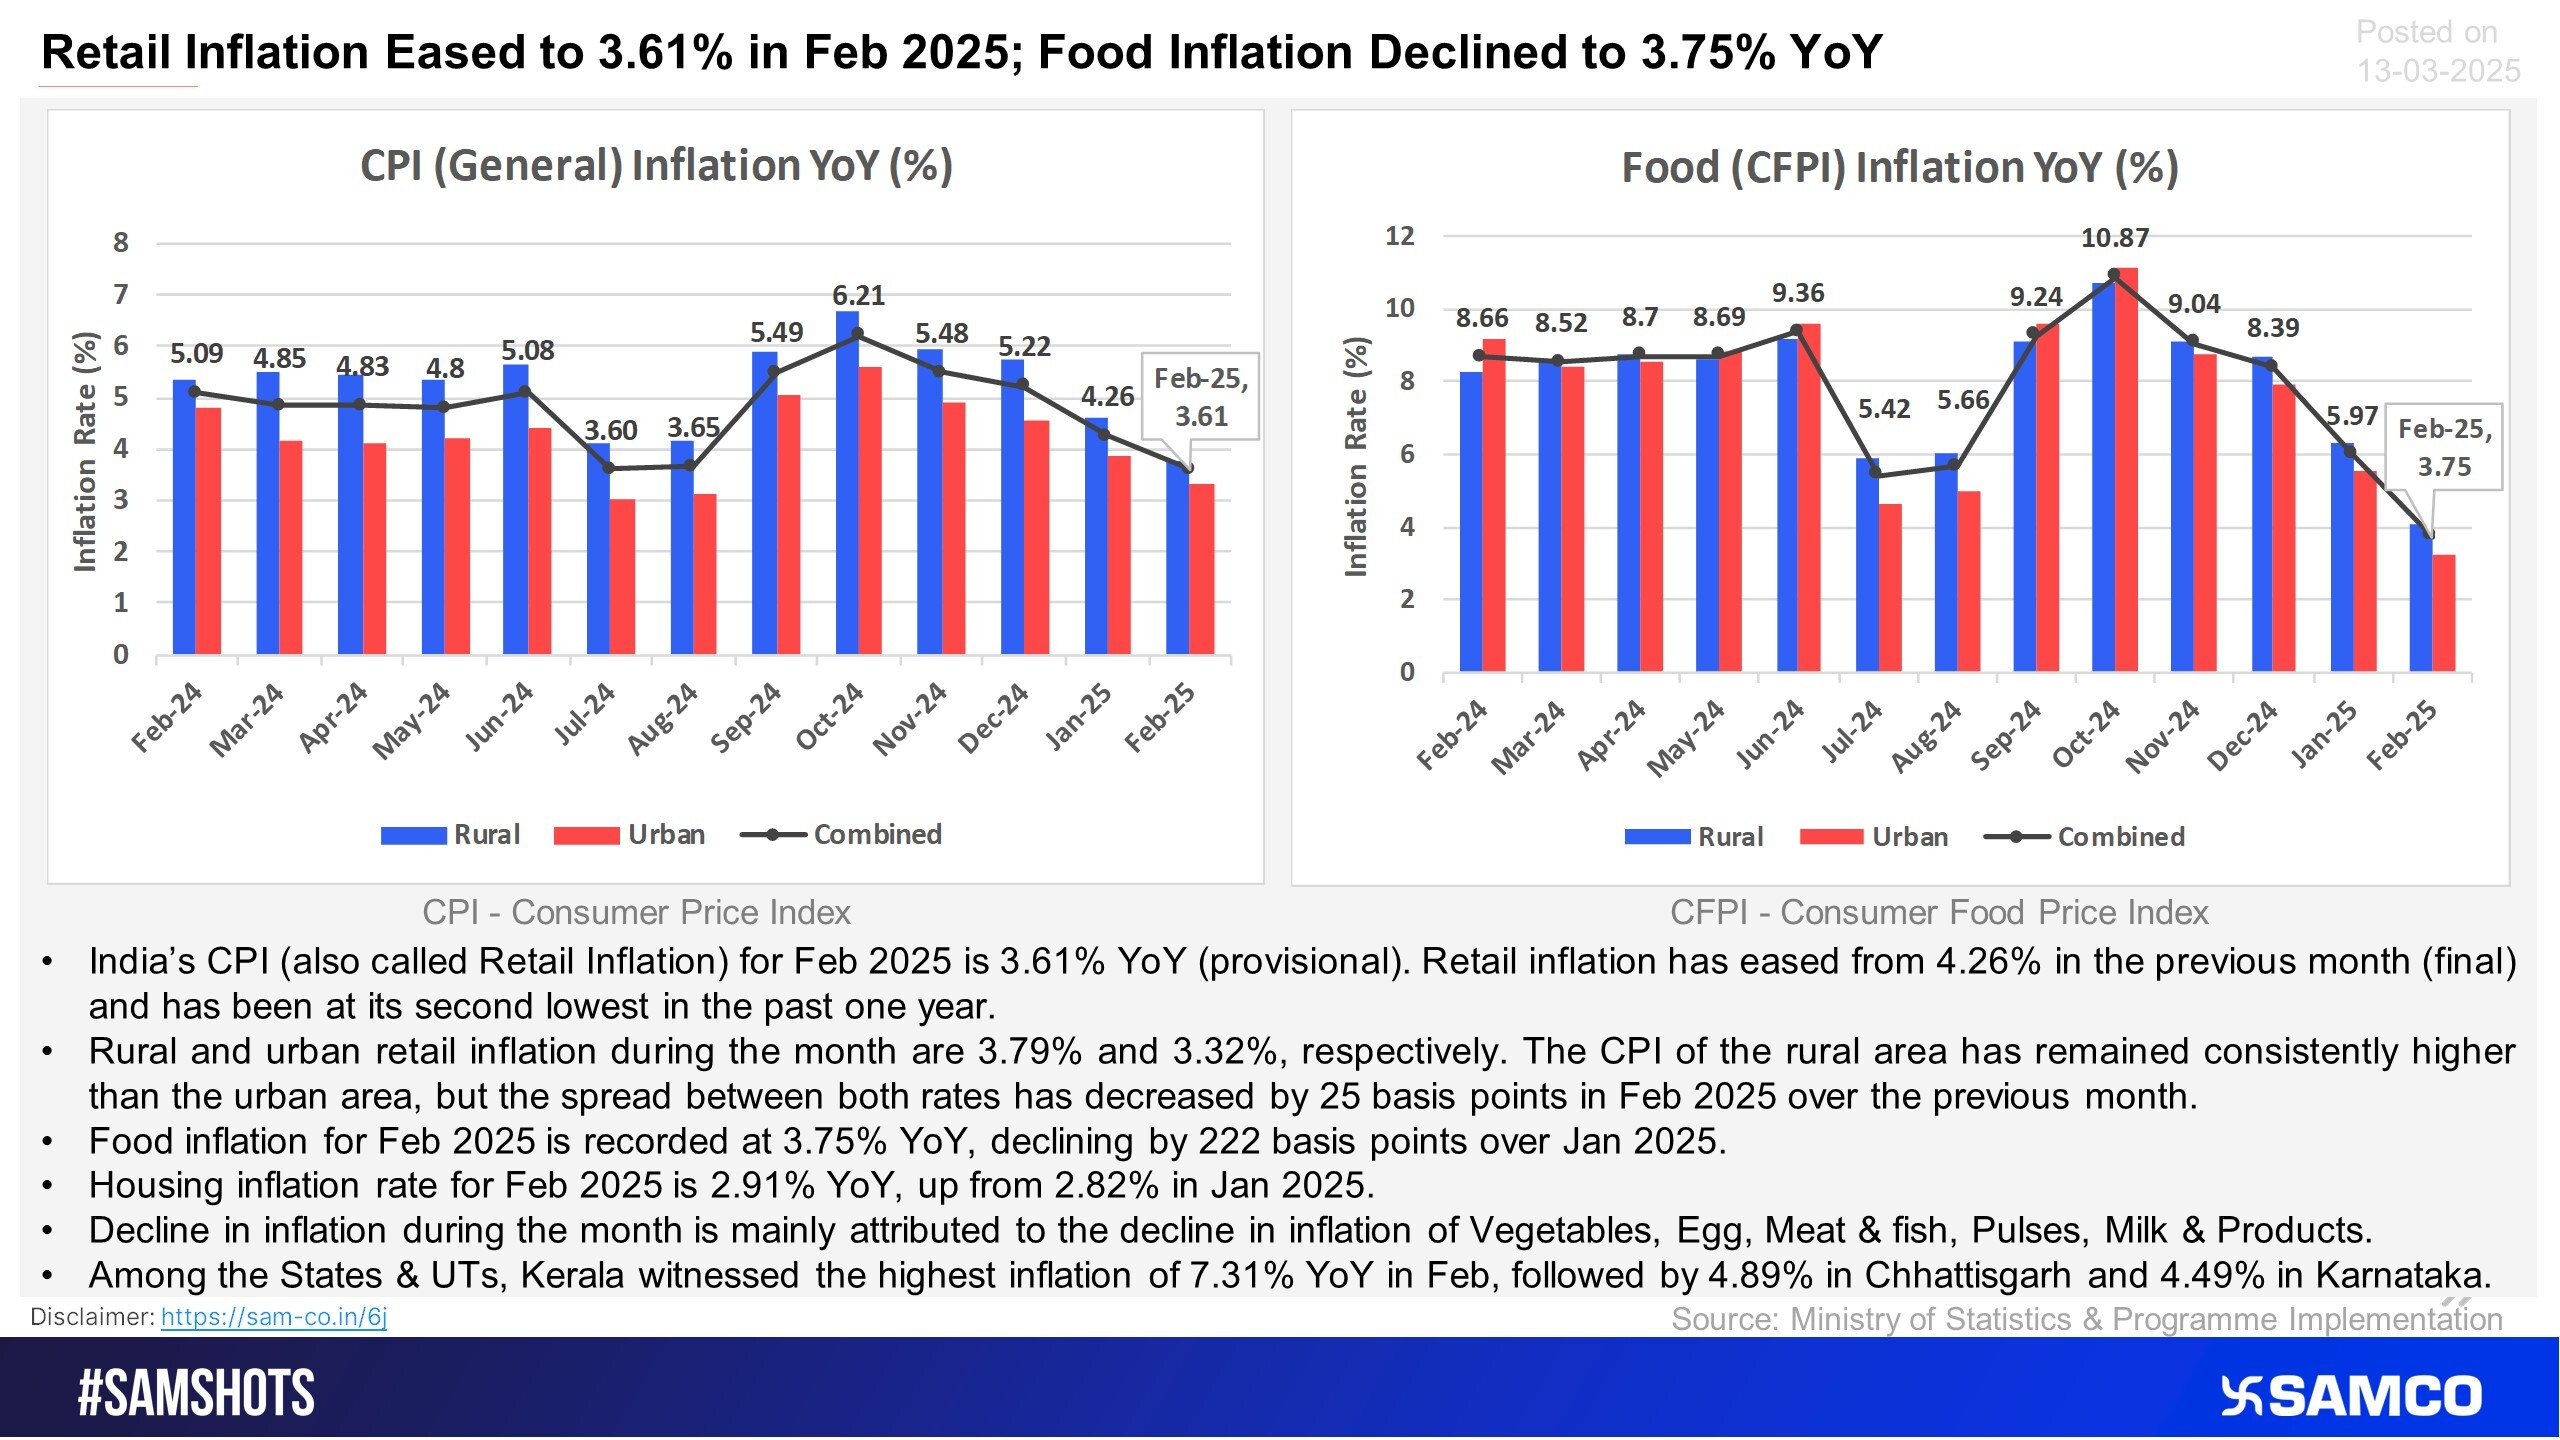
Have a look at the following chart to see how inflation trends have evolved in India.
Nifty Pharma is the only sectoral index to close in the green this week; IT and Microcap indices were the worst hit.
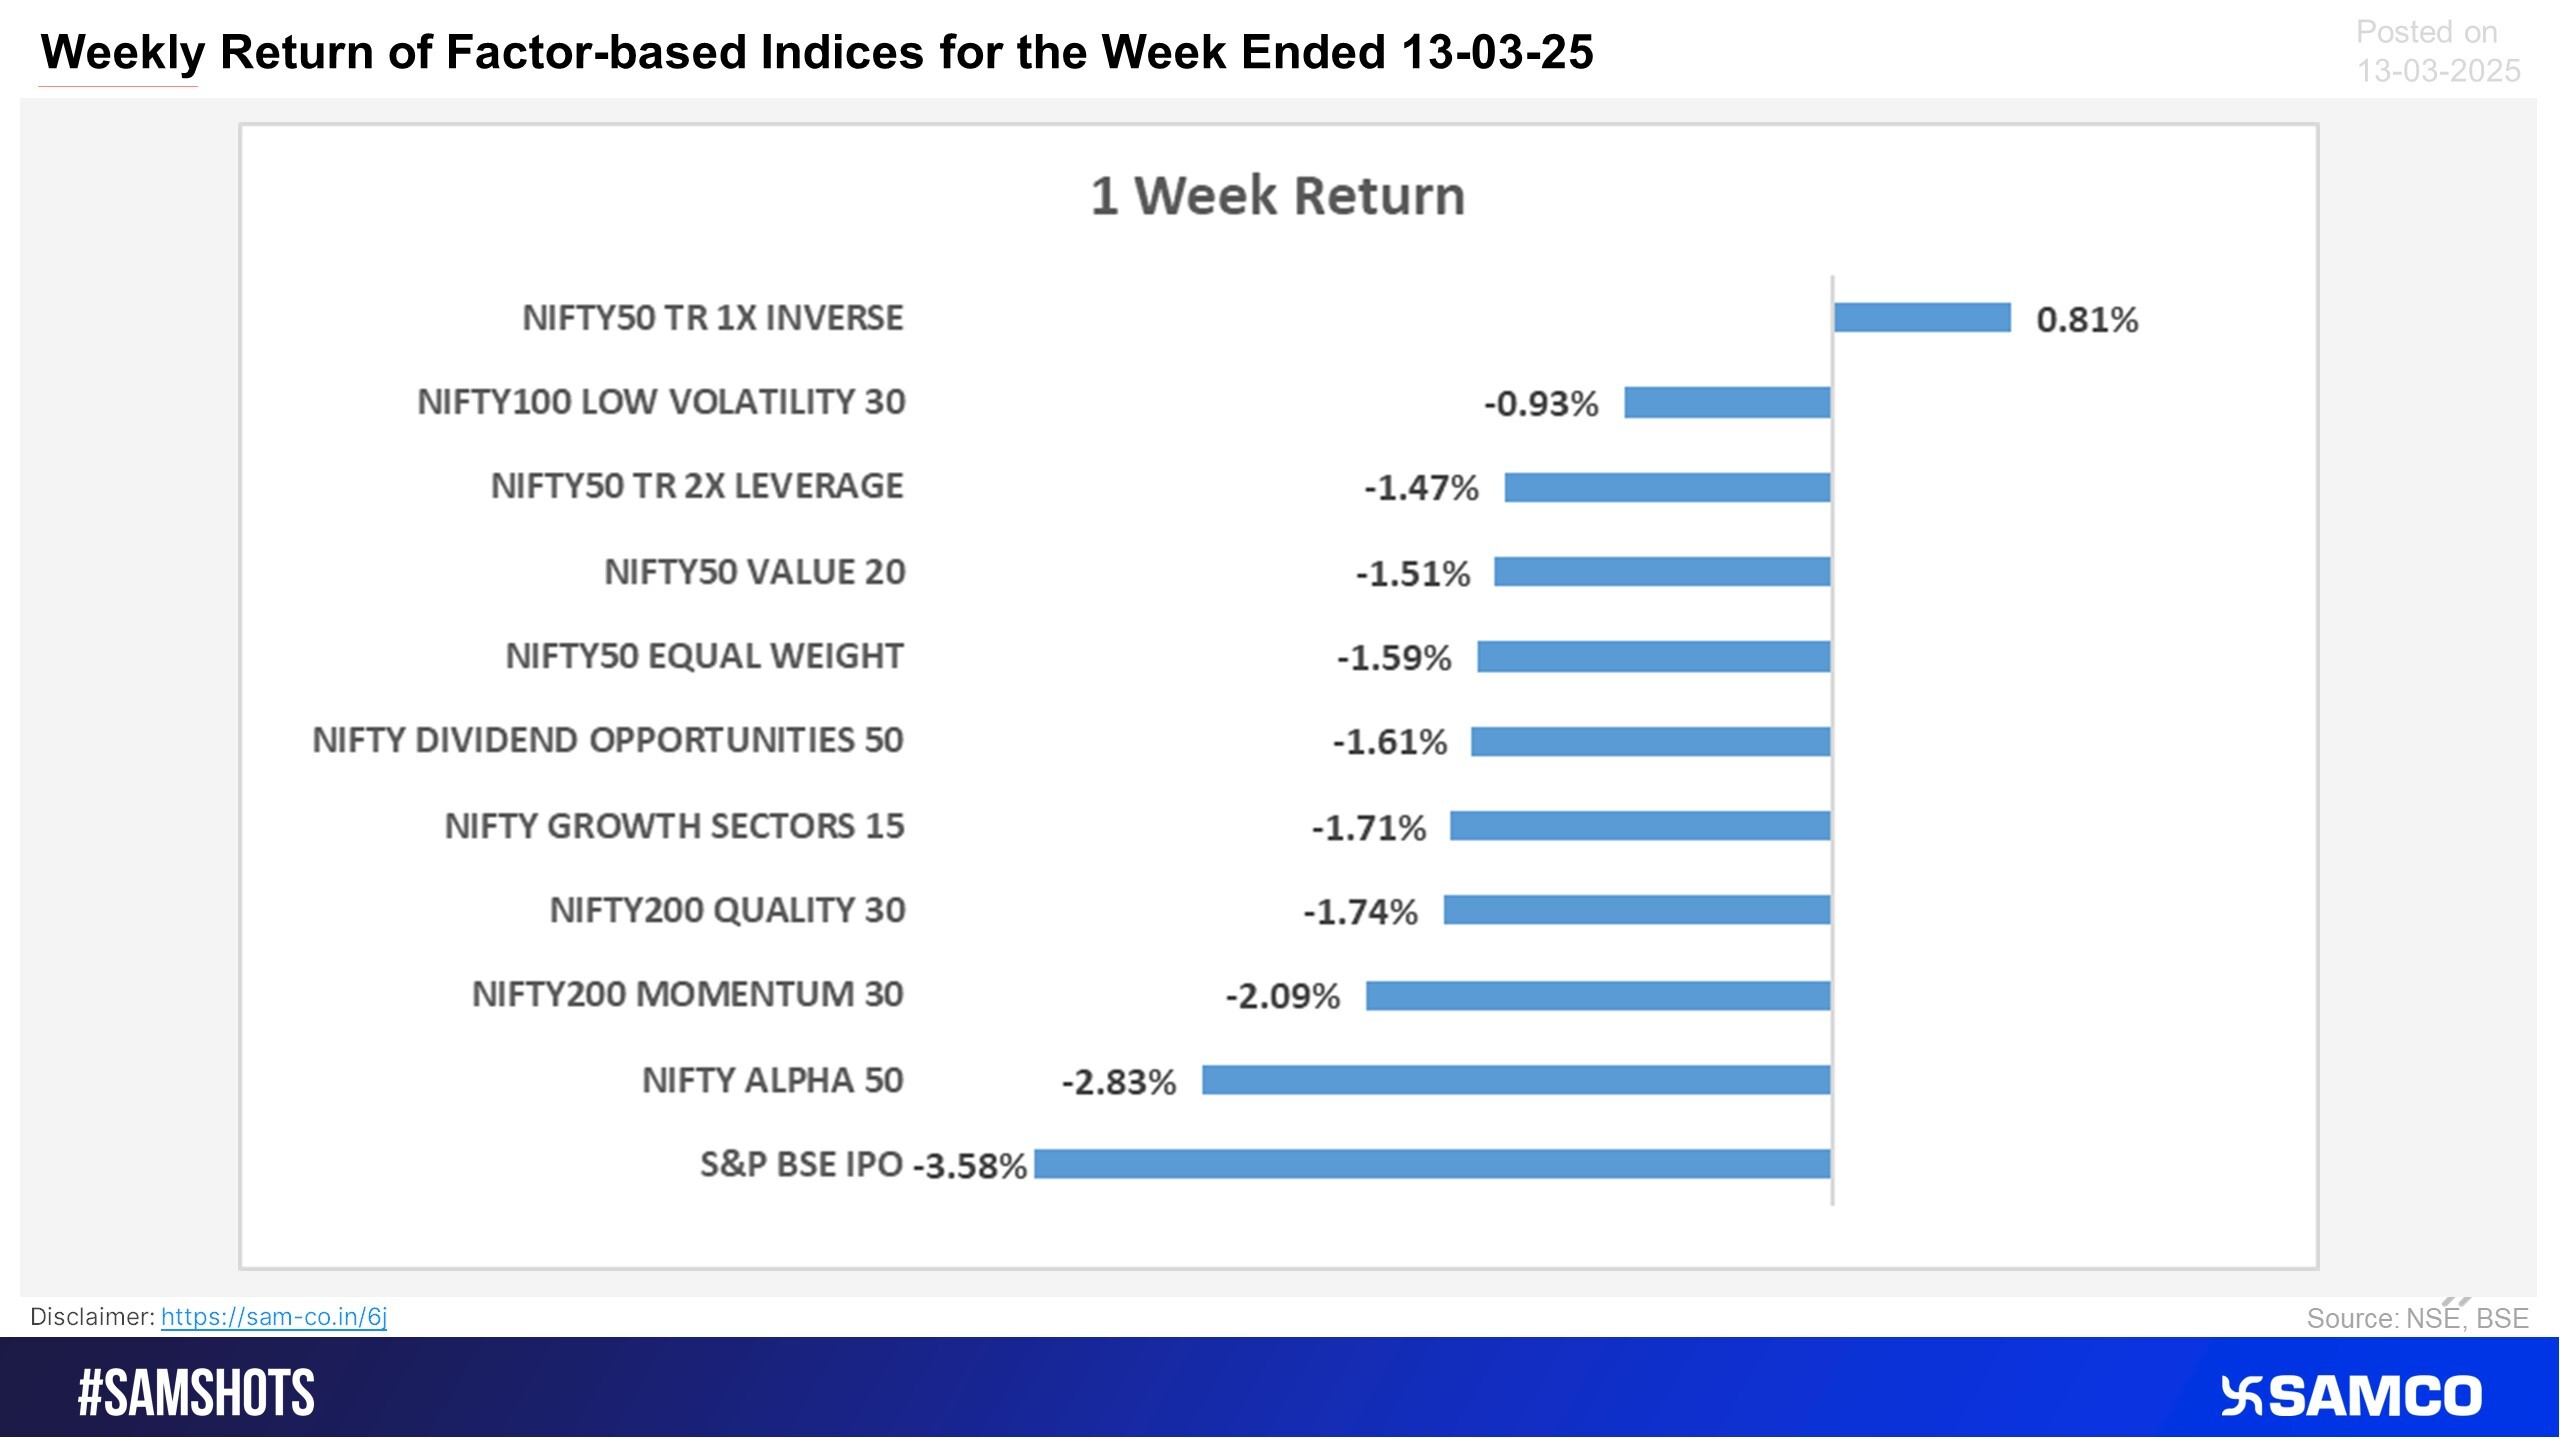
As the broader market saw a downfall this week, except the inverse strategy, other factor based strategy indices have declined.
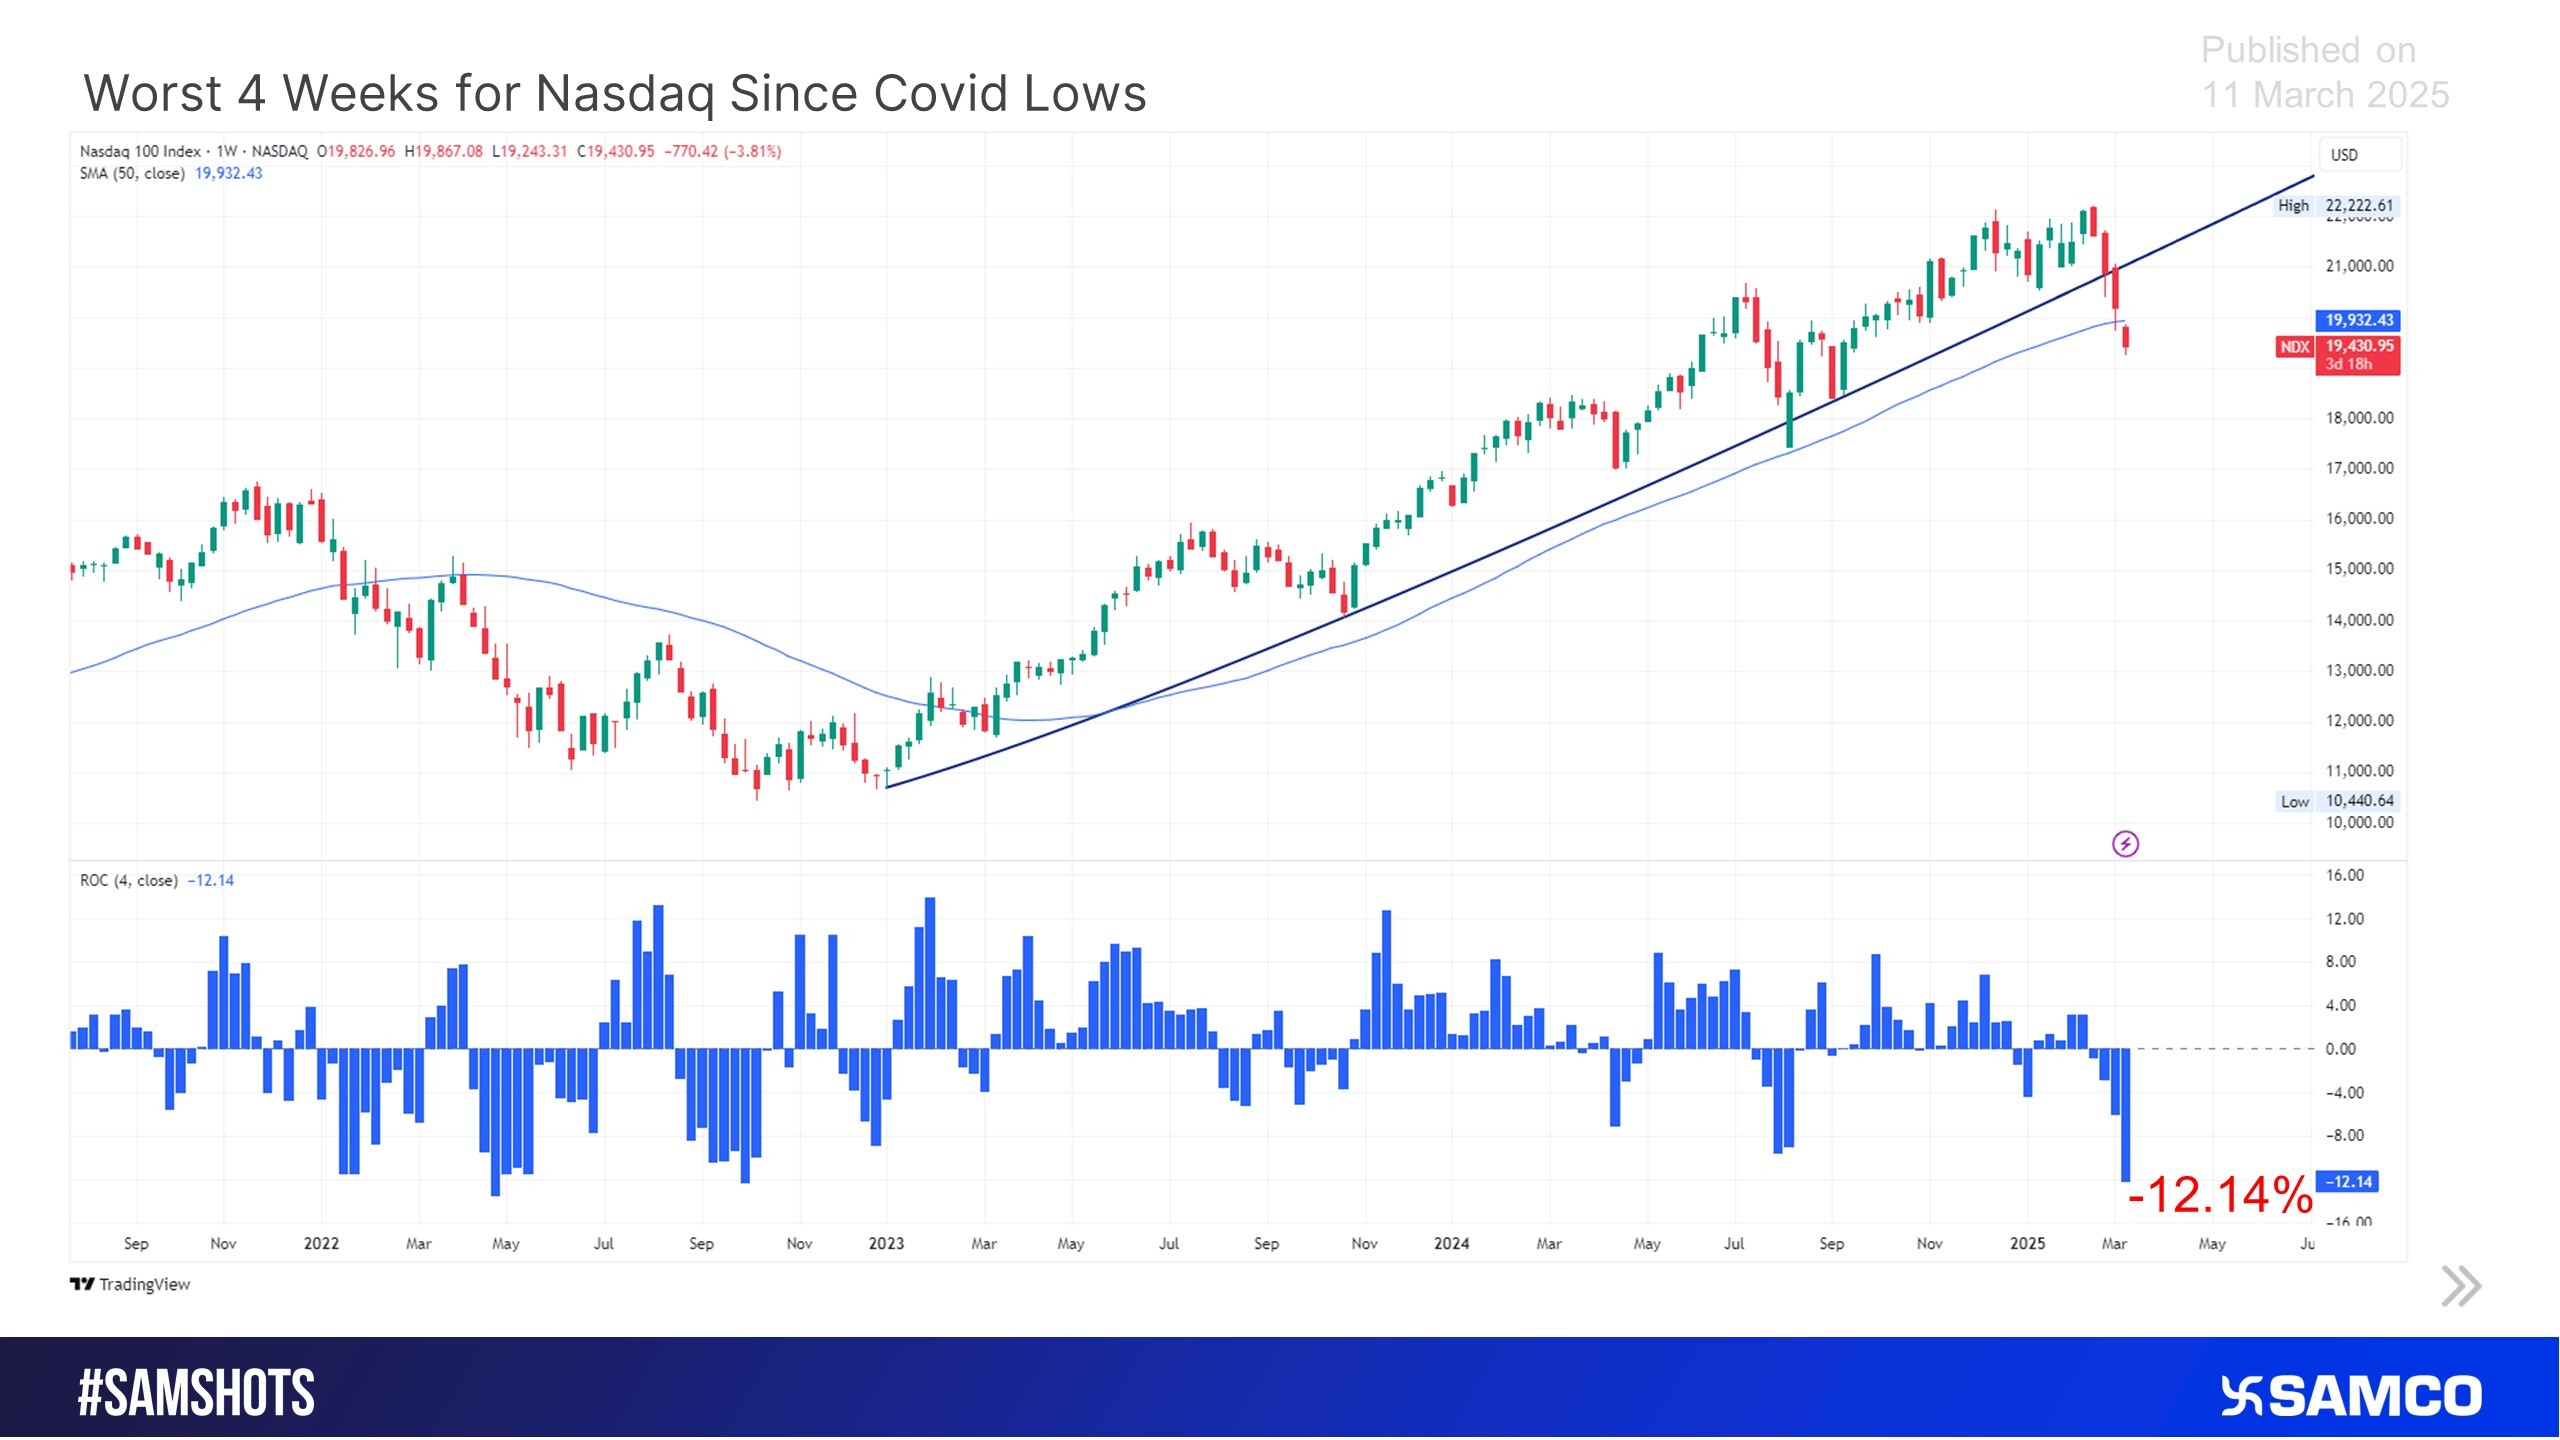
The below chart displays that Nasdaq has witnessed the worst 4 weeks since covid lows.
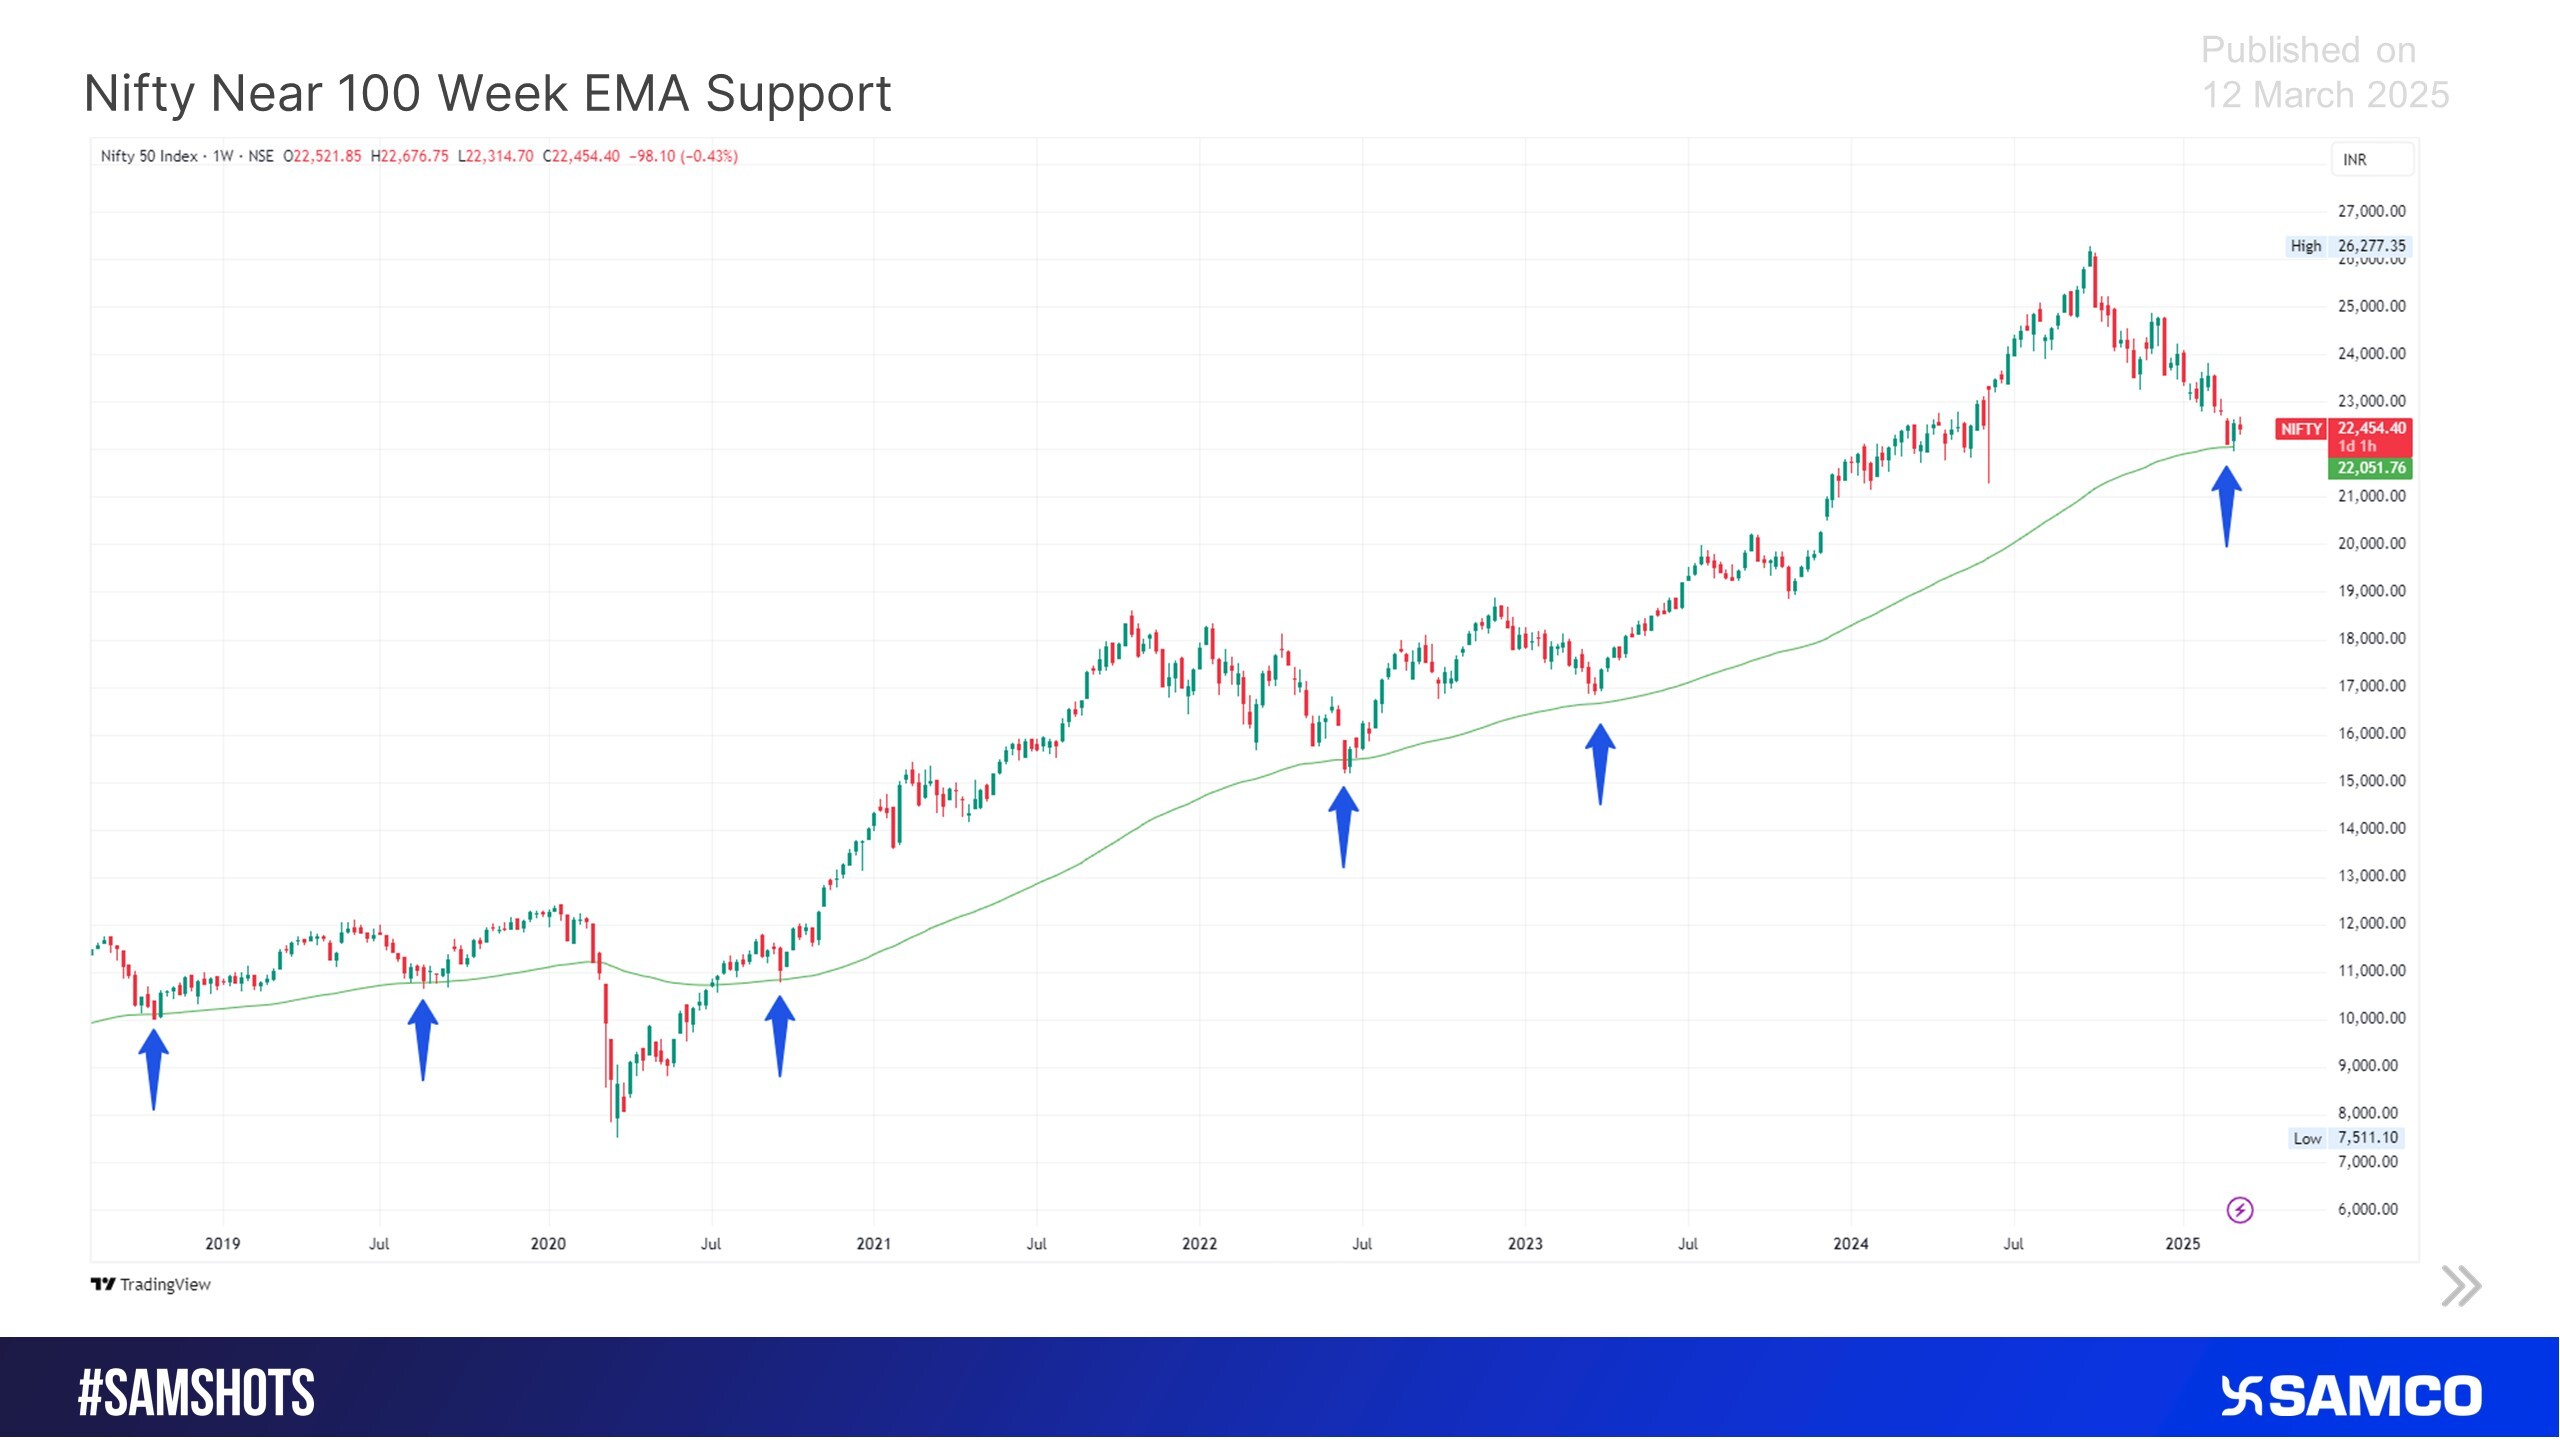
Over the last 6 years Nifty has reportedly found support along the 100 week exponential moving average (EMA) except for Covid fall.
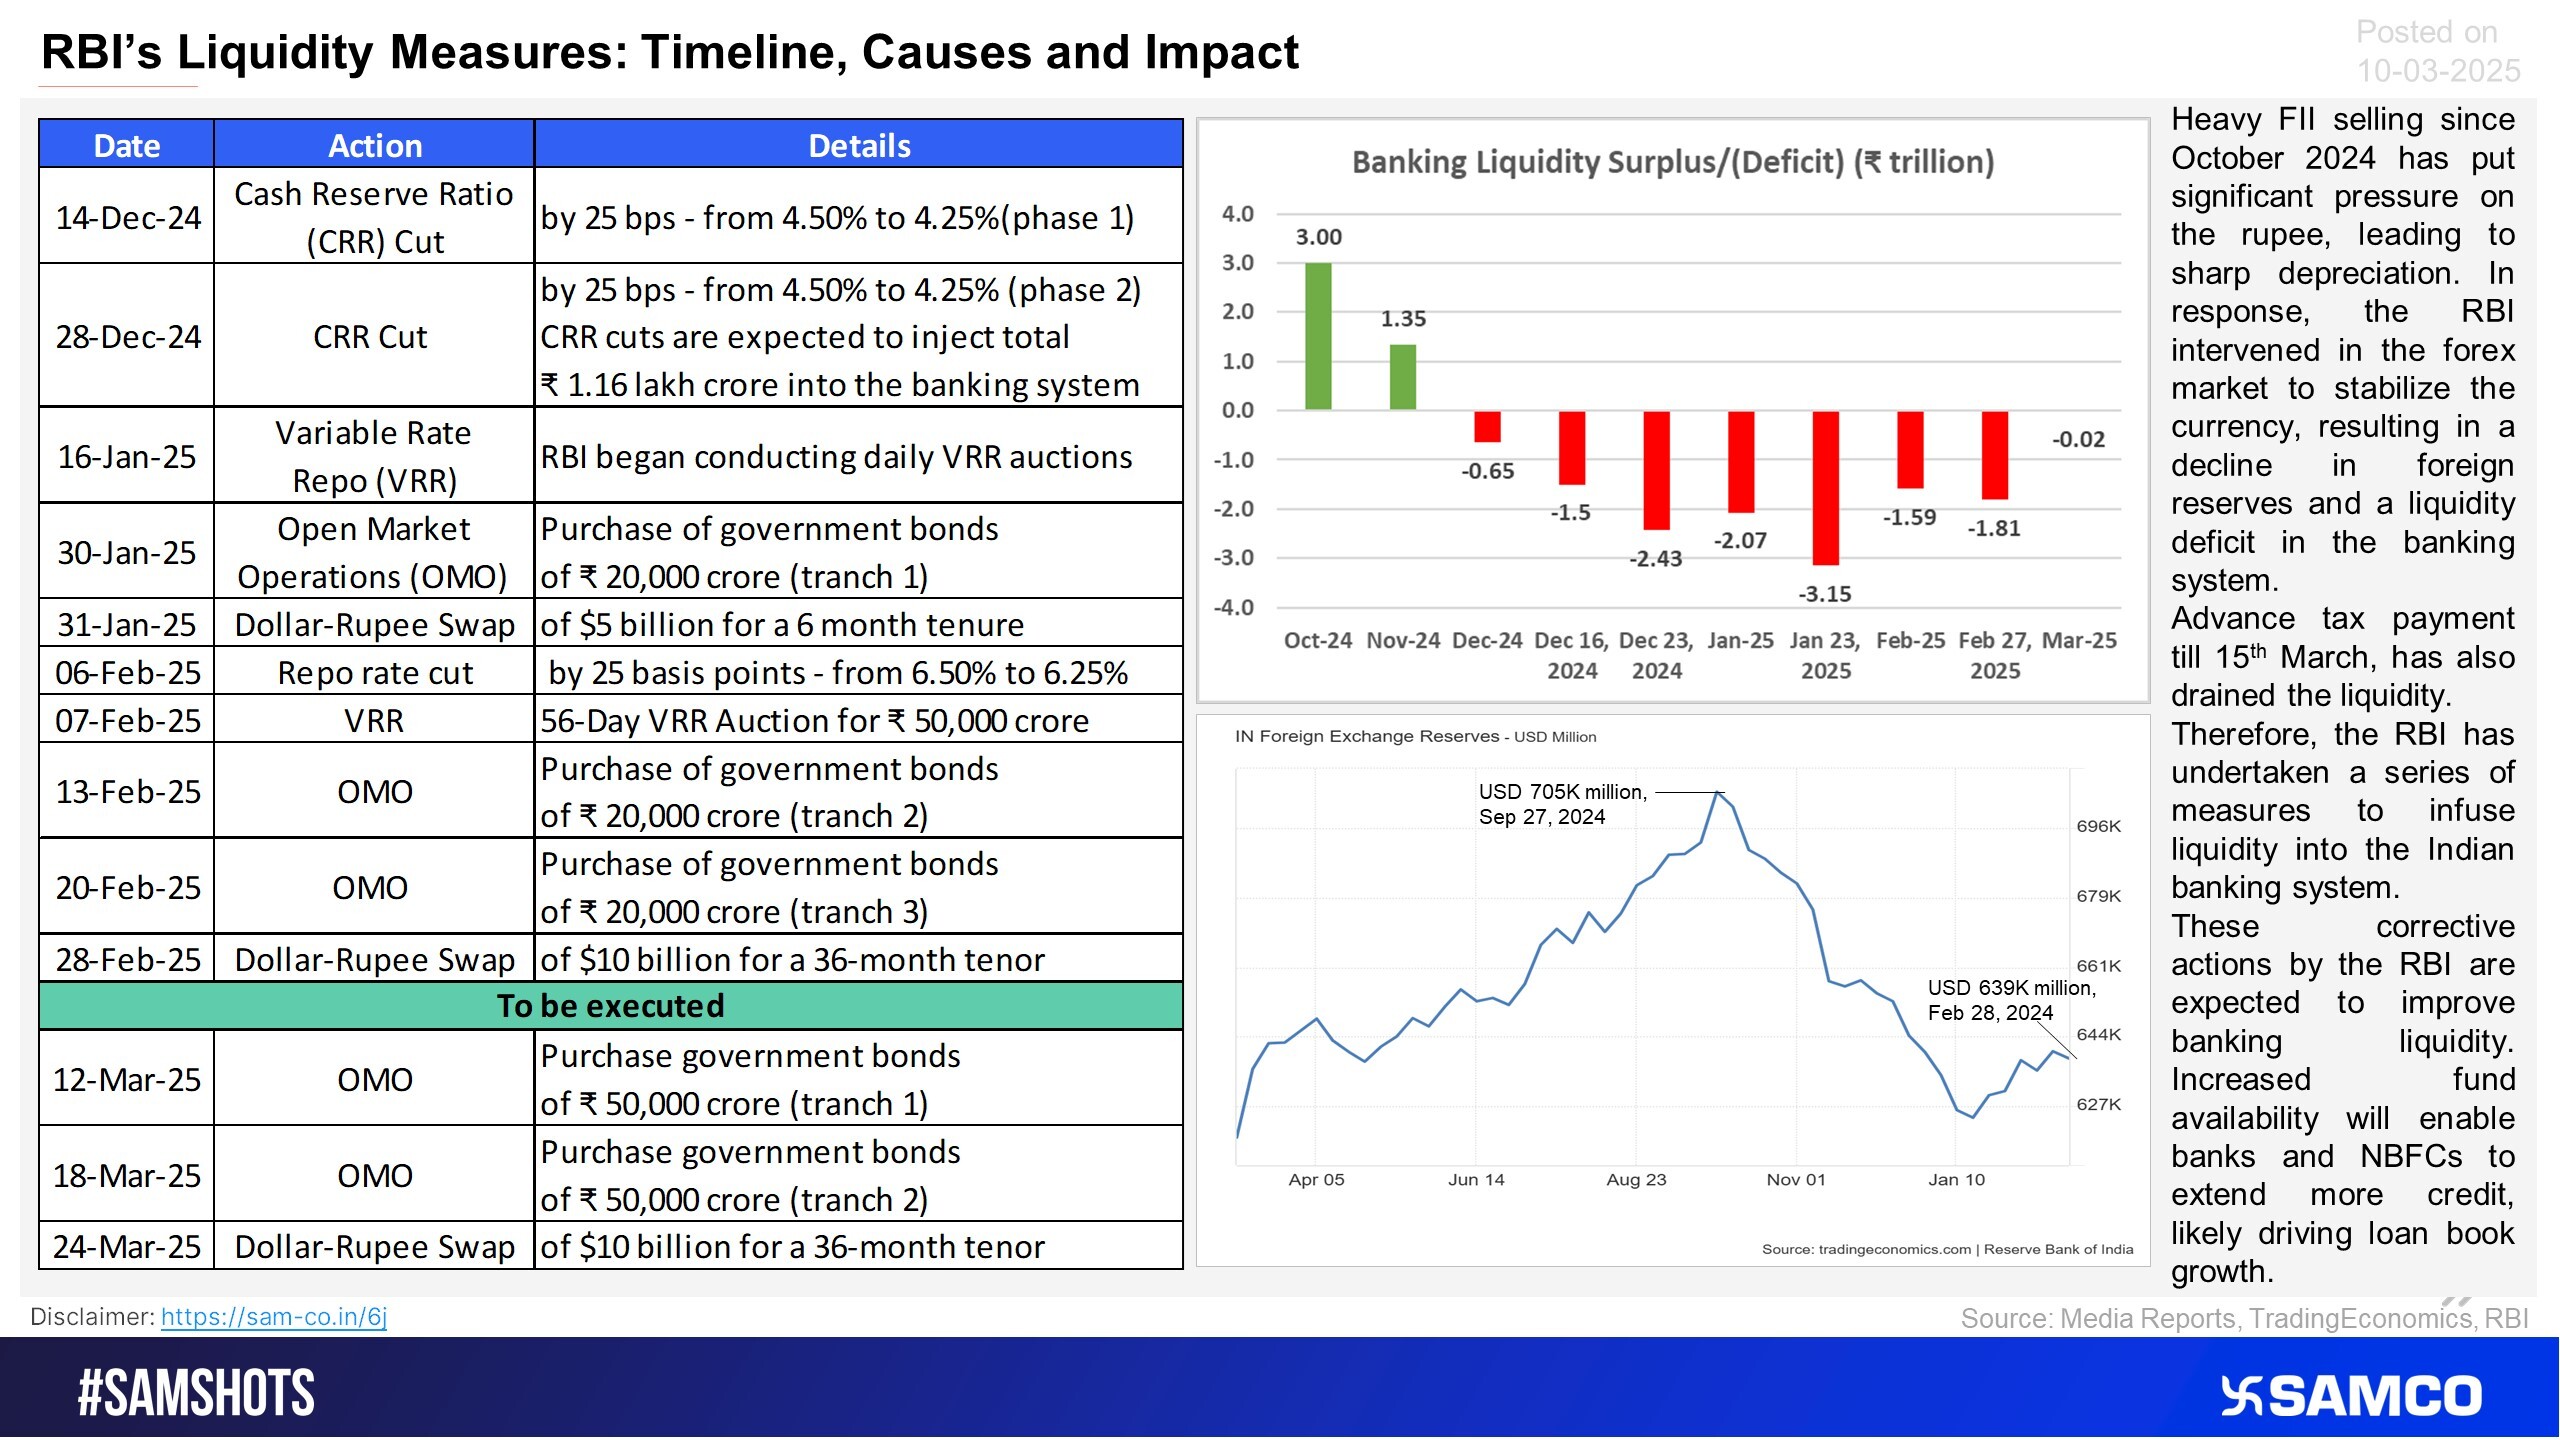
Let’s review RBI’s responses to tackle liquidity crunch in the banking system, look at the Samshot below to find what it would mean for banks and NBFCs.
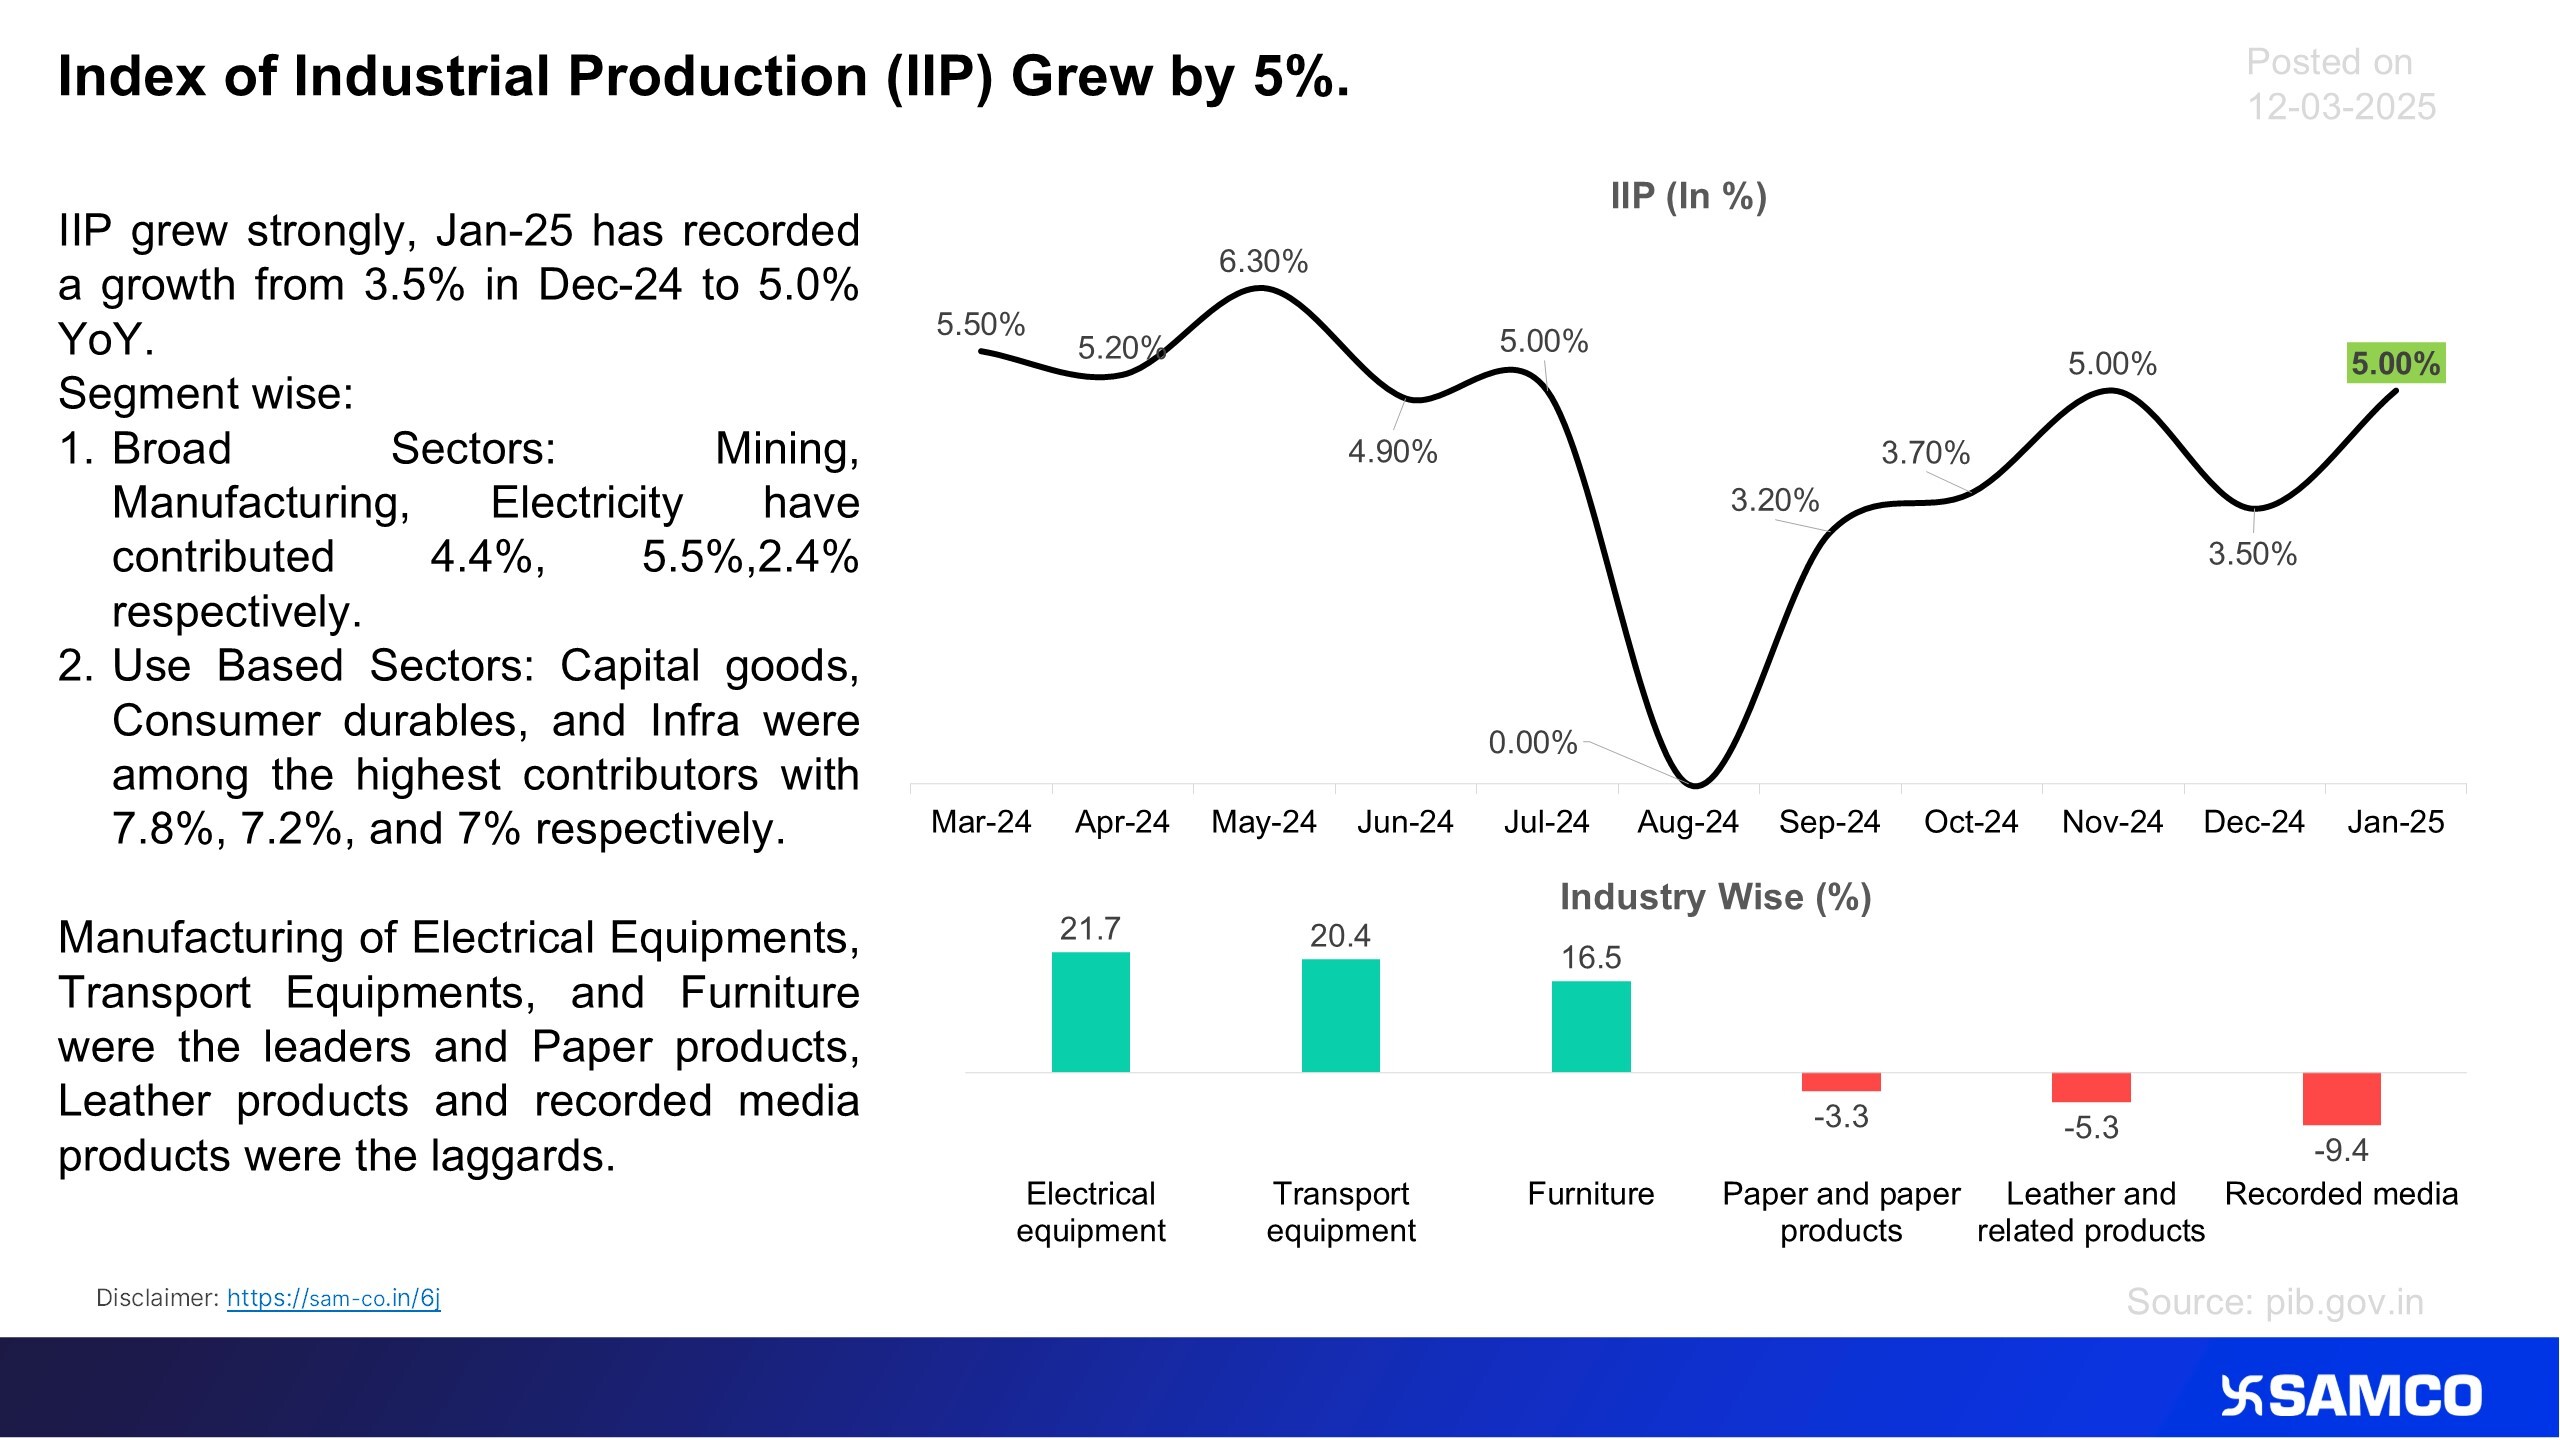
The below chart presents the growth in Index of Industrial Production data for January 2025.
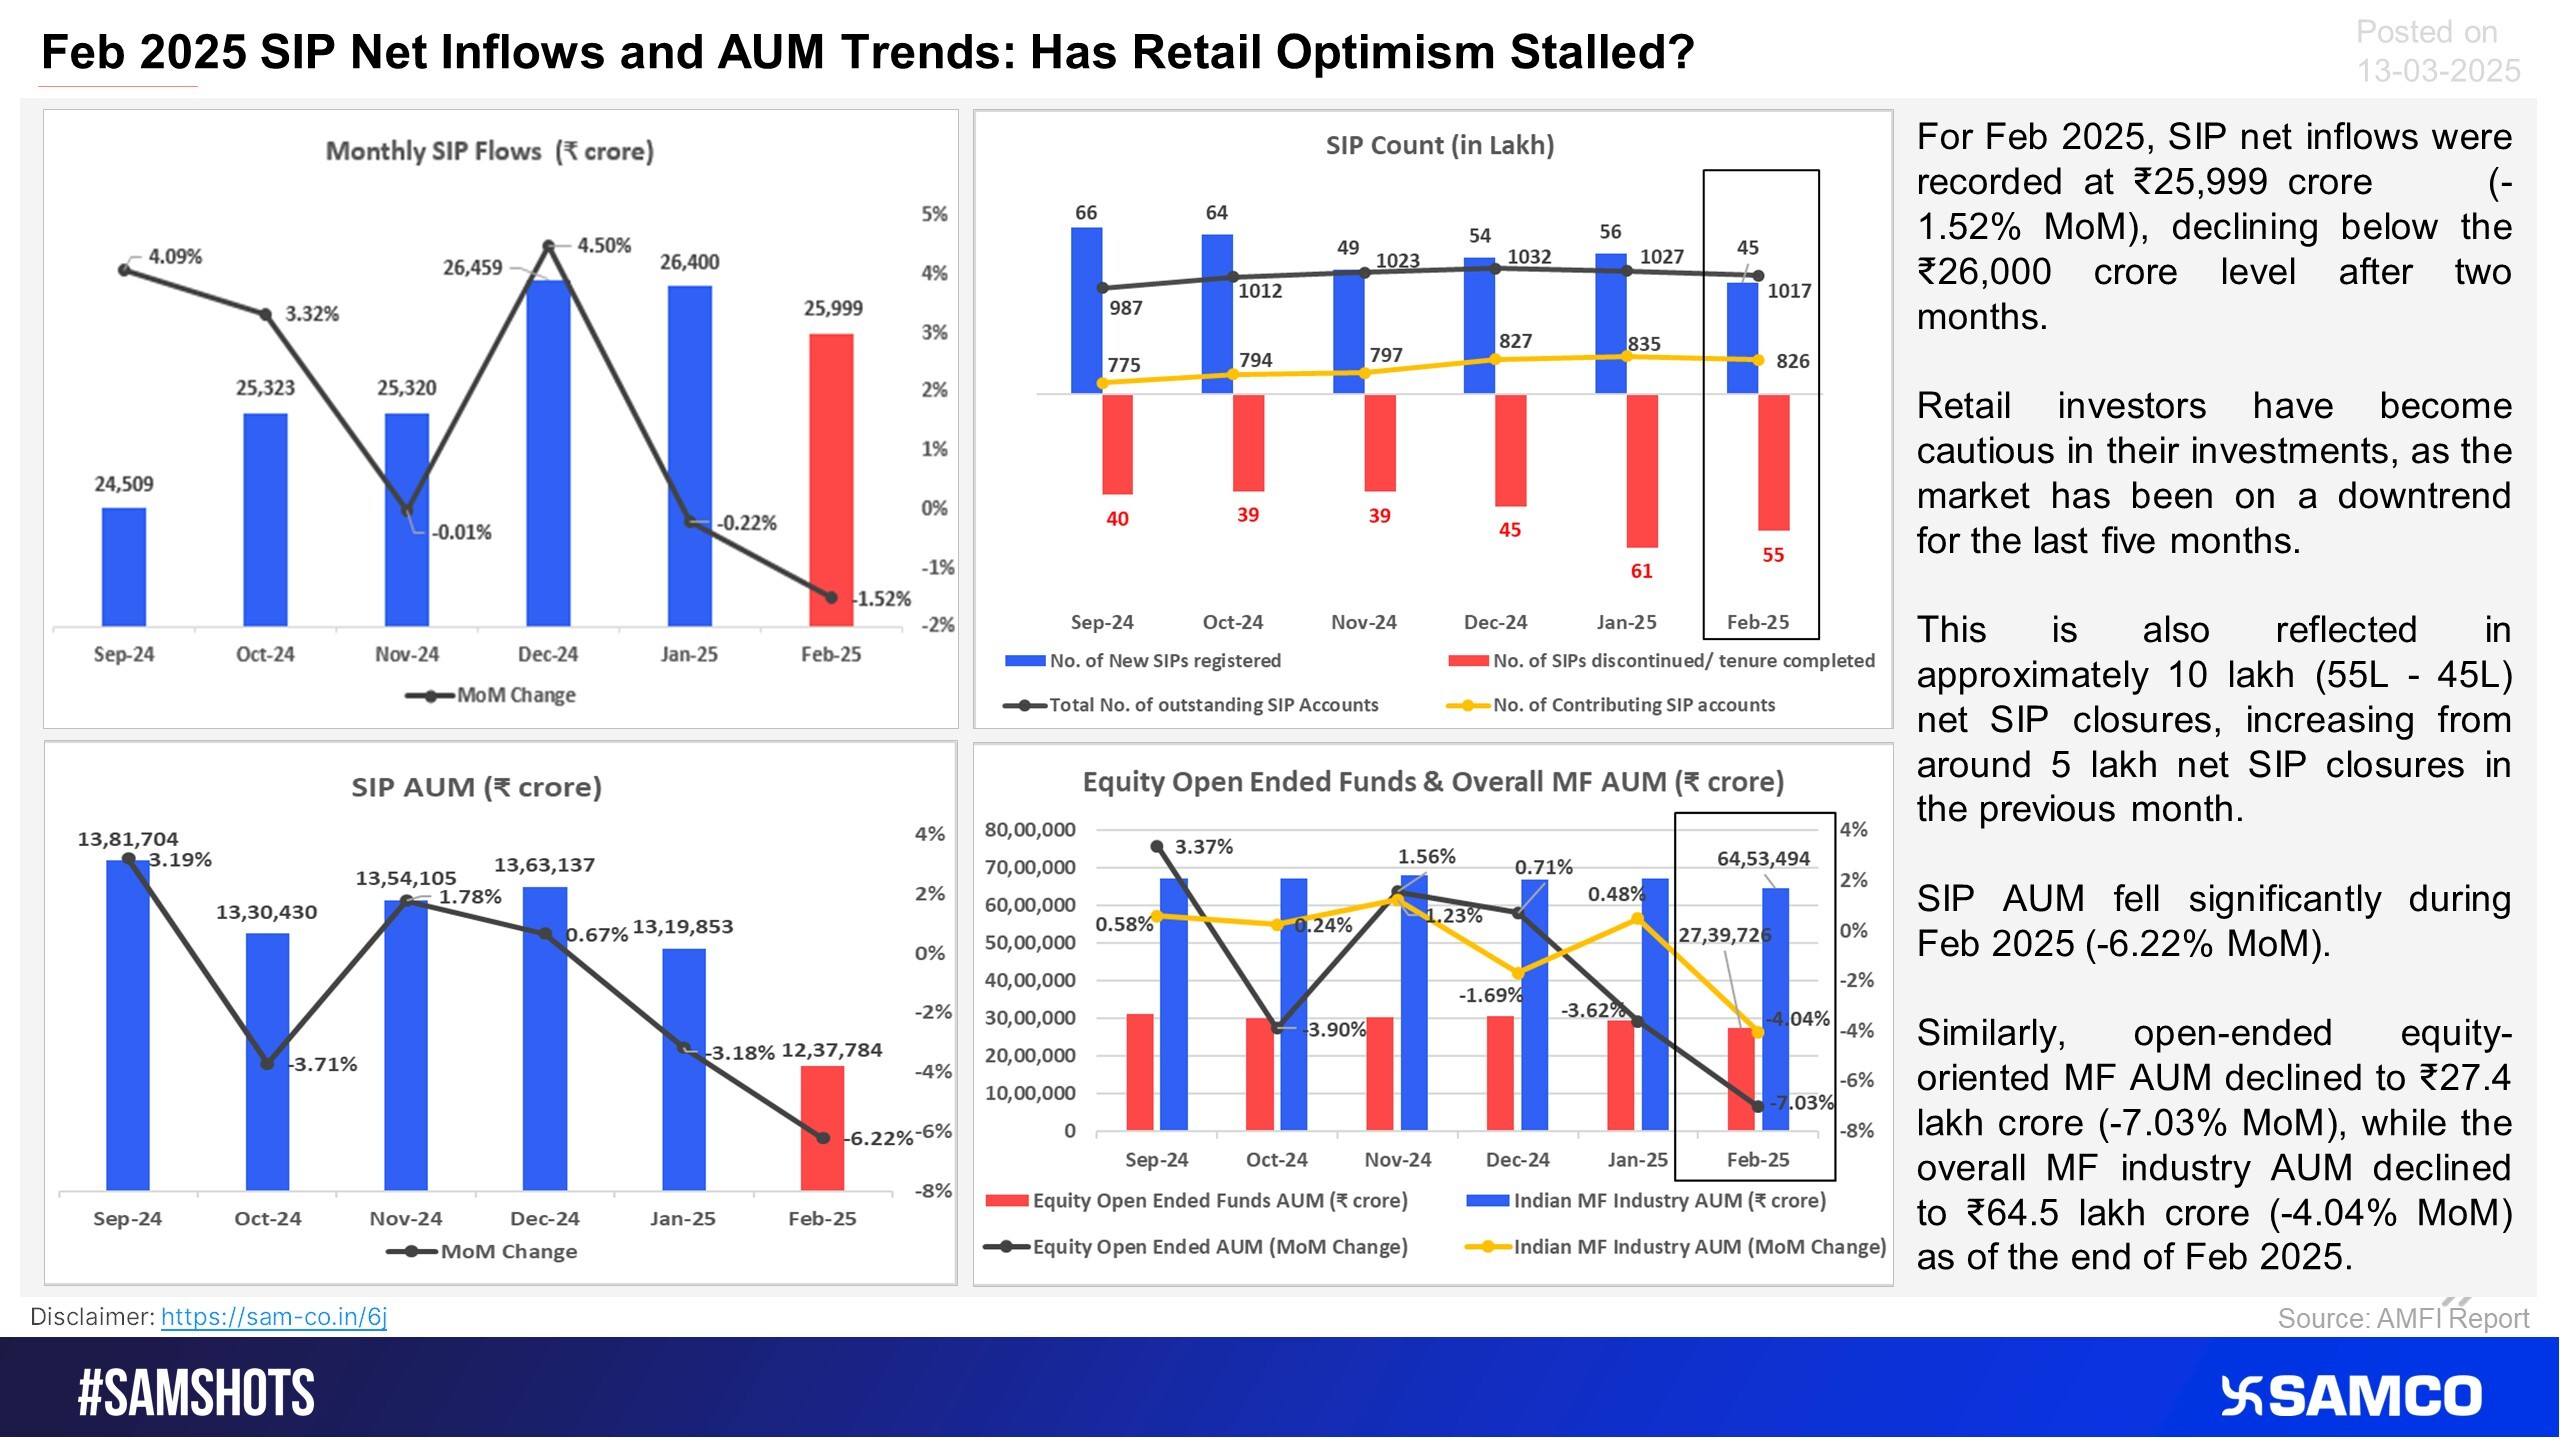
SIP inflows for Feb 2025, reflecting conservative stance of retail investors.
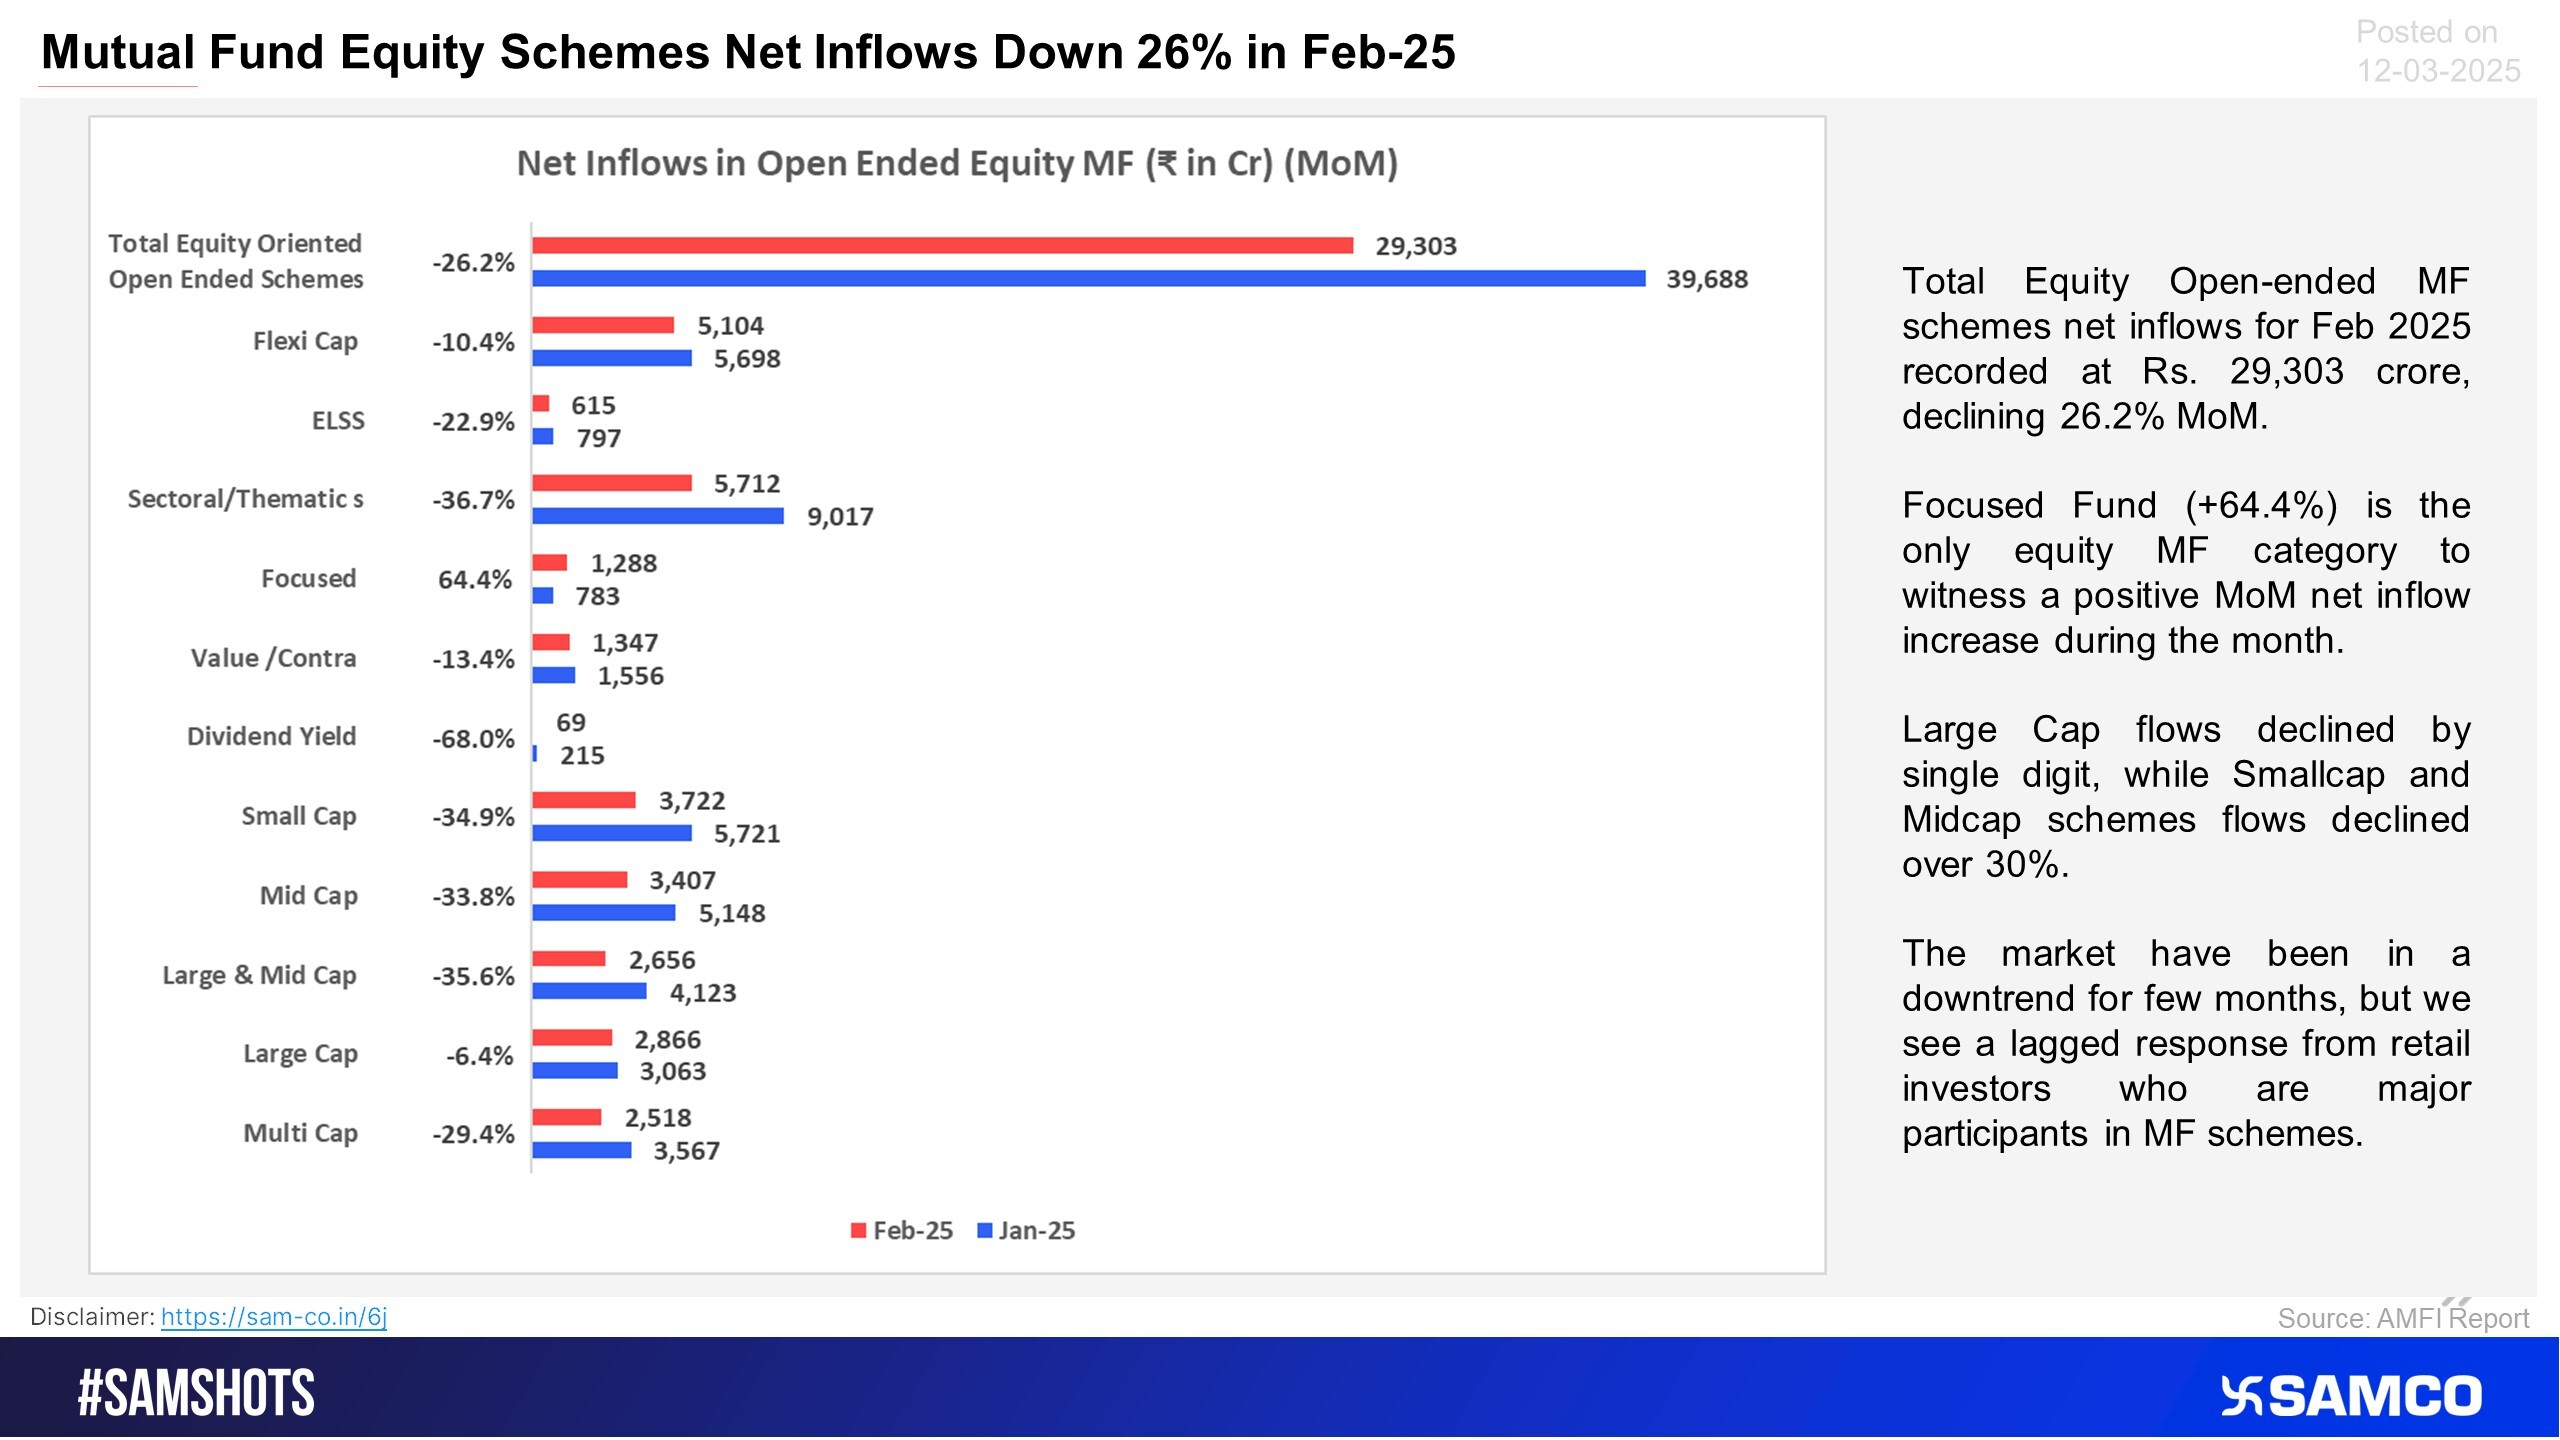
MF inflows have experienced the market heat, here’s what the February 2025 numbers reveal.
Tech Selloff Deepens.
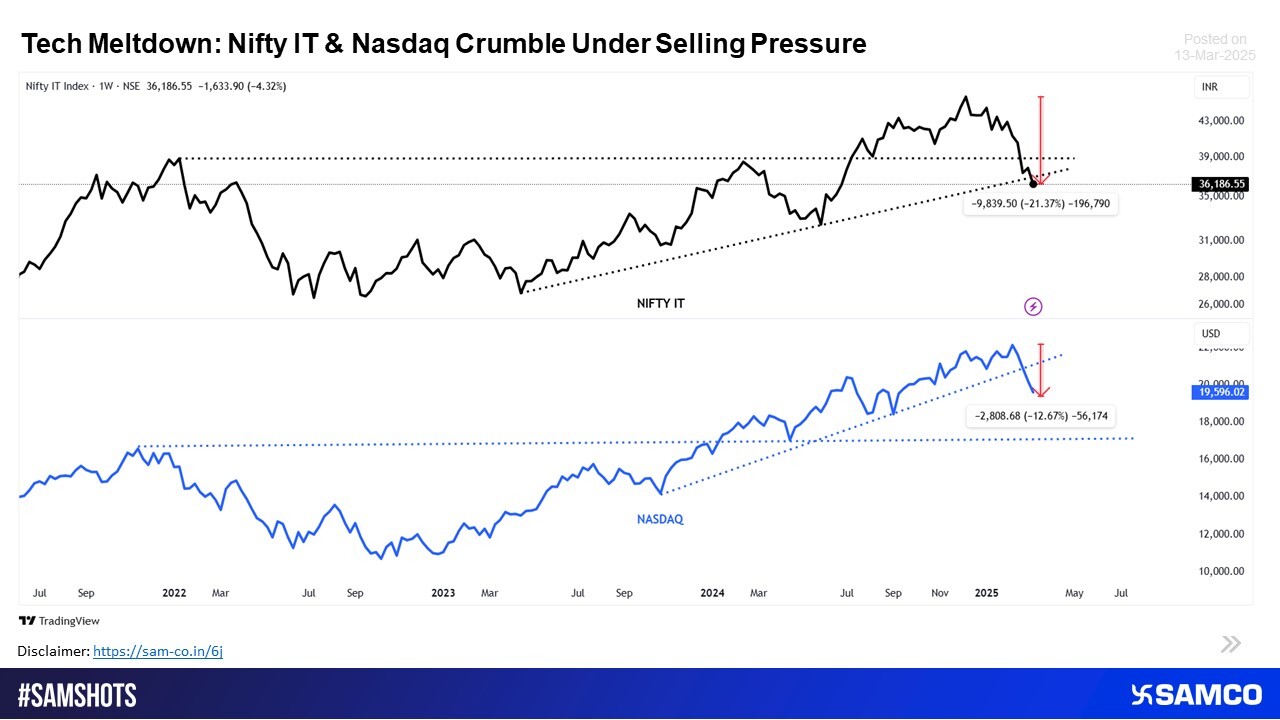
Image Source: @StatistaCharts (Twitter)

 Easy & quick
1. Register on SCORES portal
2. Mandatory details for filling complaints on SCORES
Name | PAN | Address | Mobile | Number | E-mail ID
3. Benefits
Effective Communication
Speedy redressal of the grievances
