Indian markets extended their losing streak this week as selling pressure intensified across sectors. Heavyweights dragged the indices lower, while smallcaps and midcaps faced a bloodbath, witnessing a sharp sell-off.
The Nifty 50 ended in the red for the fifth consecutive month — a rare occurrence after a very long time, reflecting the ongoing bearish sentiment. However, the India VIX cooled off by nearly 4%, hinting that market volatility is easing off.
In commodities, gold prices showed weakness after a strong rally, while silver started gaining strength, indicating a possible outperformance.
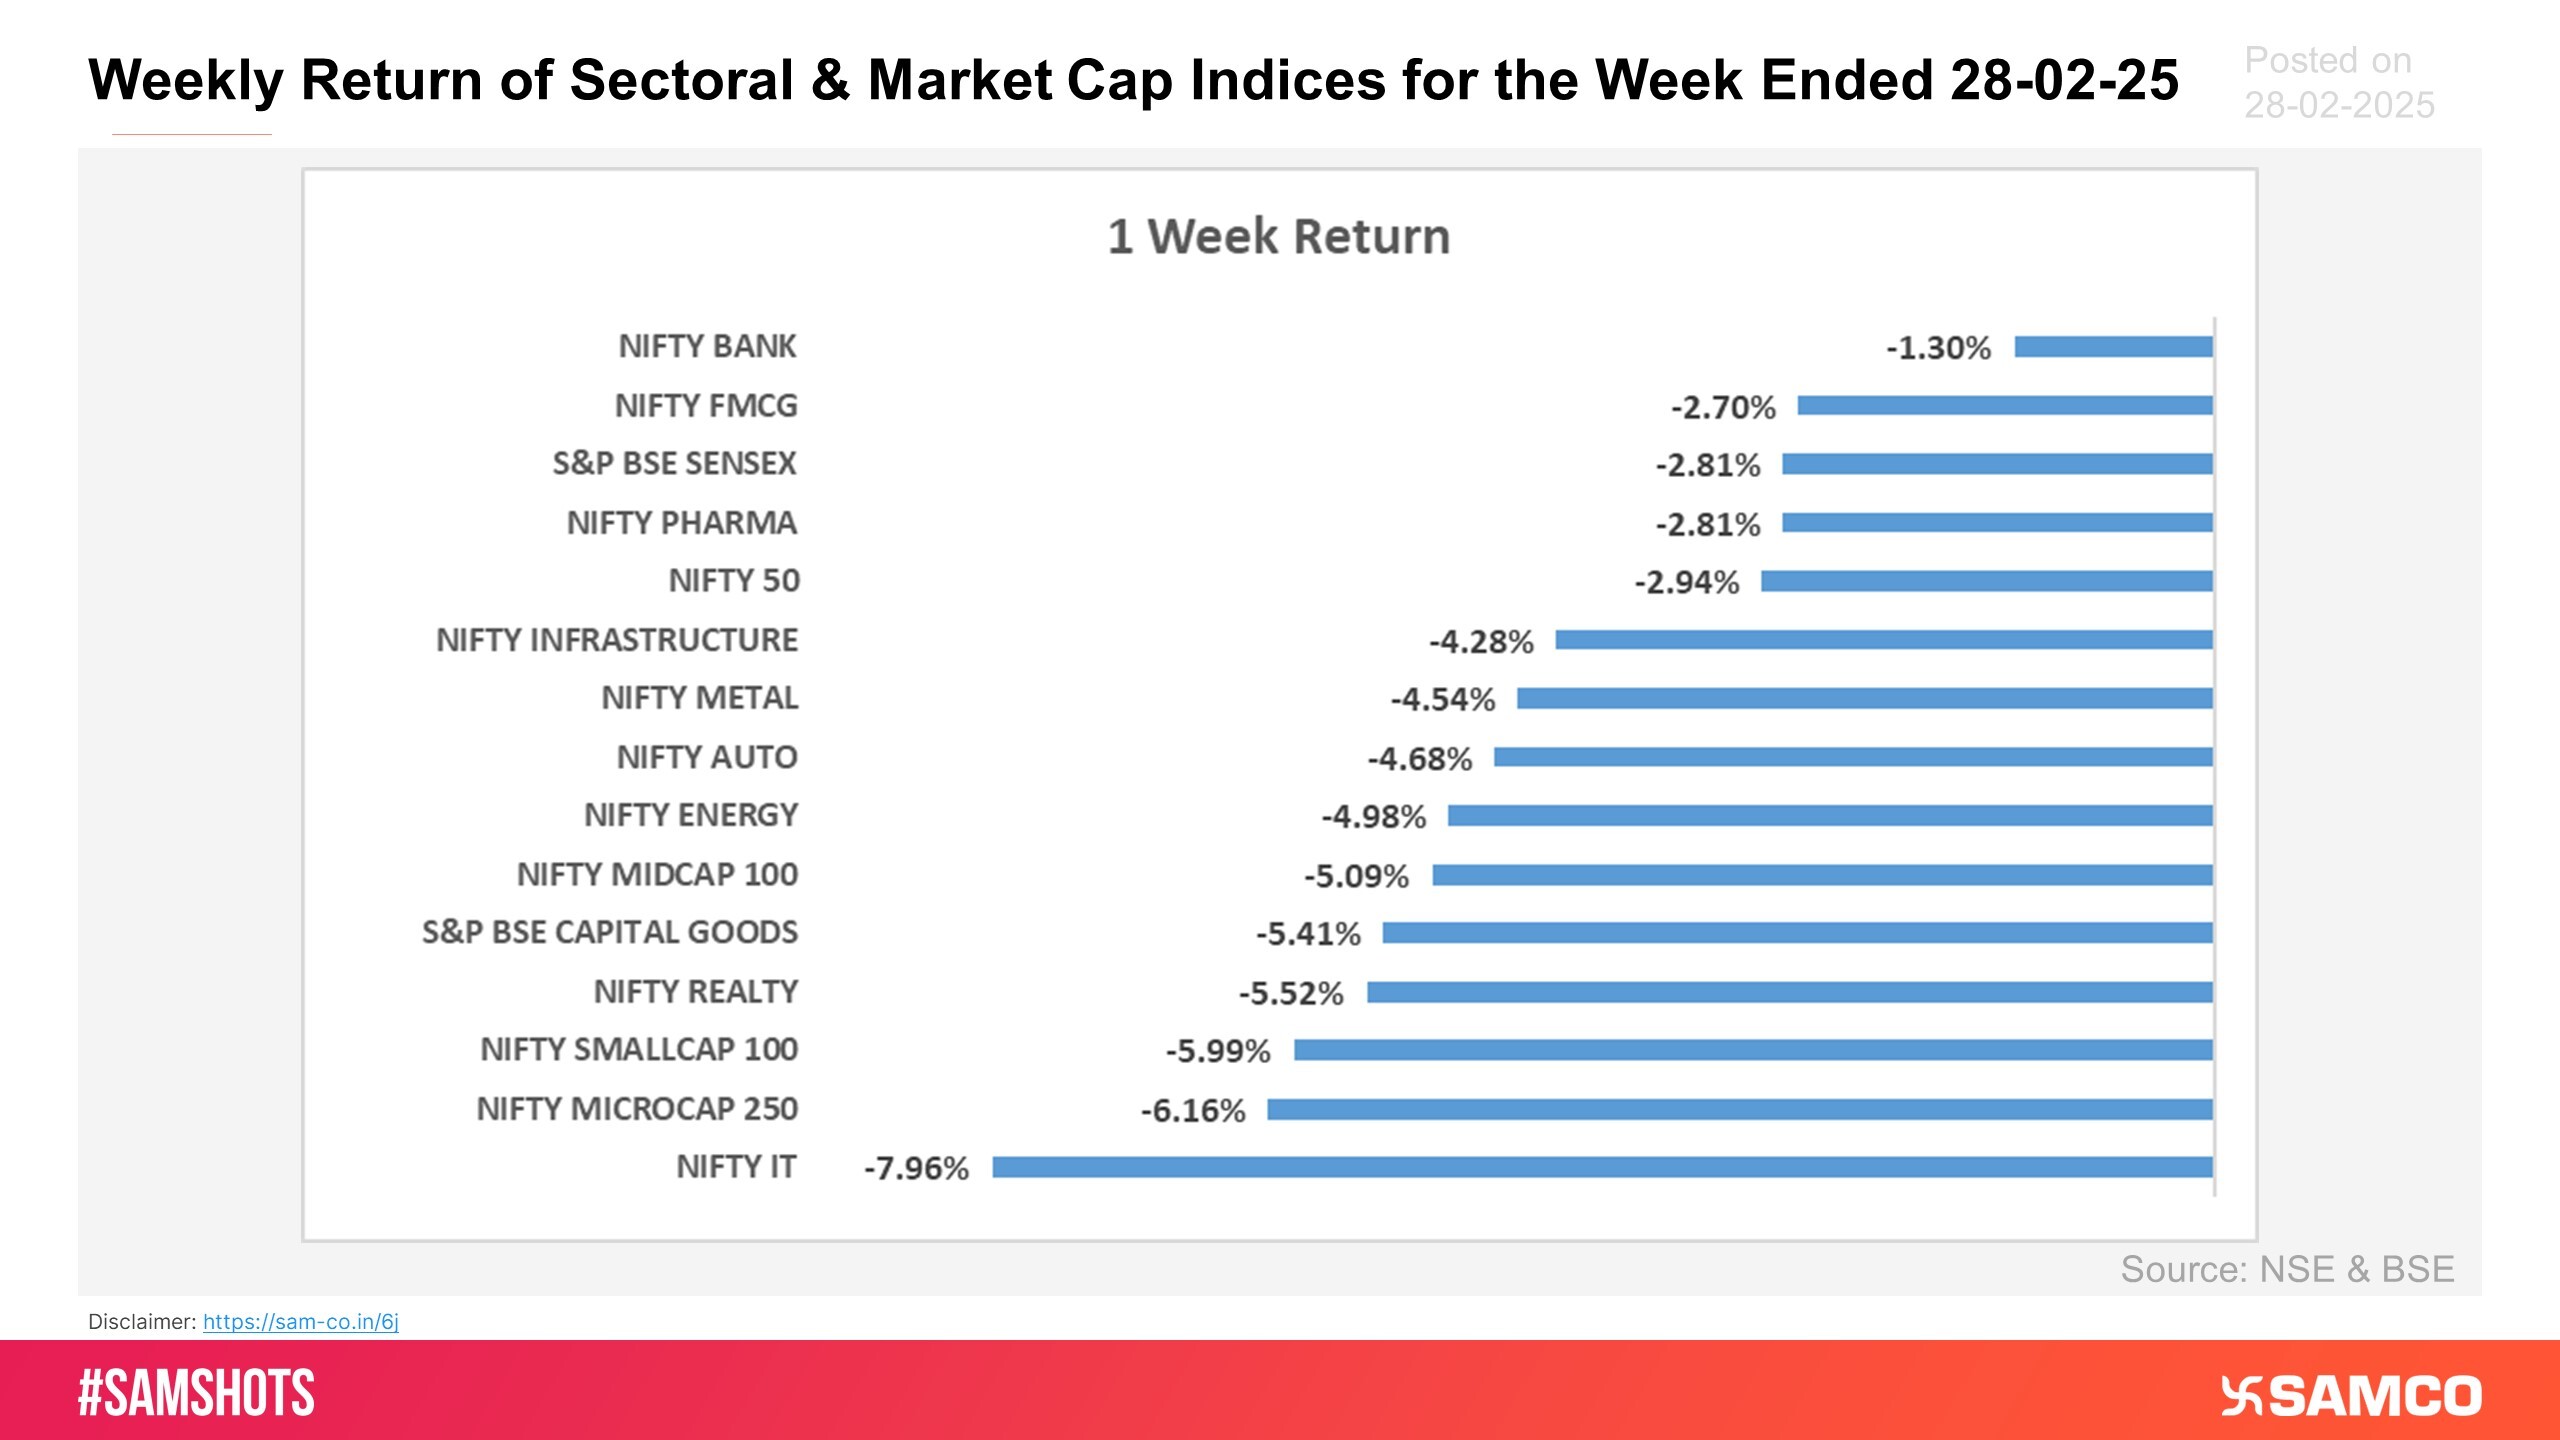
The Nifty 50 ended the week 2.94% lower at 22,125. All the sectoral indices conclude the week on a negative note with Nifty IT declining the most by 7.96%.
Scroll down to understand more of such market news and perspectives for the week gone by in easily understandable charts.
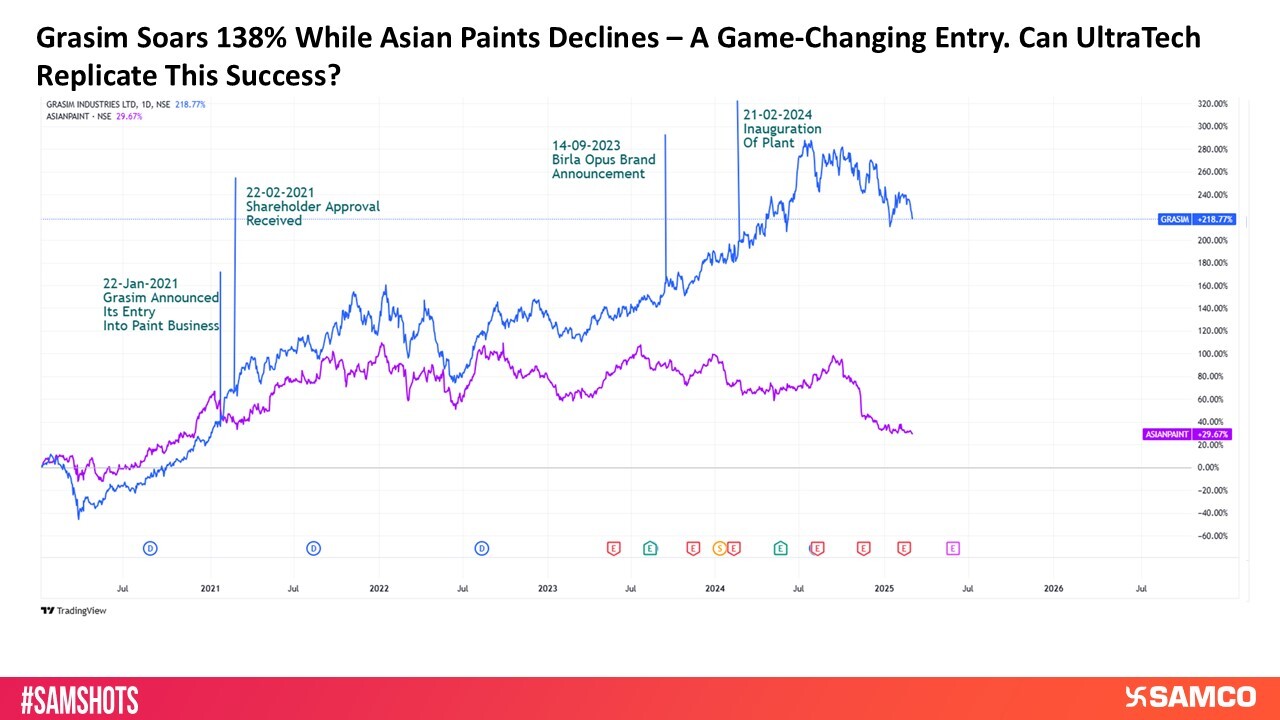
The chart draws parallels between Grasim Entry Into Paints and Ultratech Entry Into Wires & Cables.


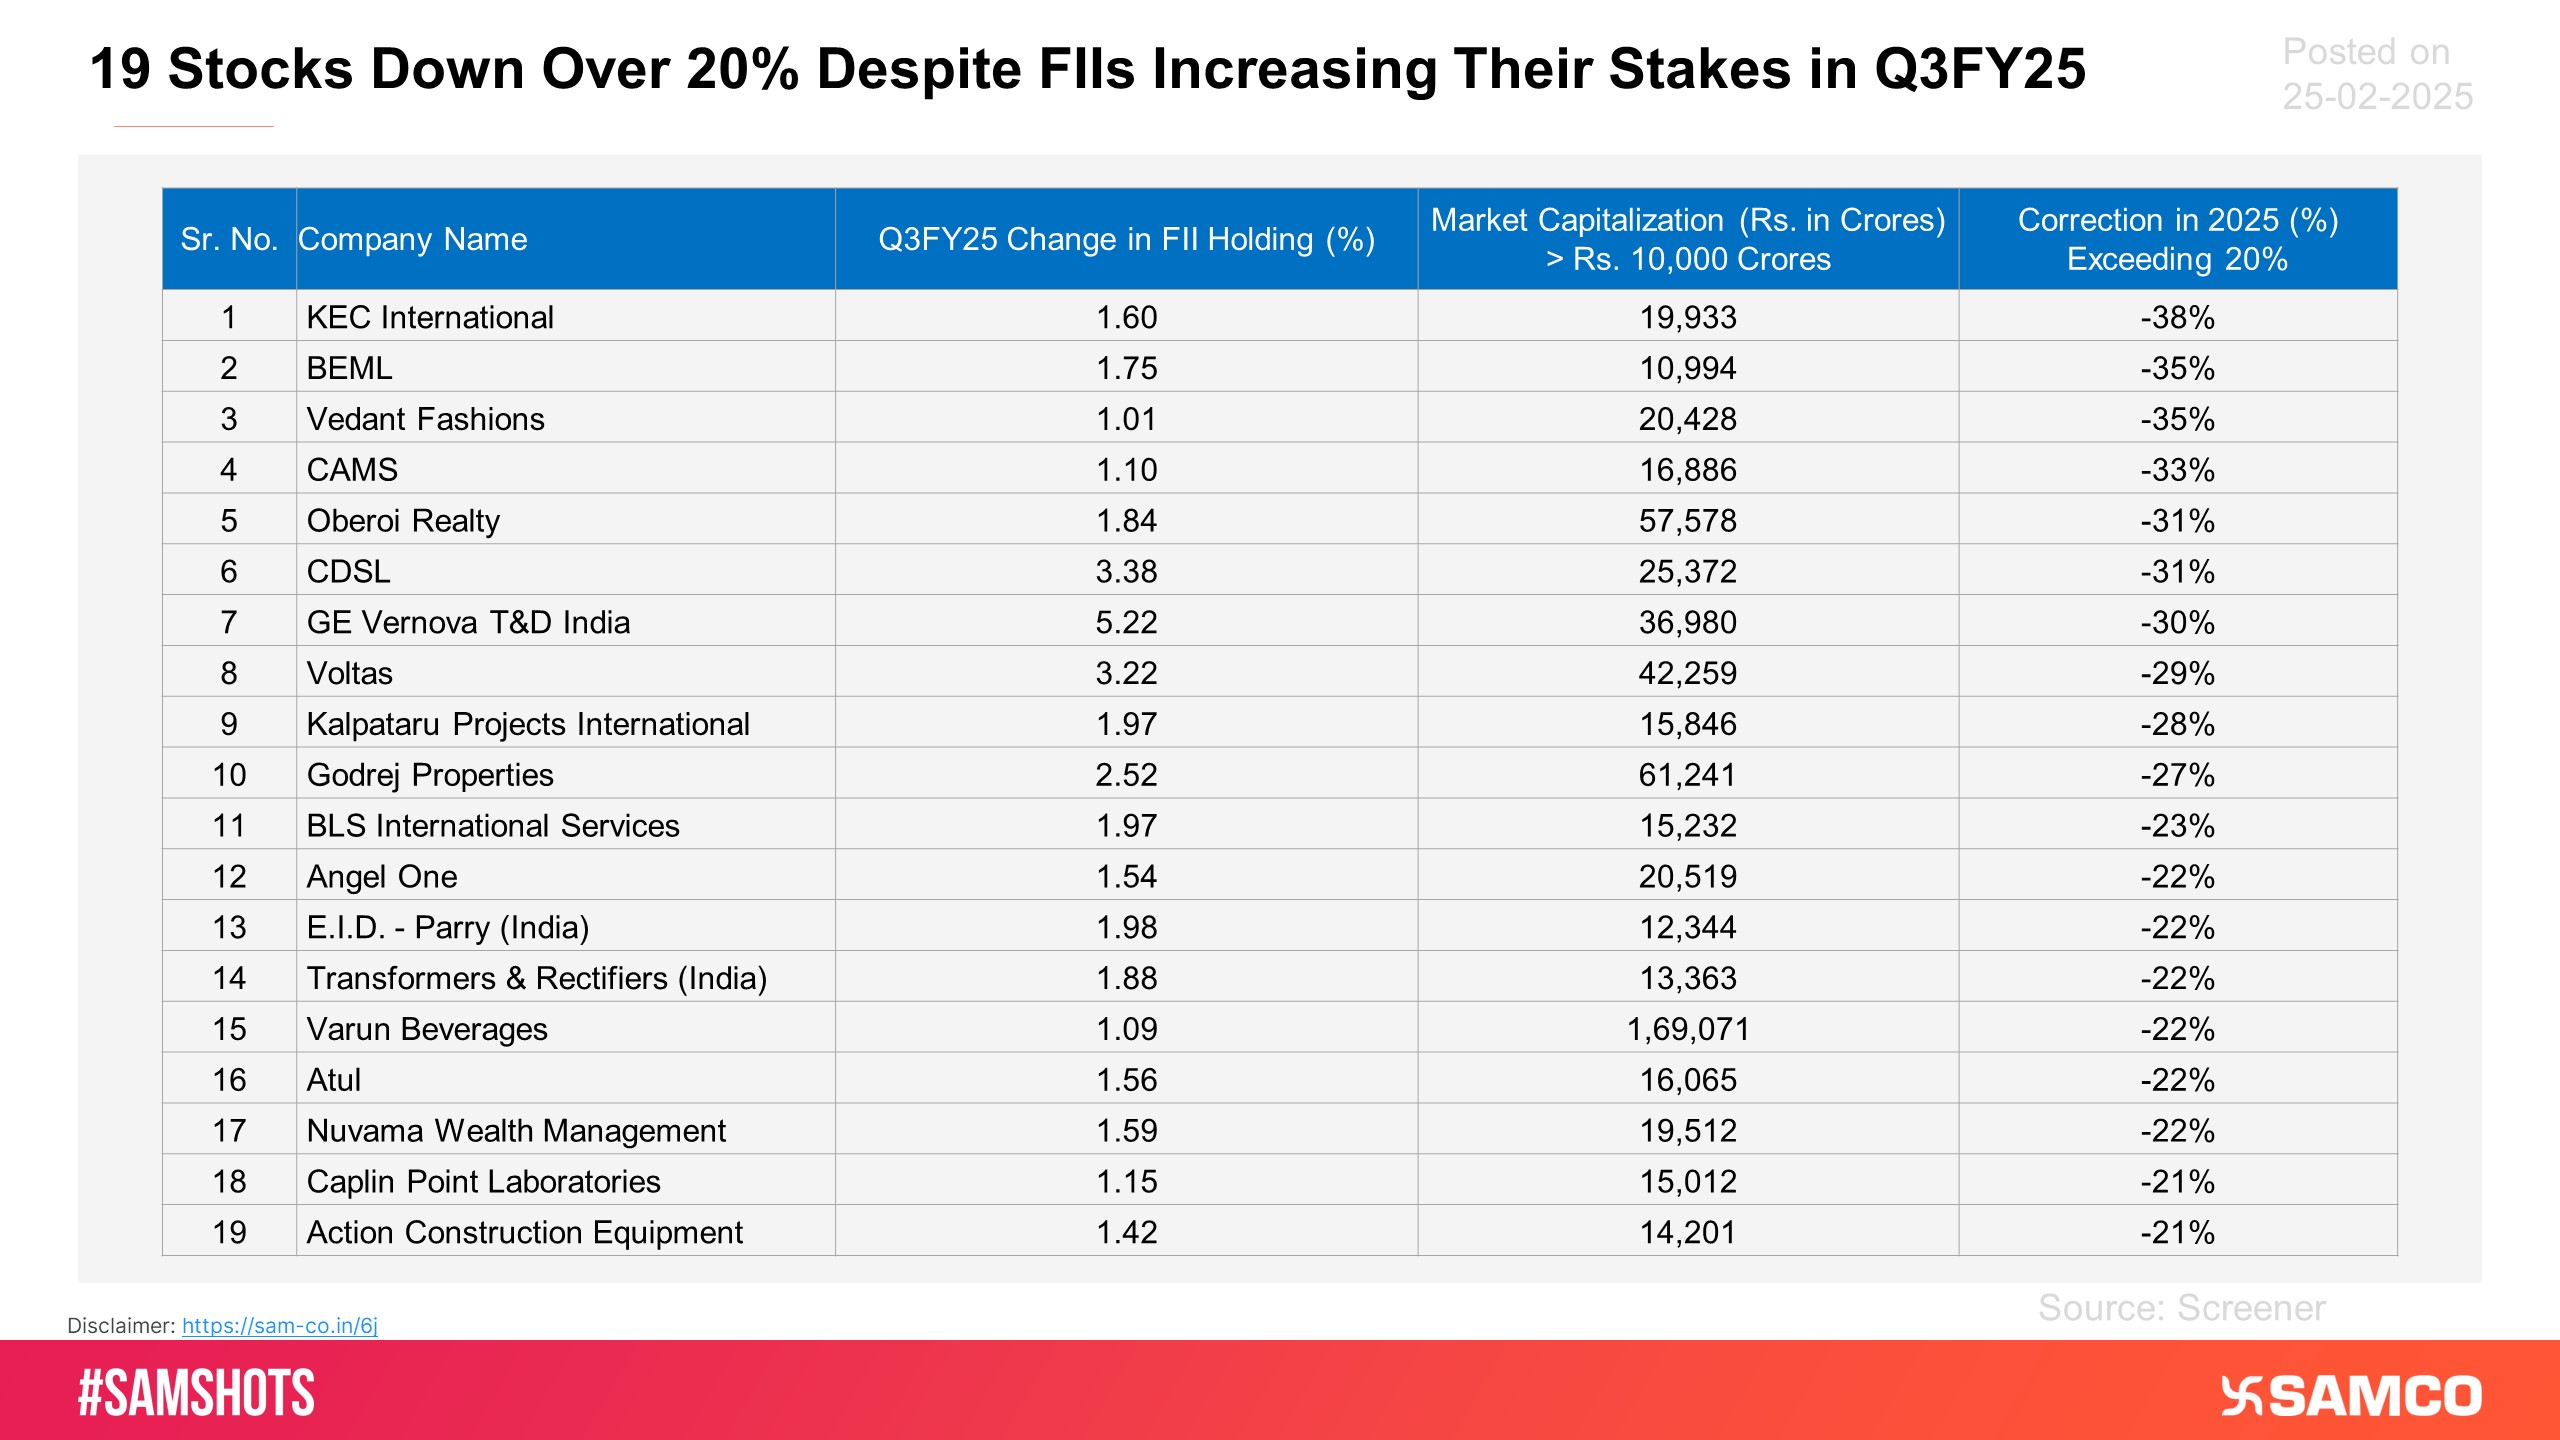
The chart highlights 19 companies with a market capitalization exceeding Rs. 10,000 crores, where FIIs increased their holdings in Q3FY25. These stocks have witnessed a correction of over 20% in the first 2 months of 2025.
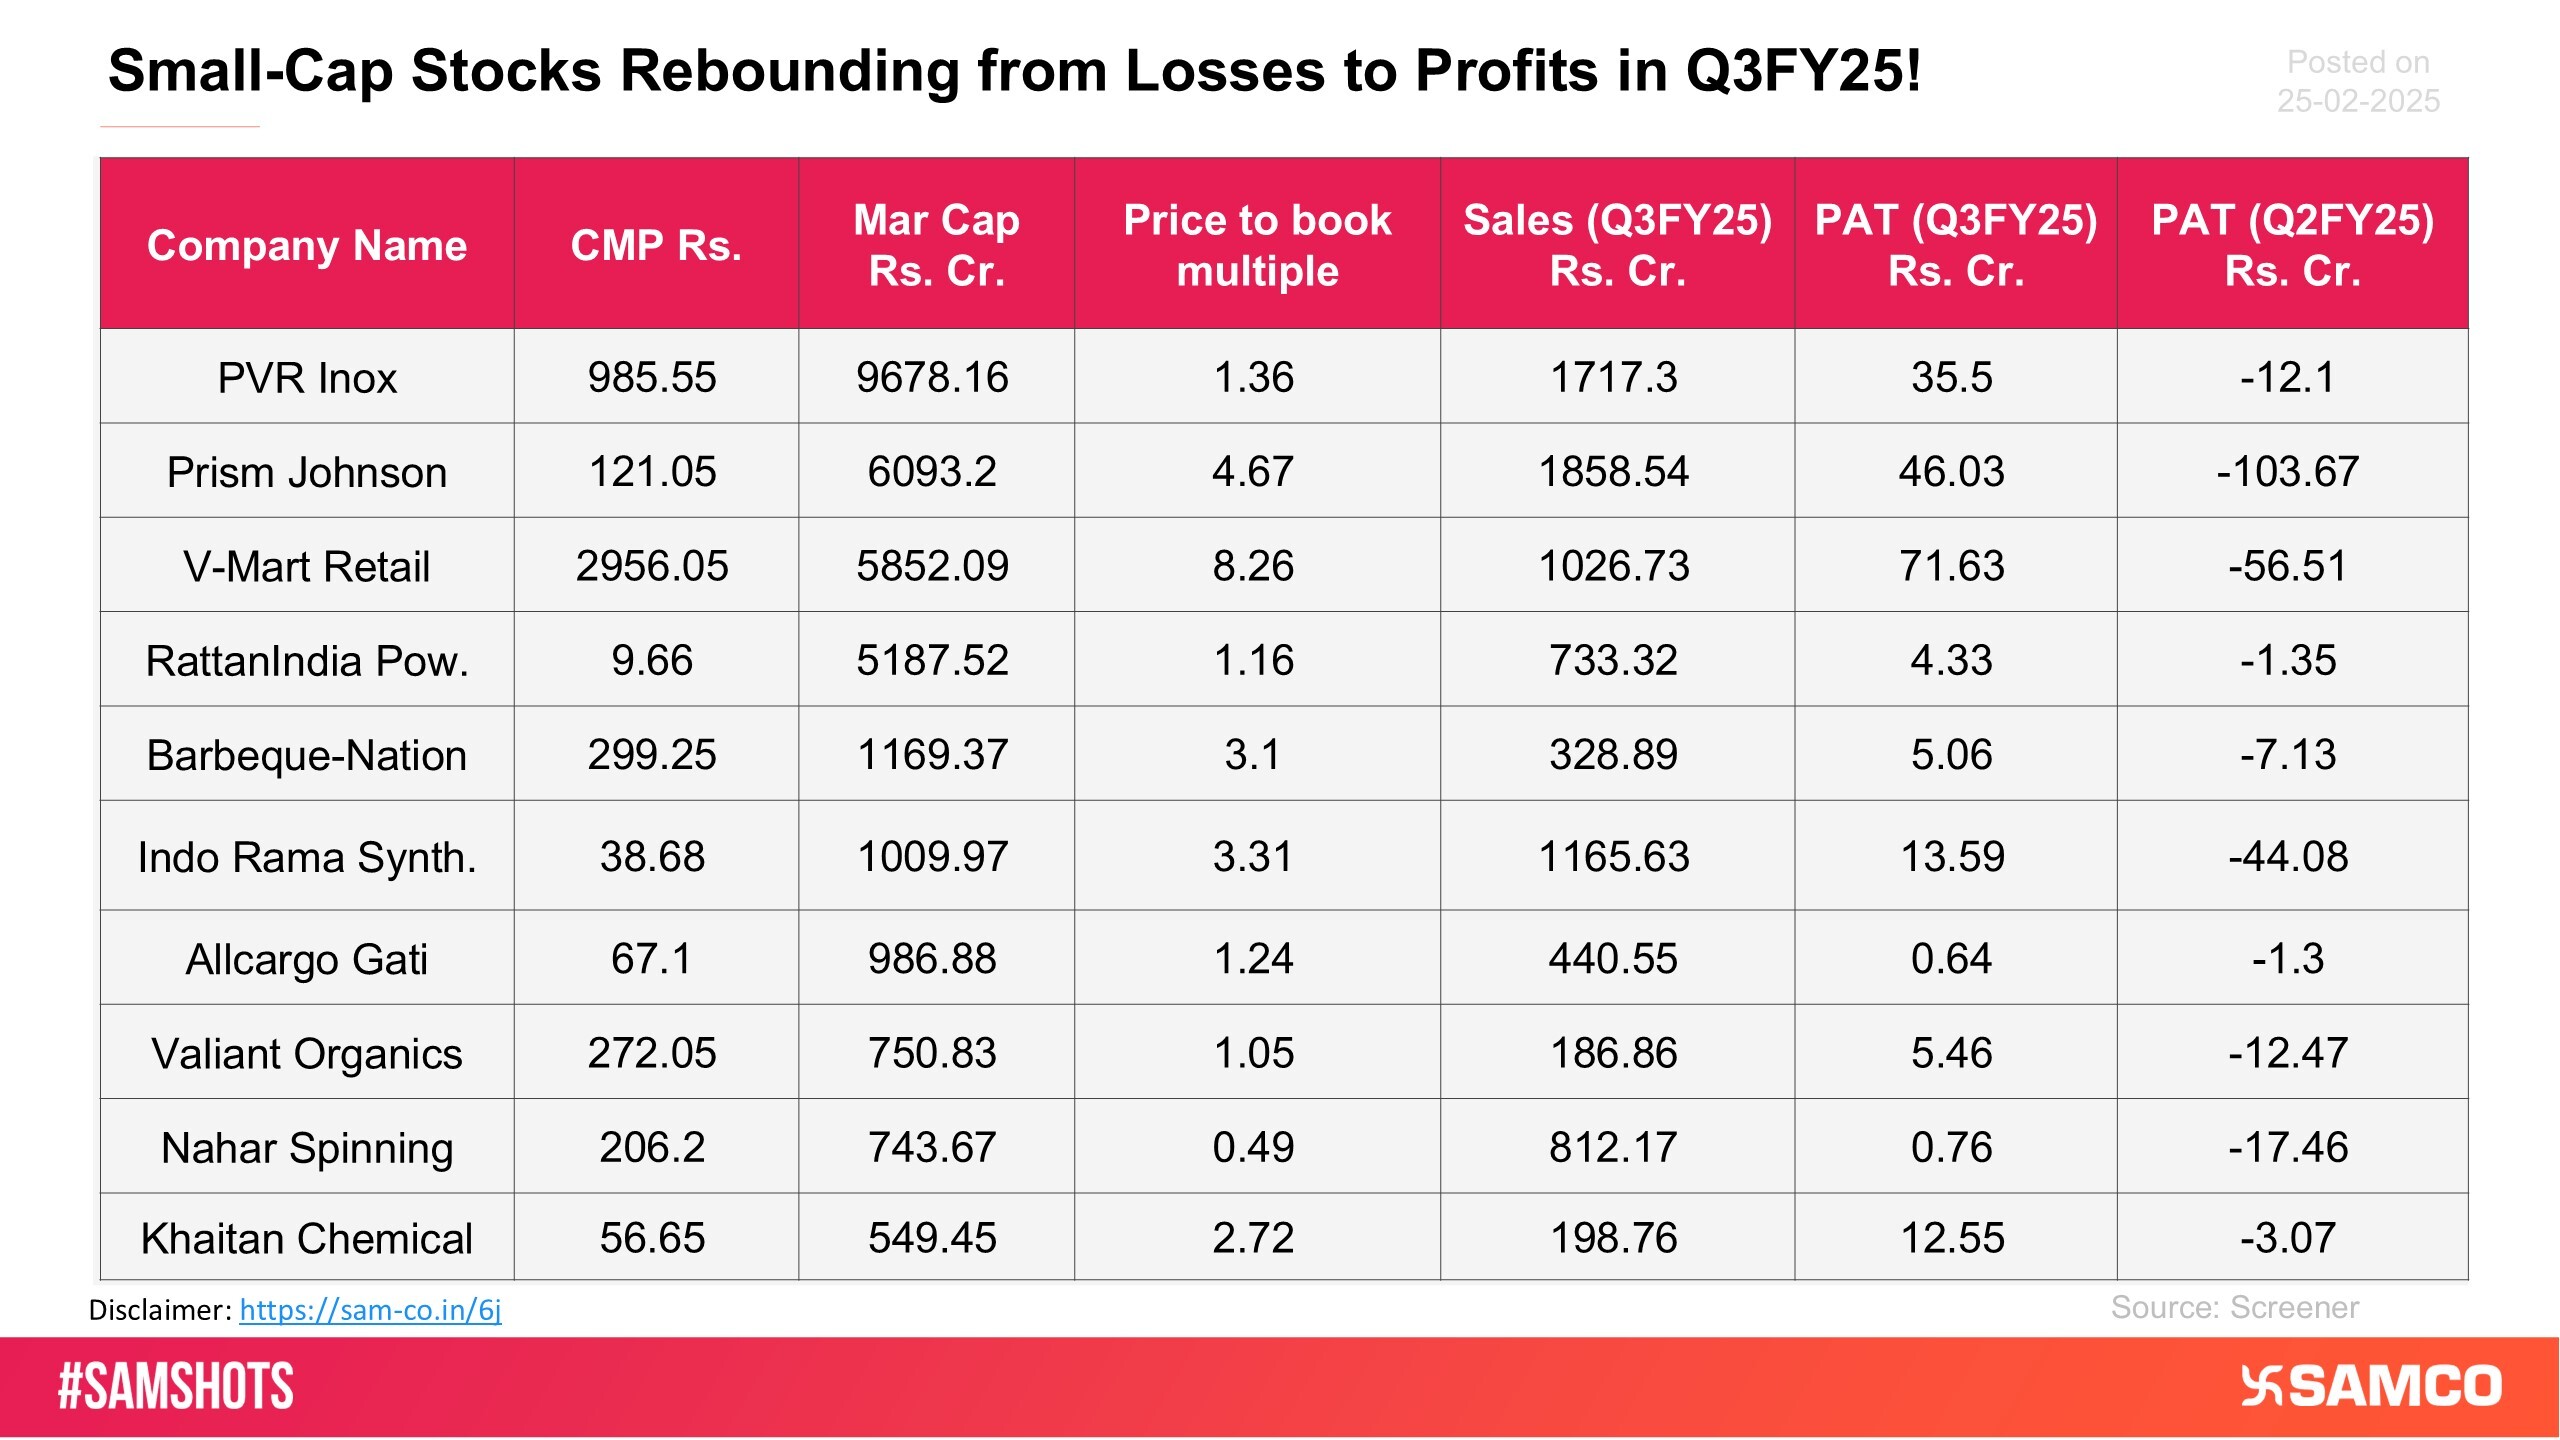
Here’s the list of small-cap stocks that witnessed turnaround in Q3FY25.
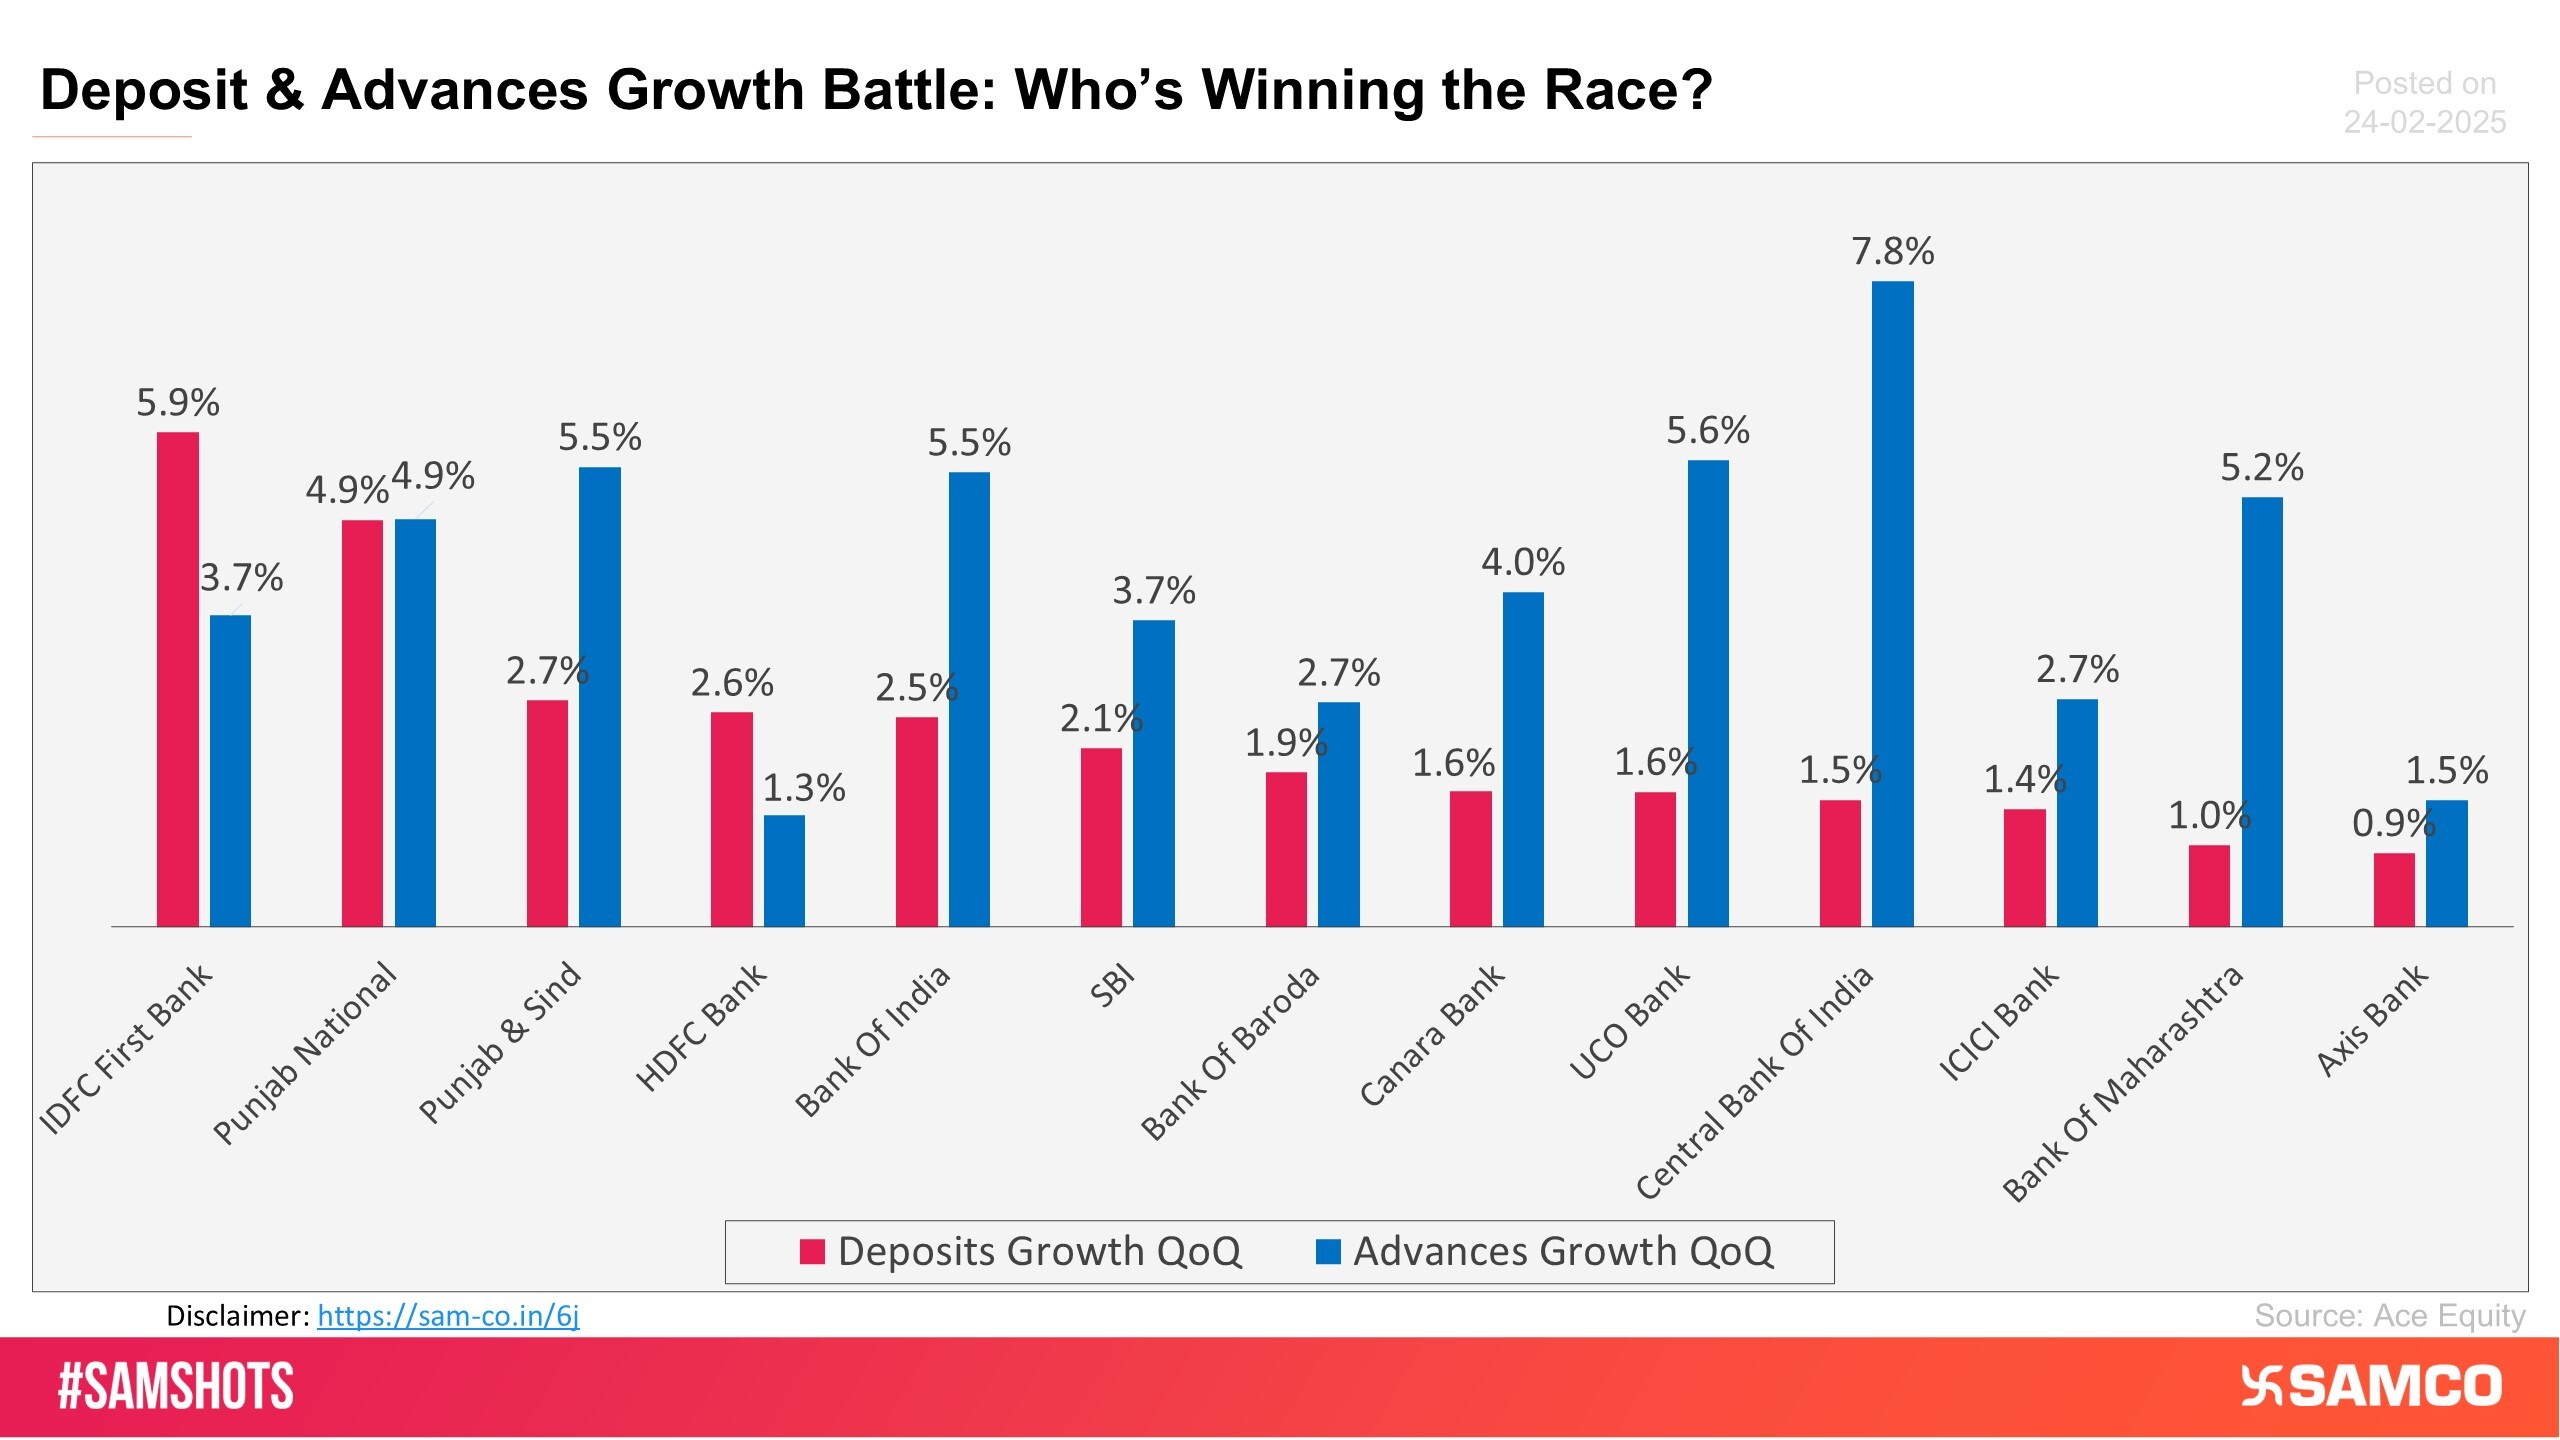
The attached chart shows the QoQ advance & deposits growth of the major Indian Banks.
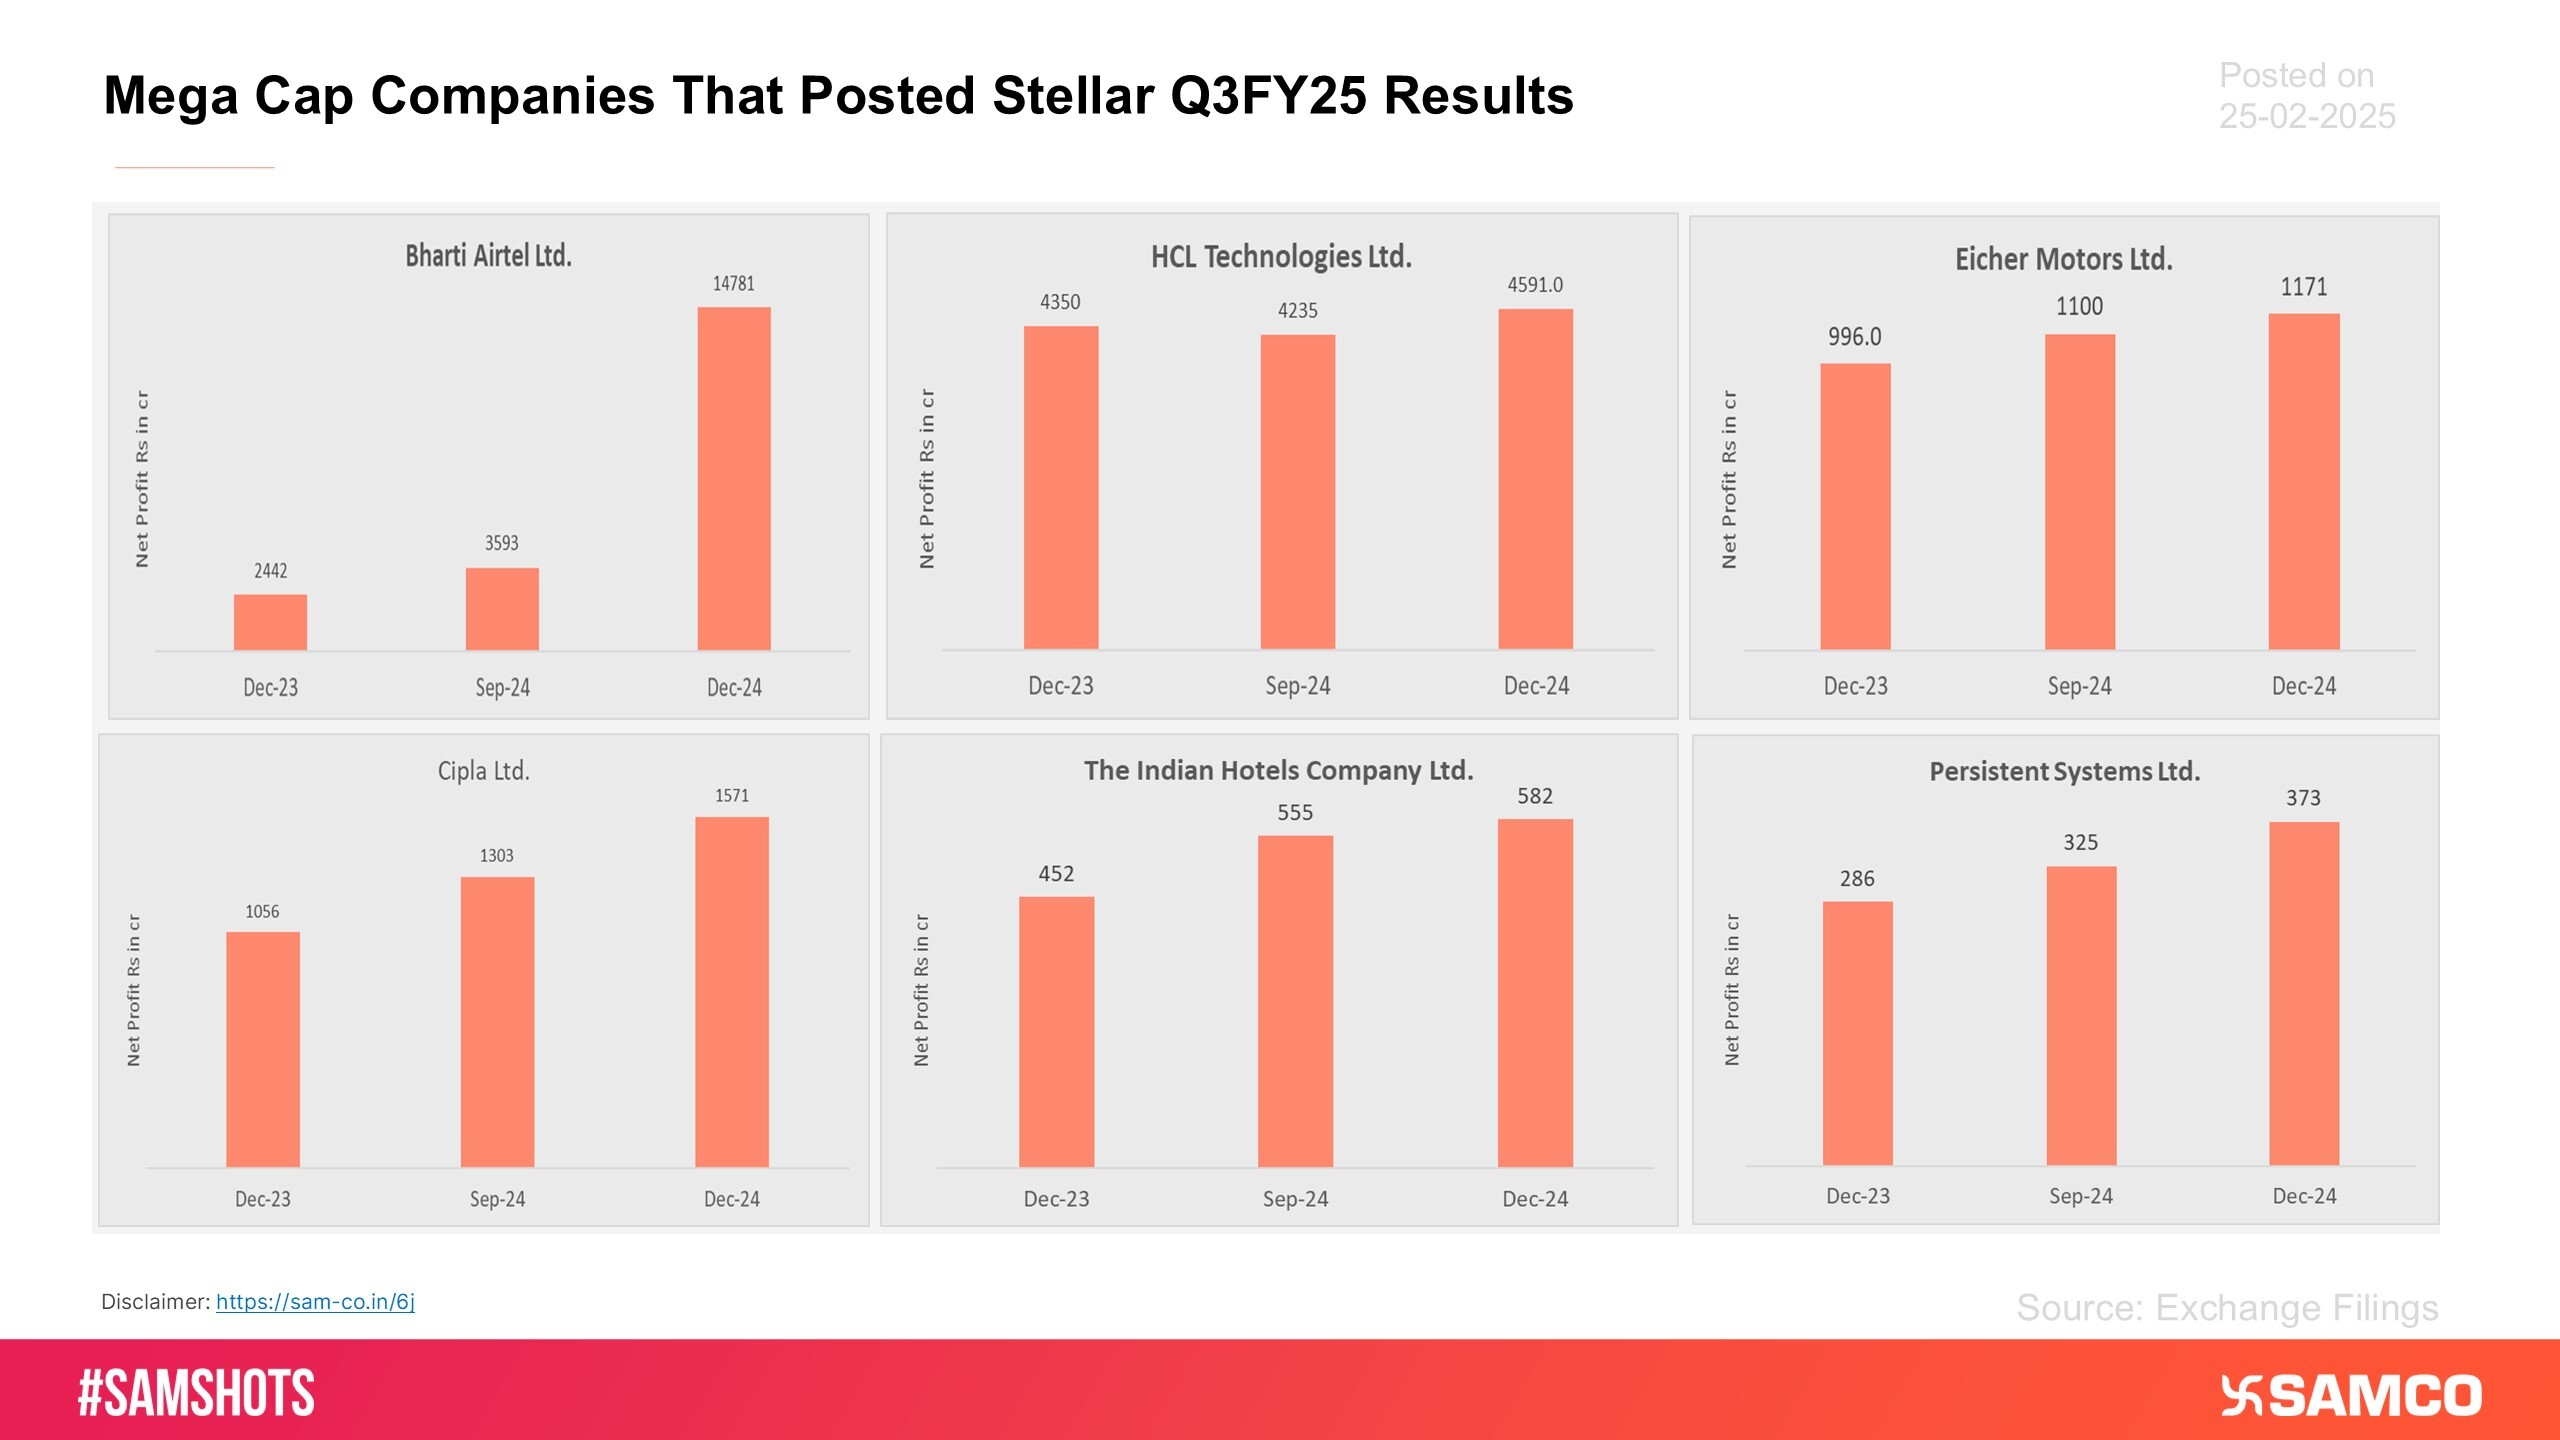
Here’s the list of companies with a market cap over 50,000 crores that have declared best results in Q3FY25.
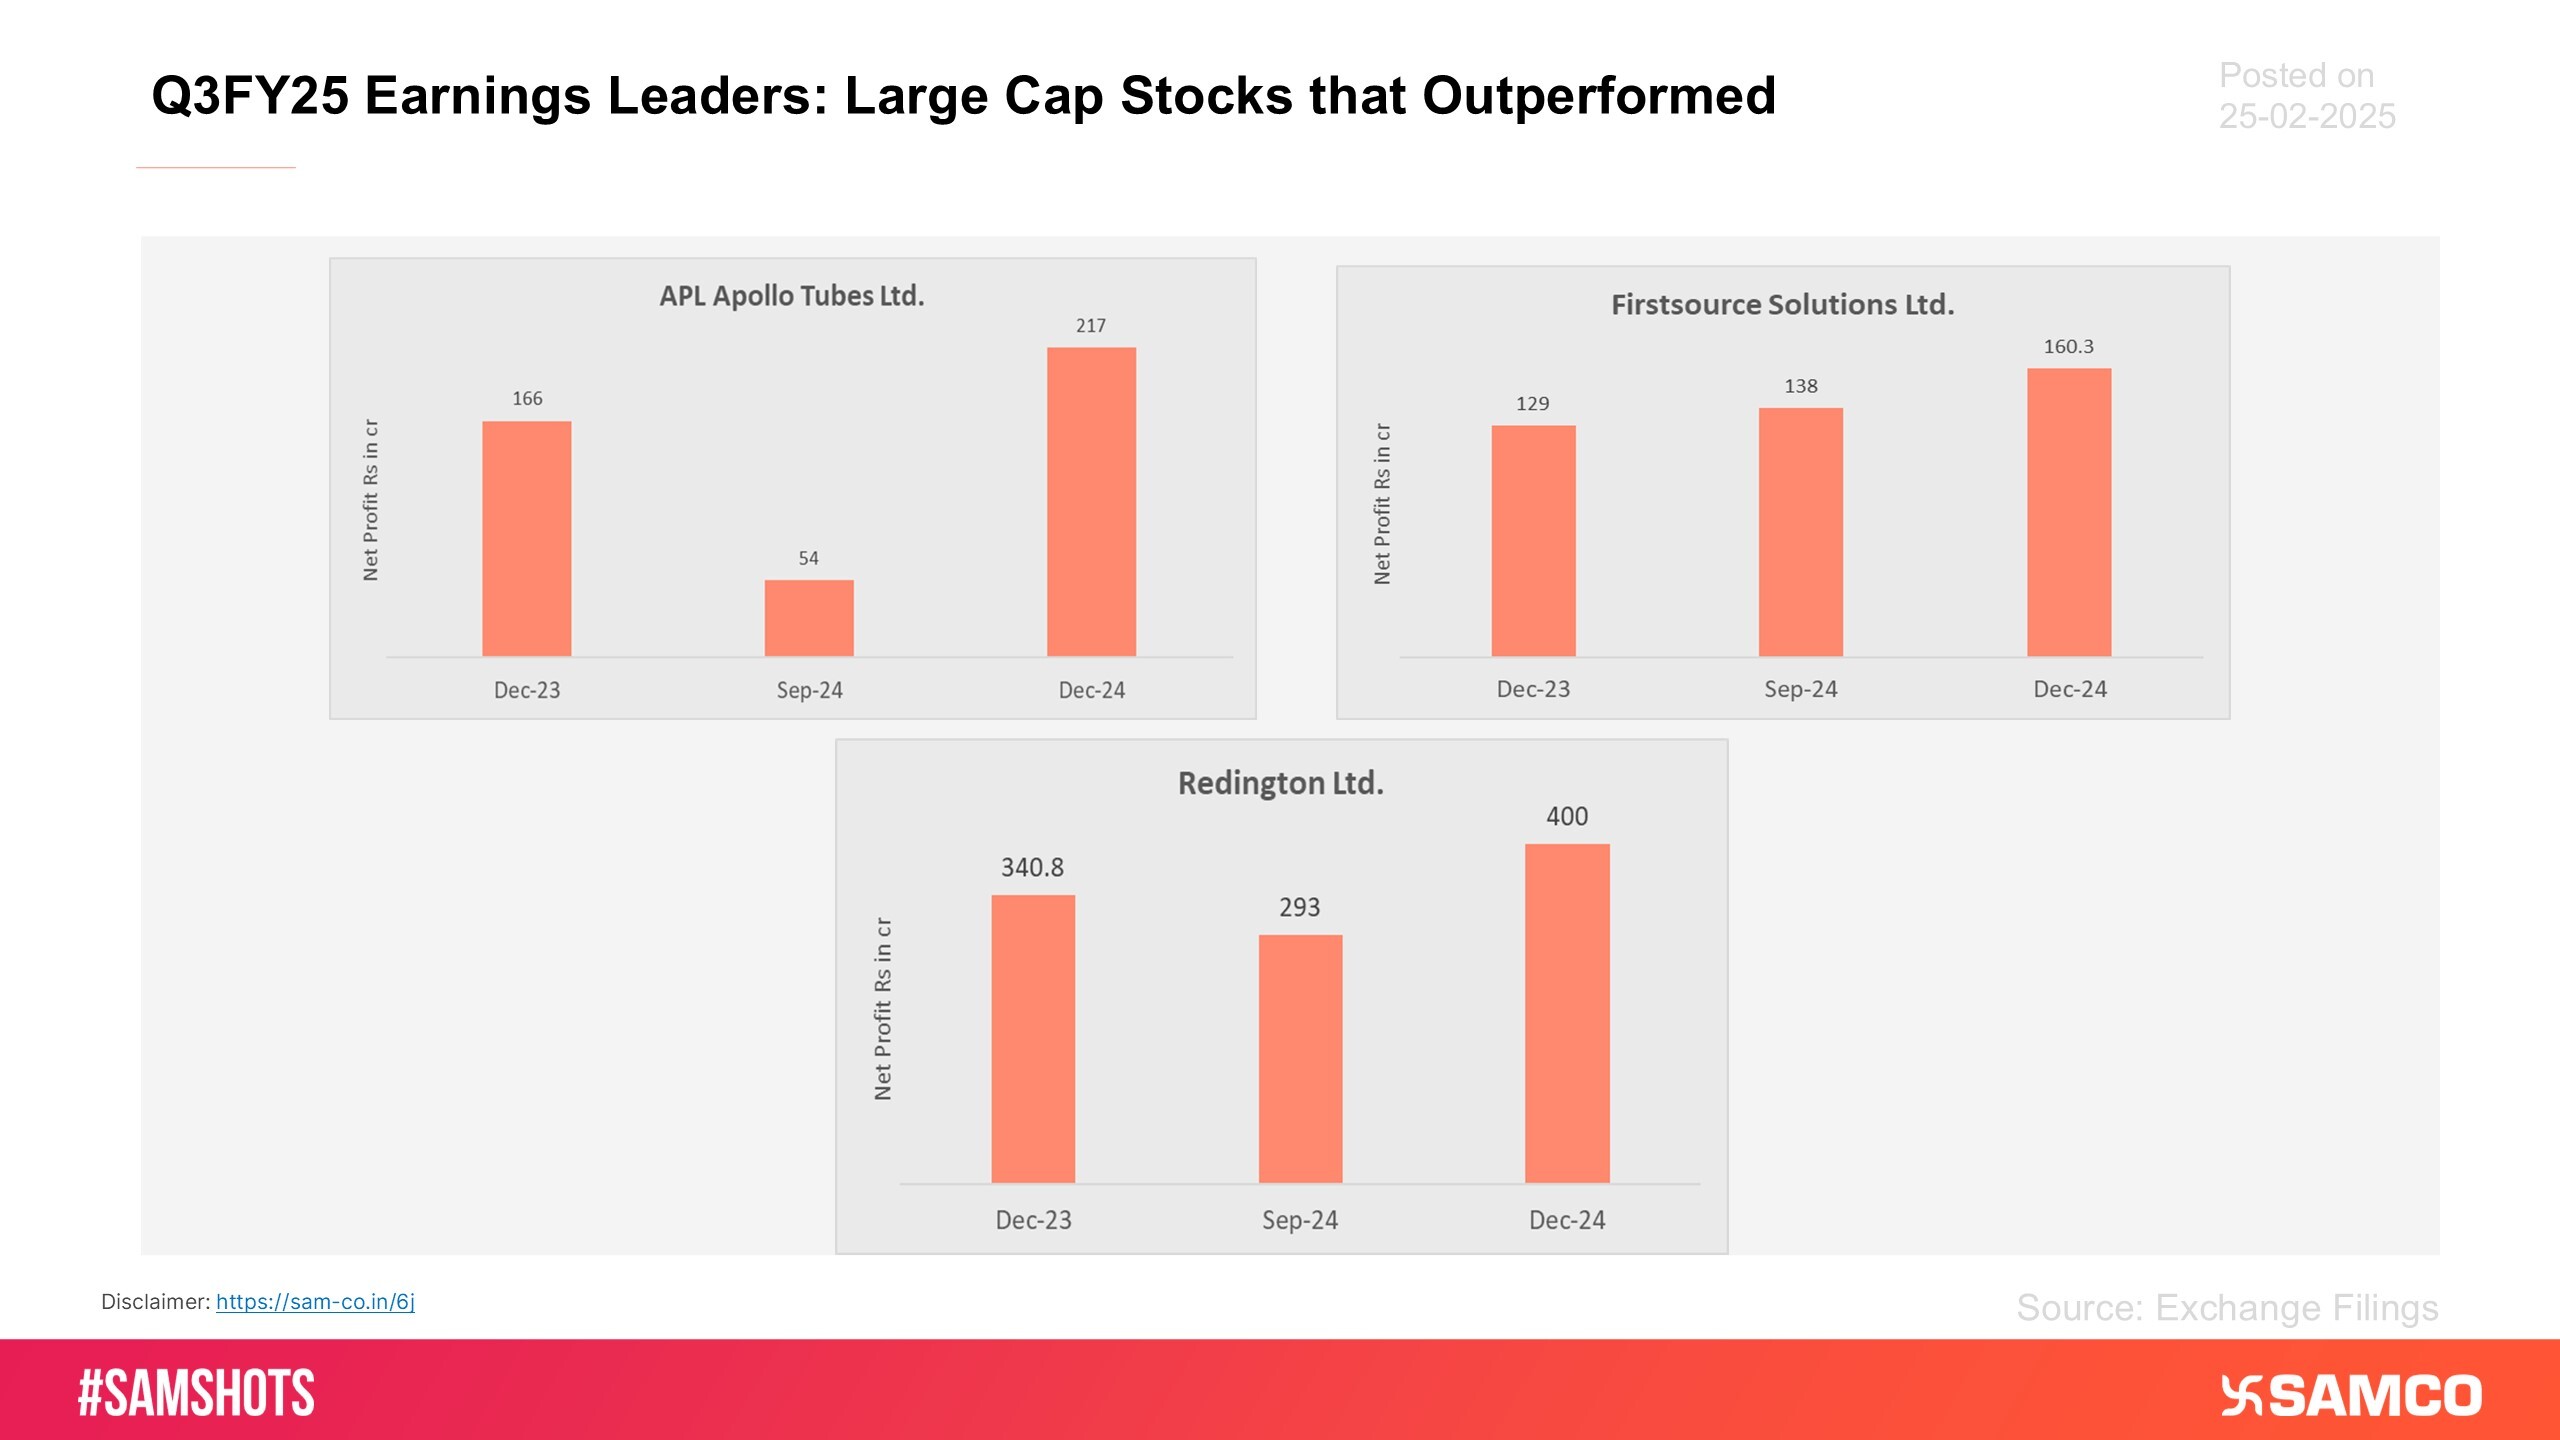
Below is a list of companies with a market cap of over 20,000 crores that have declared the highest ever PAT in Q3FY25.
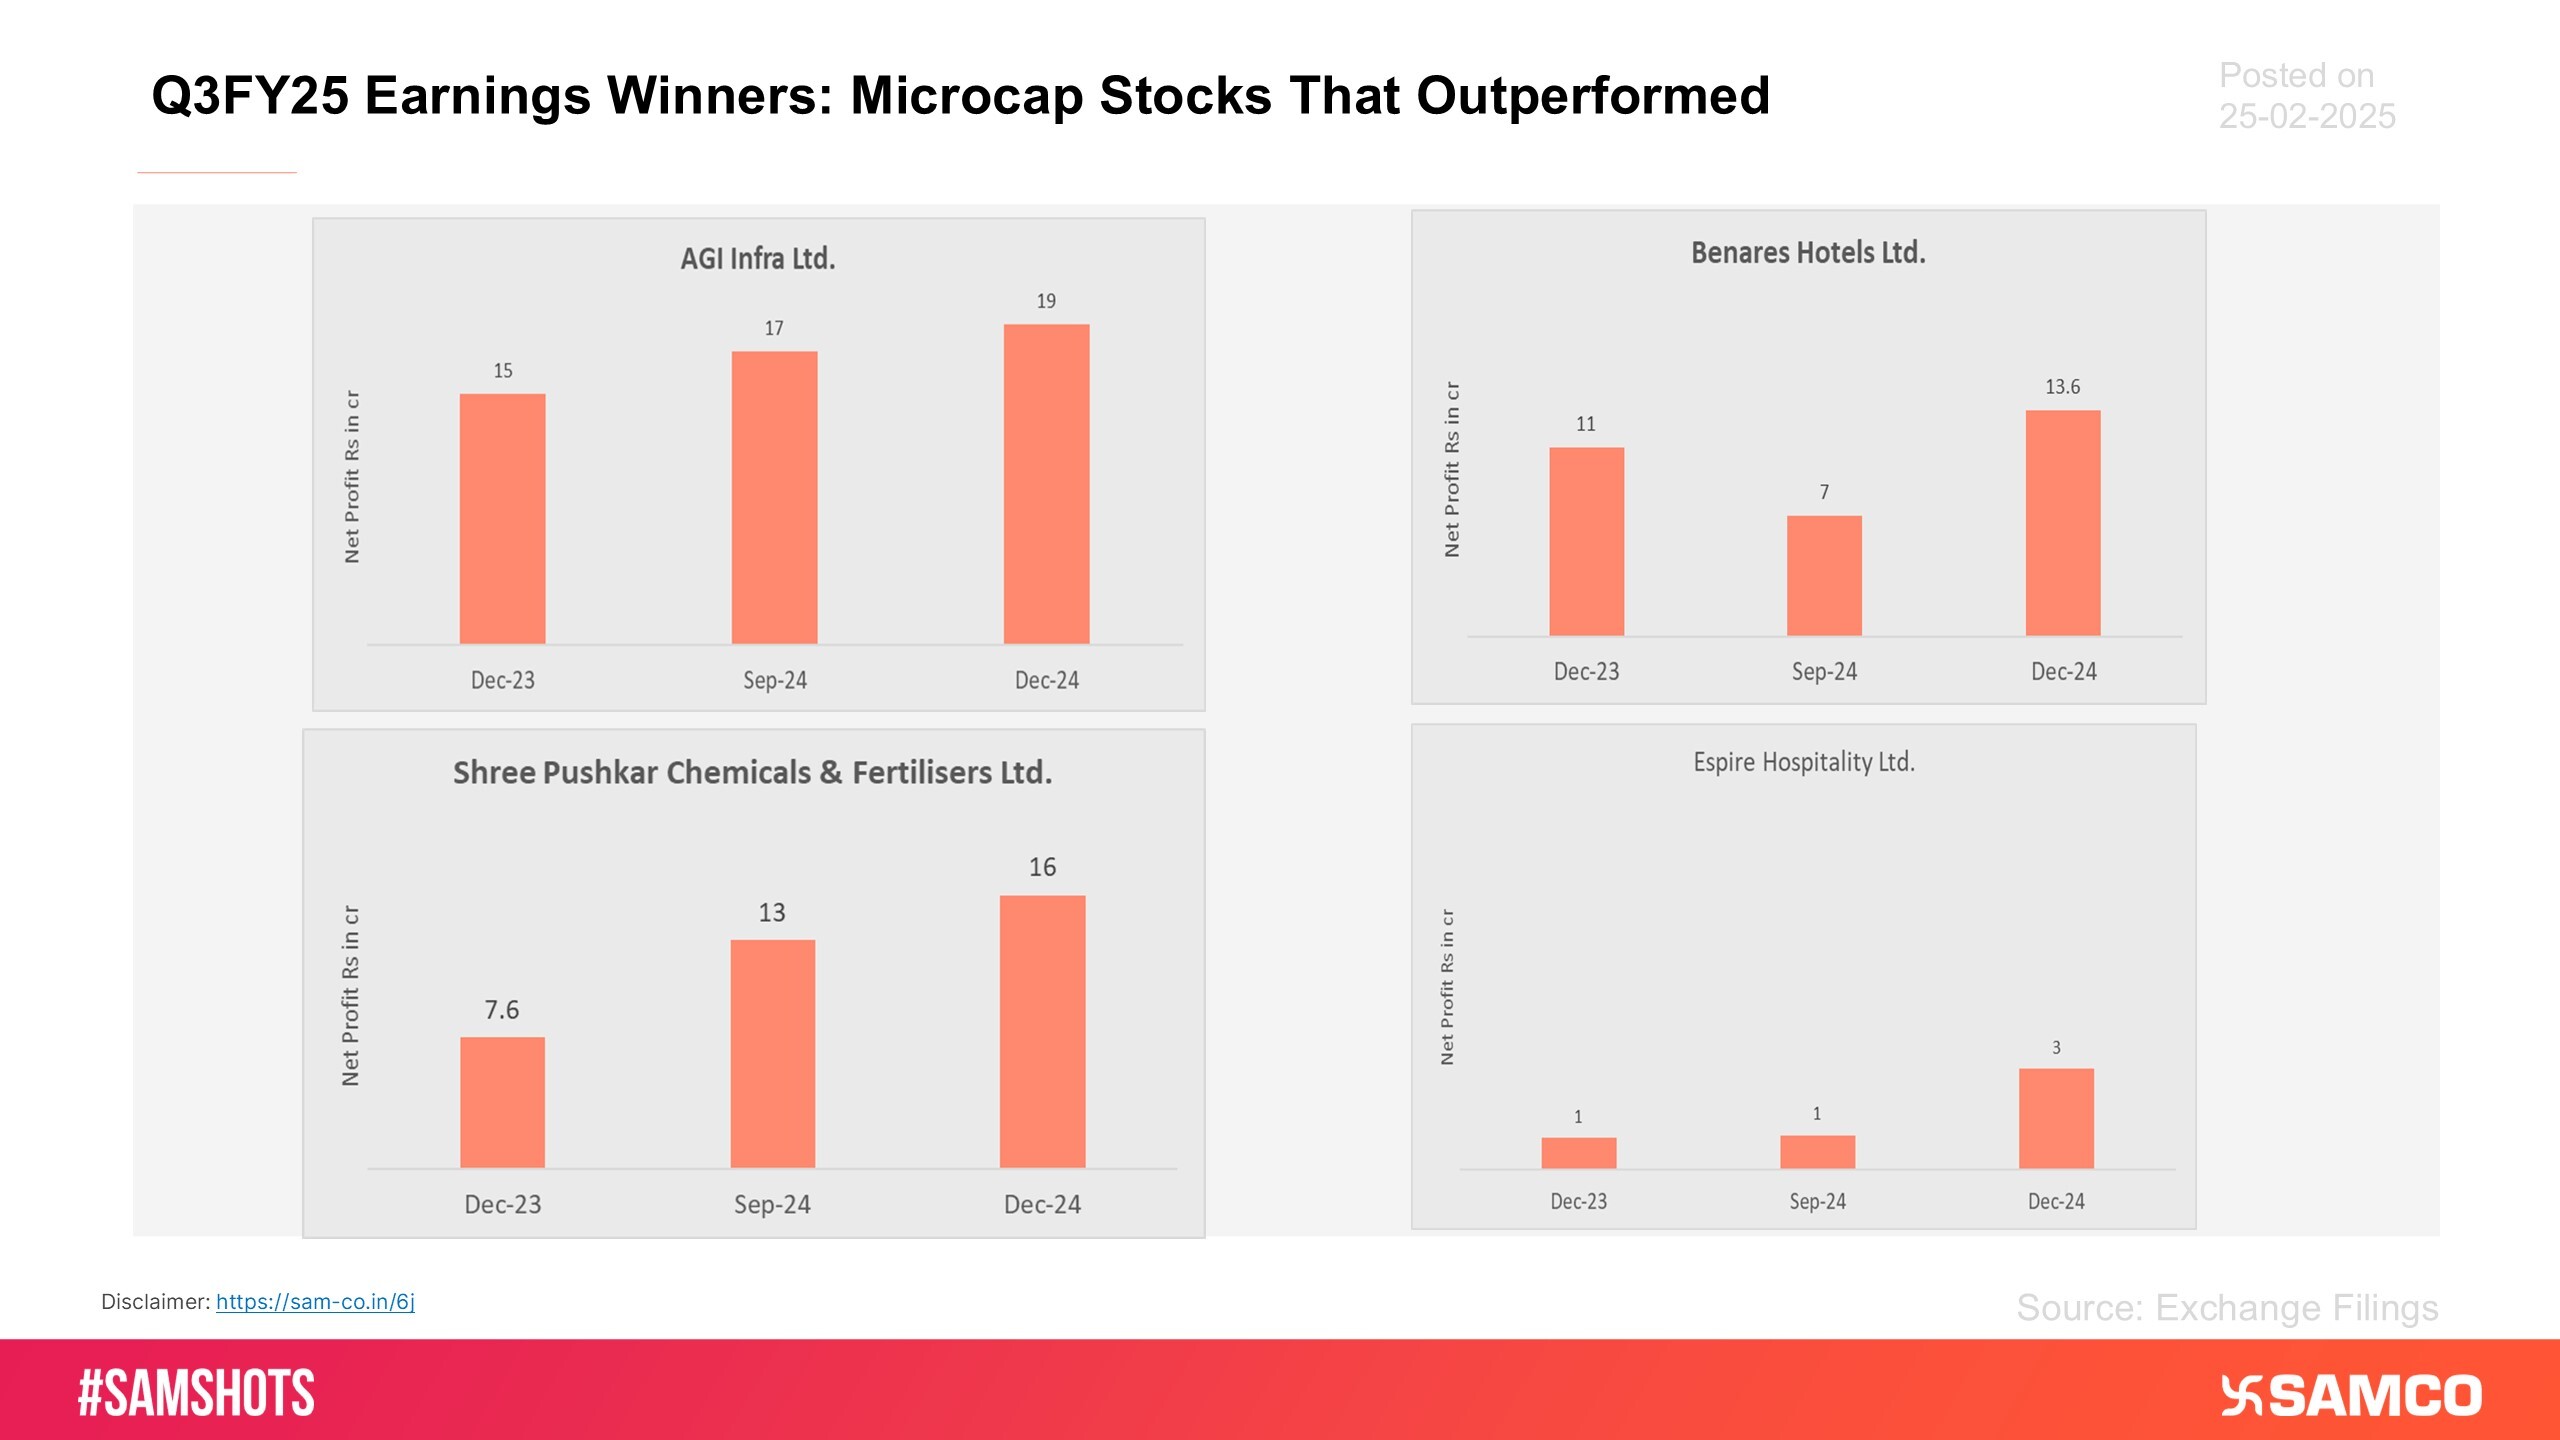
The accompanying chart presents the companies with a market capitalization greater than 500 crs and less than 2000 crs delivering all-time high PAT in Q3FY25.
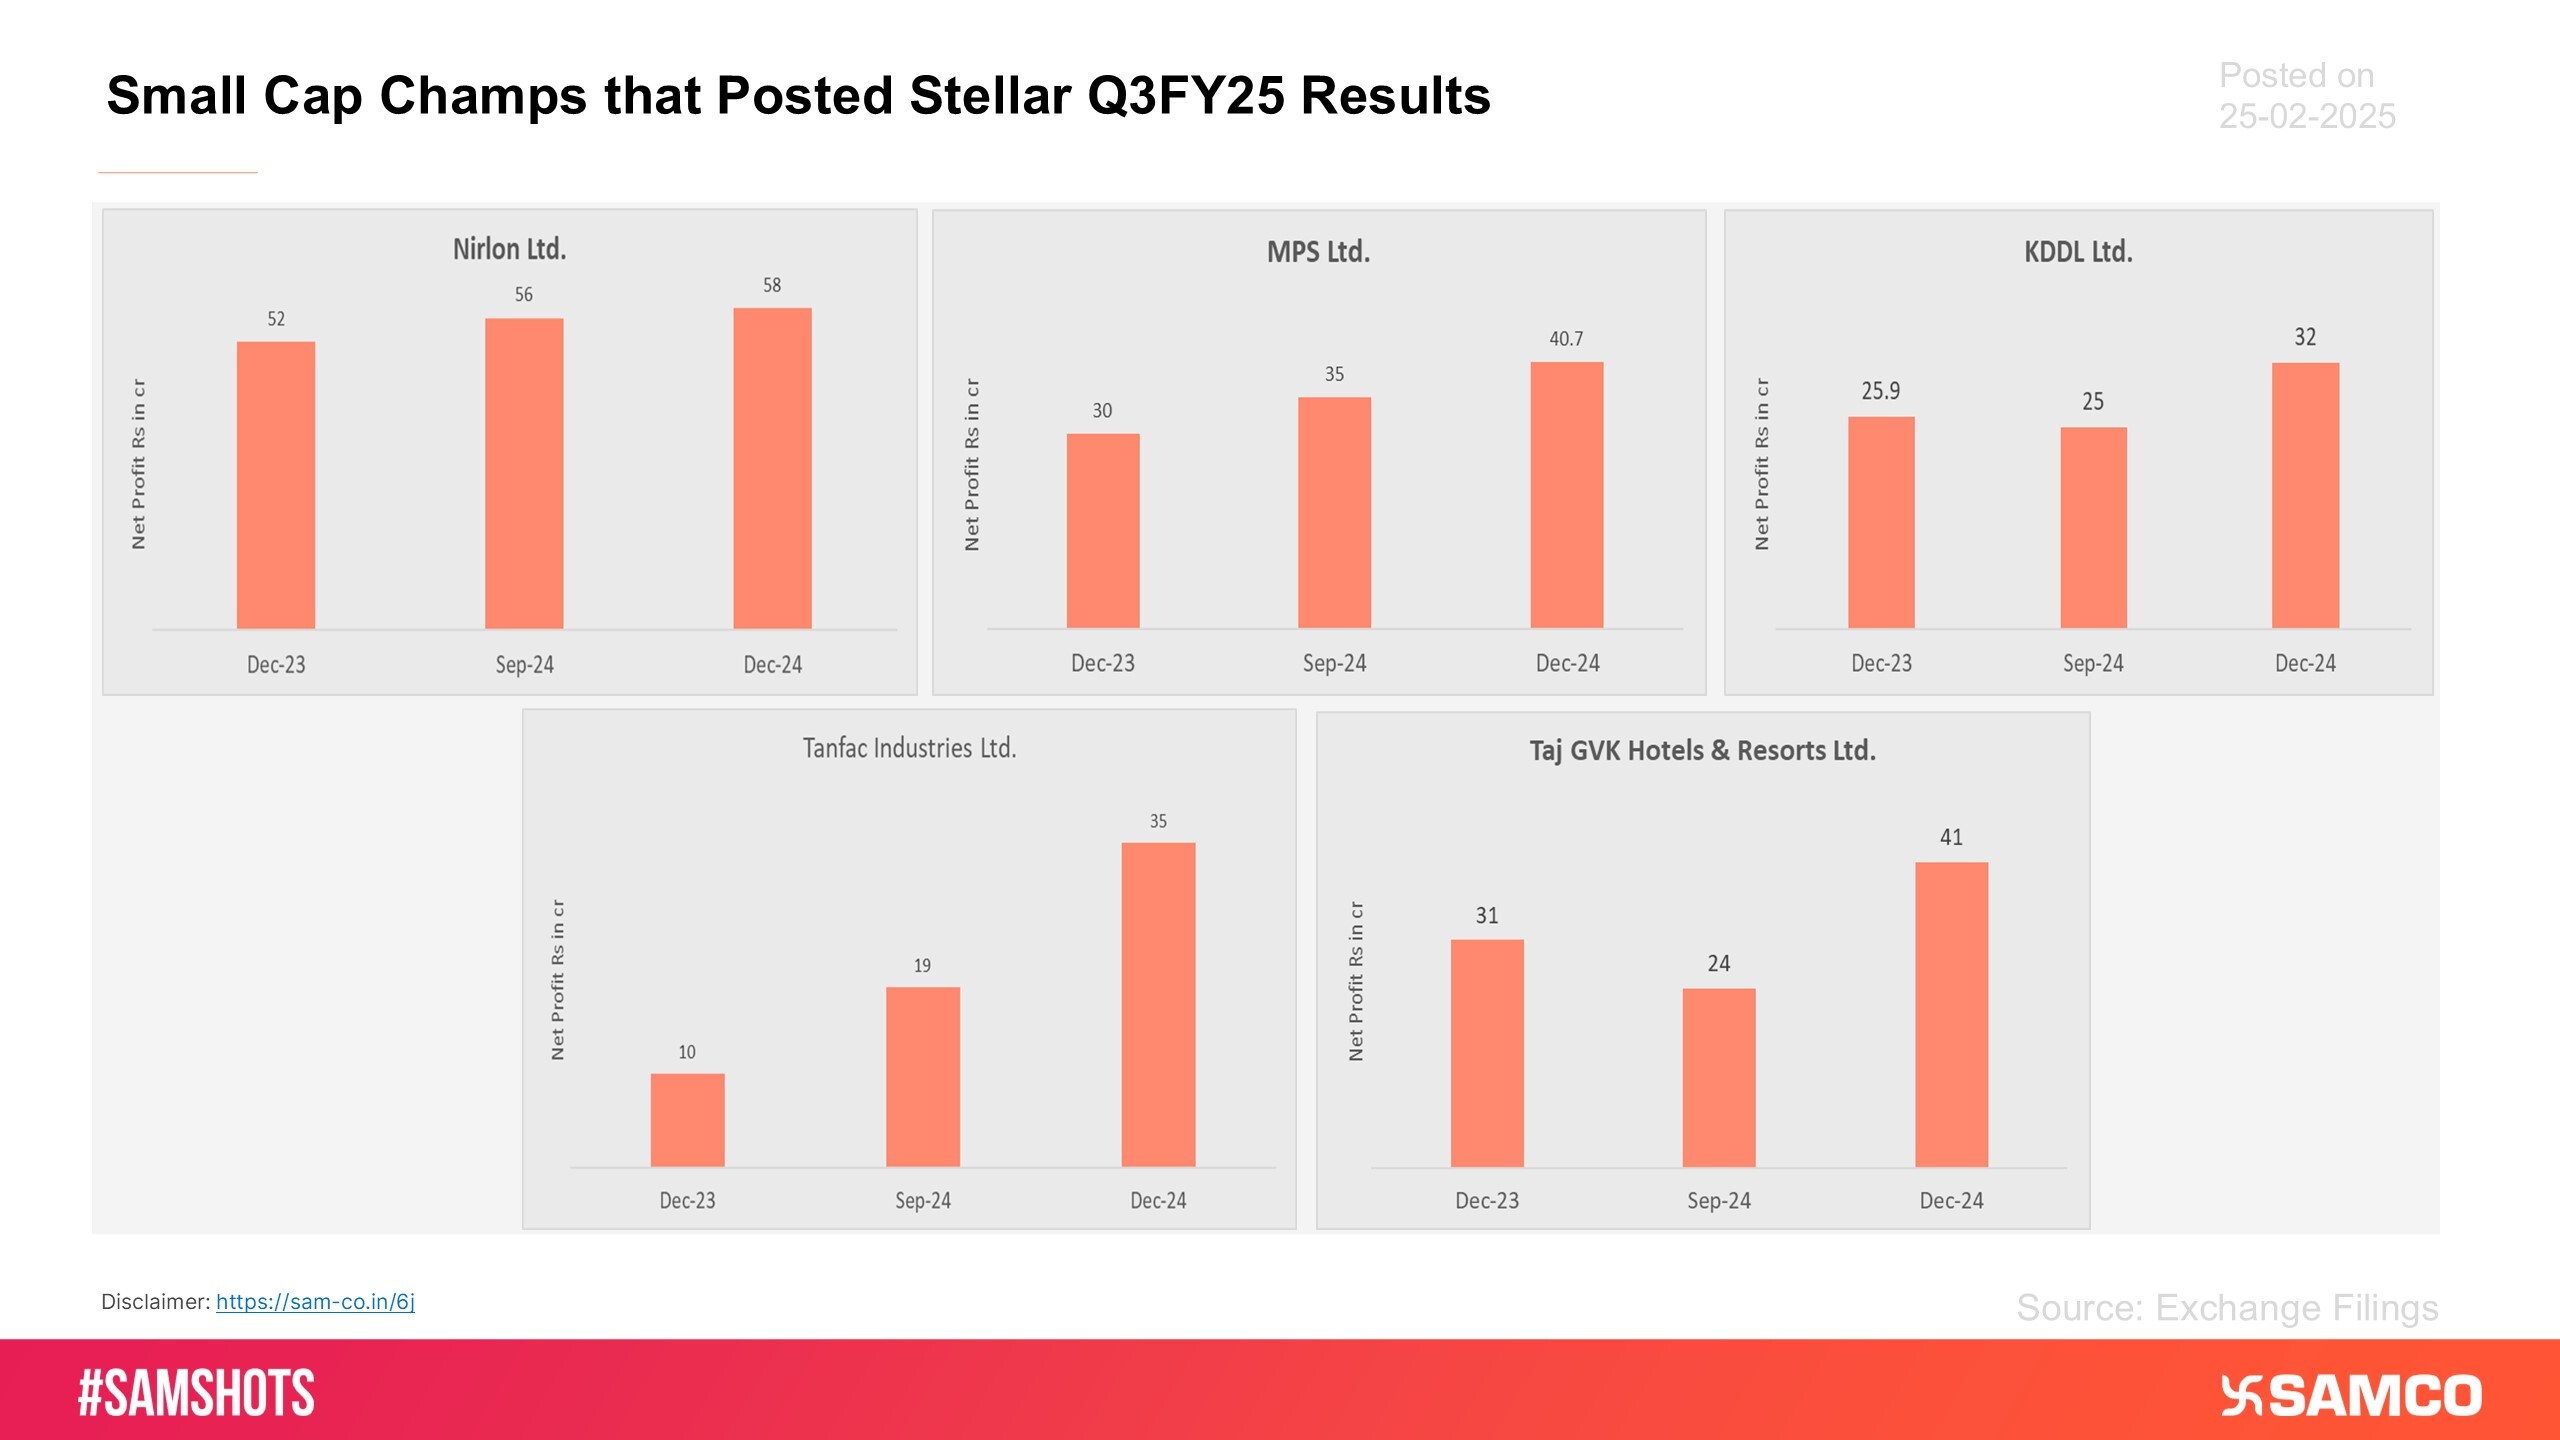
These small-cap stocks with a market cap exceeding 2,000 crs and less than 10,000 crs set new profitability benchmarks in Q3FY25 (Part-1).
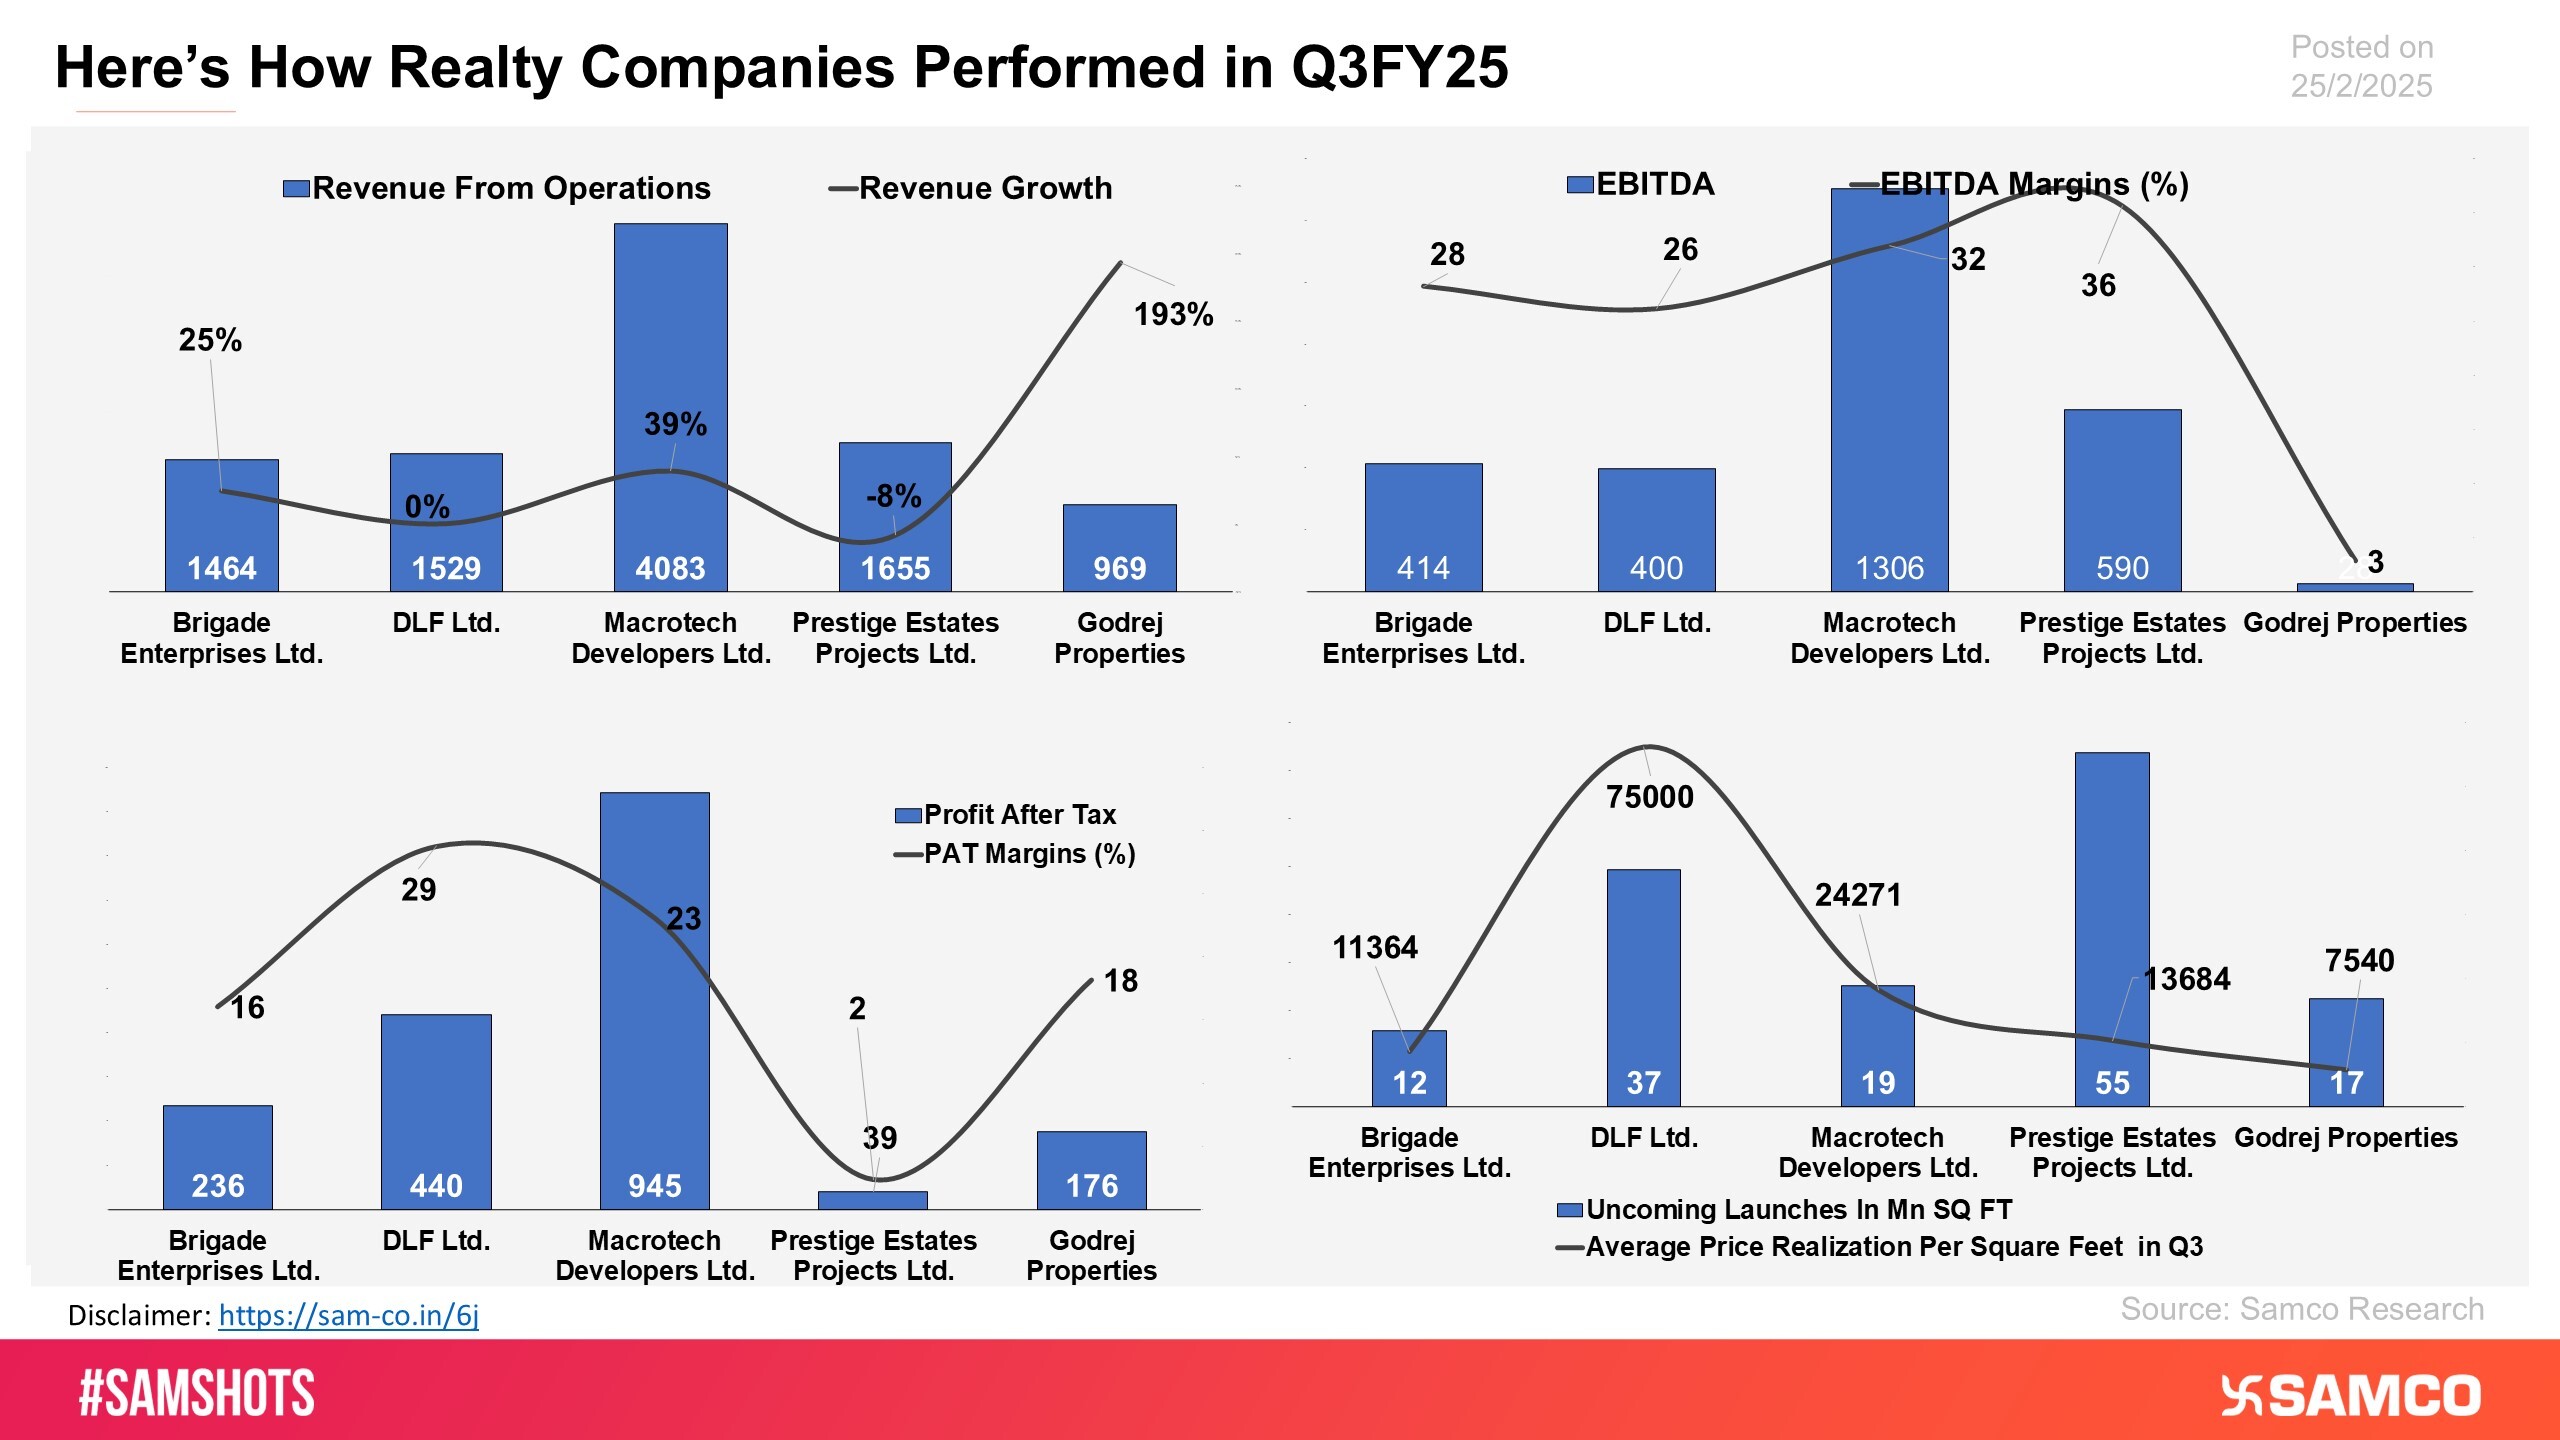
The chart displays the financial performance of realty companies in Q3FY25.
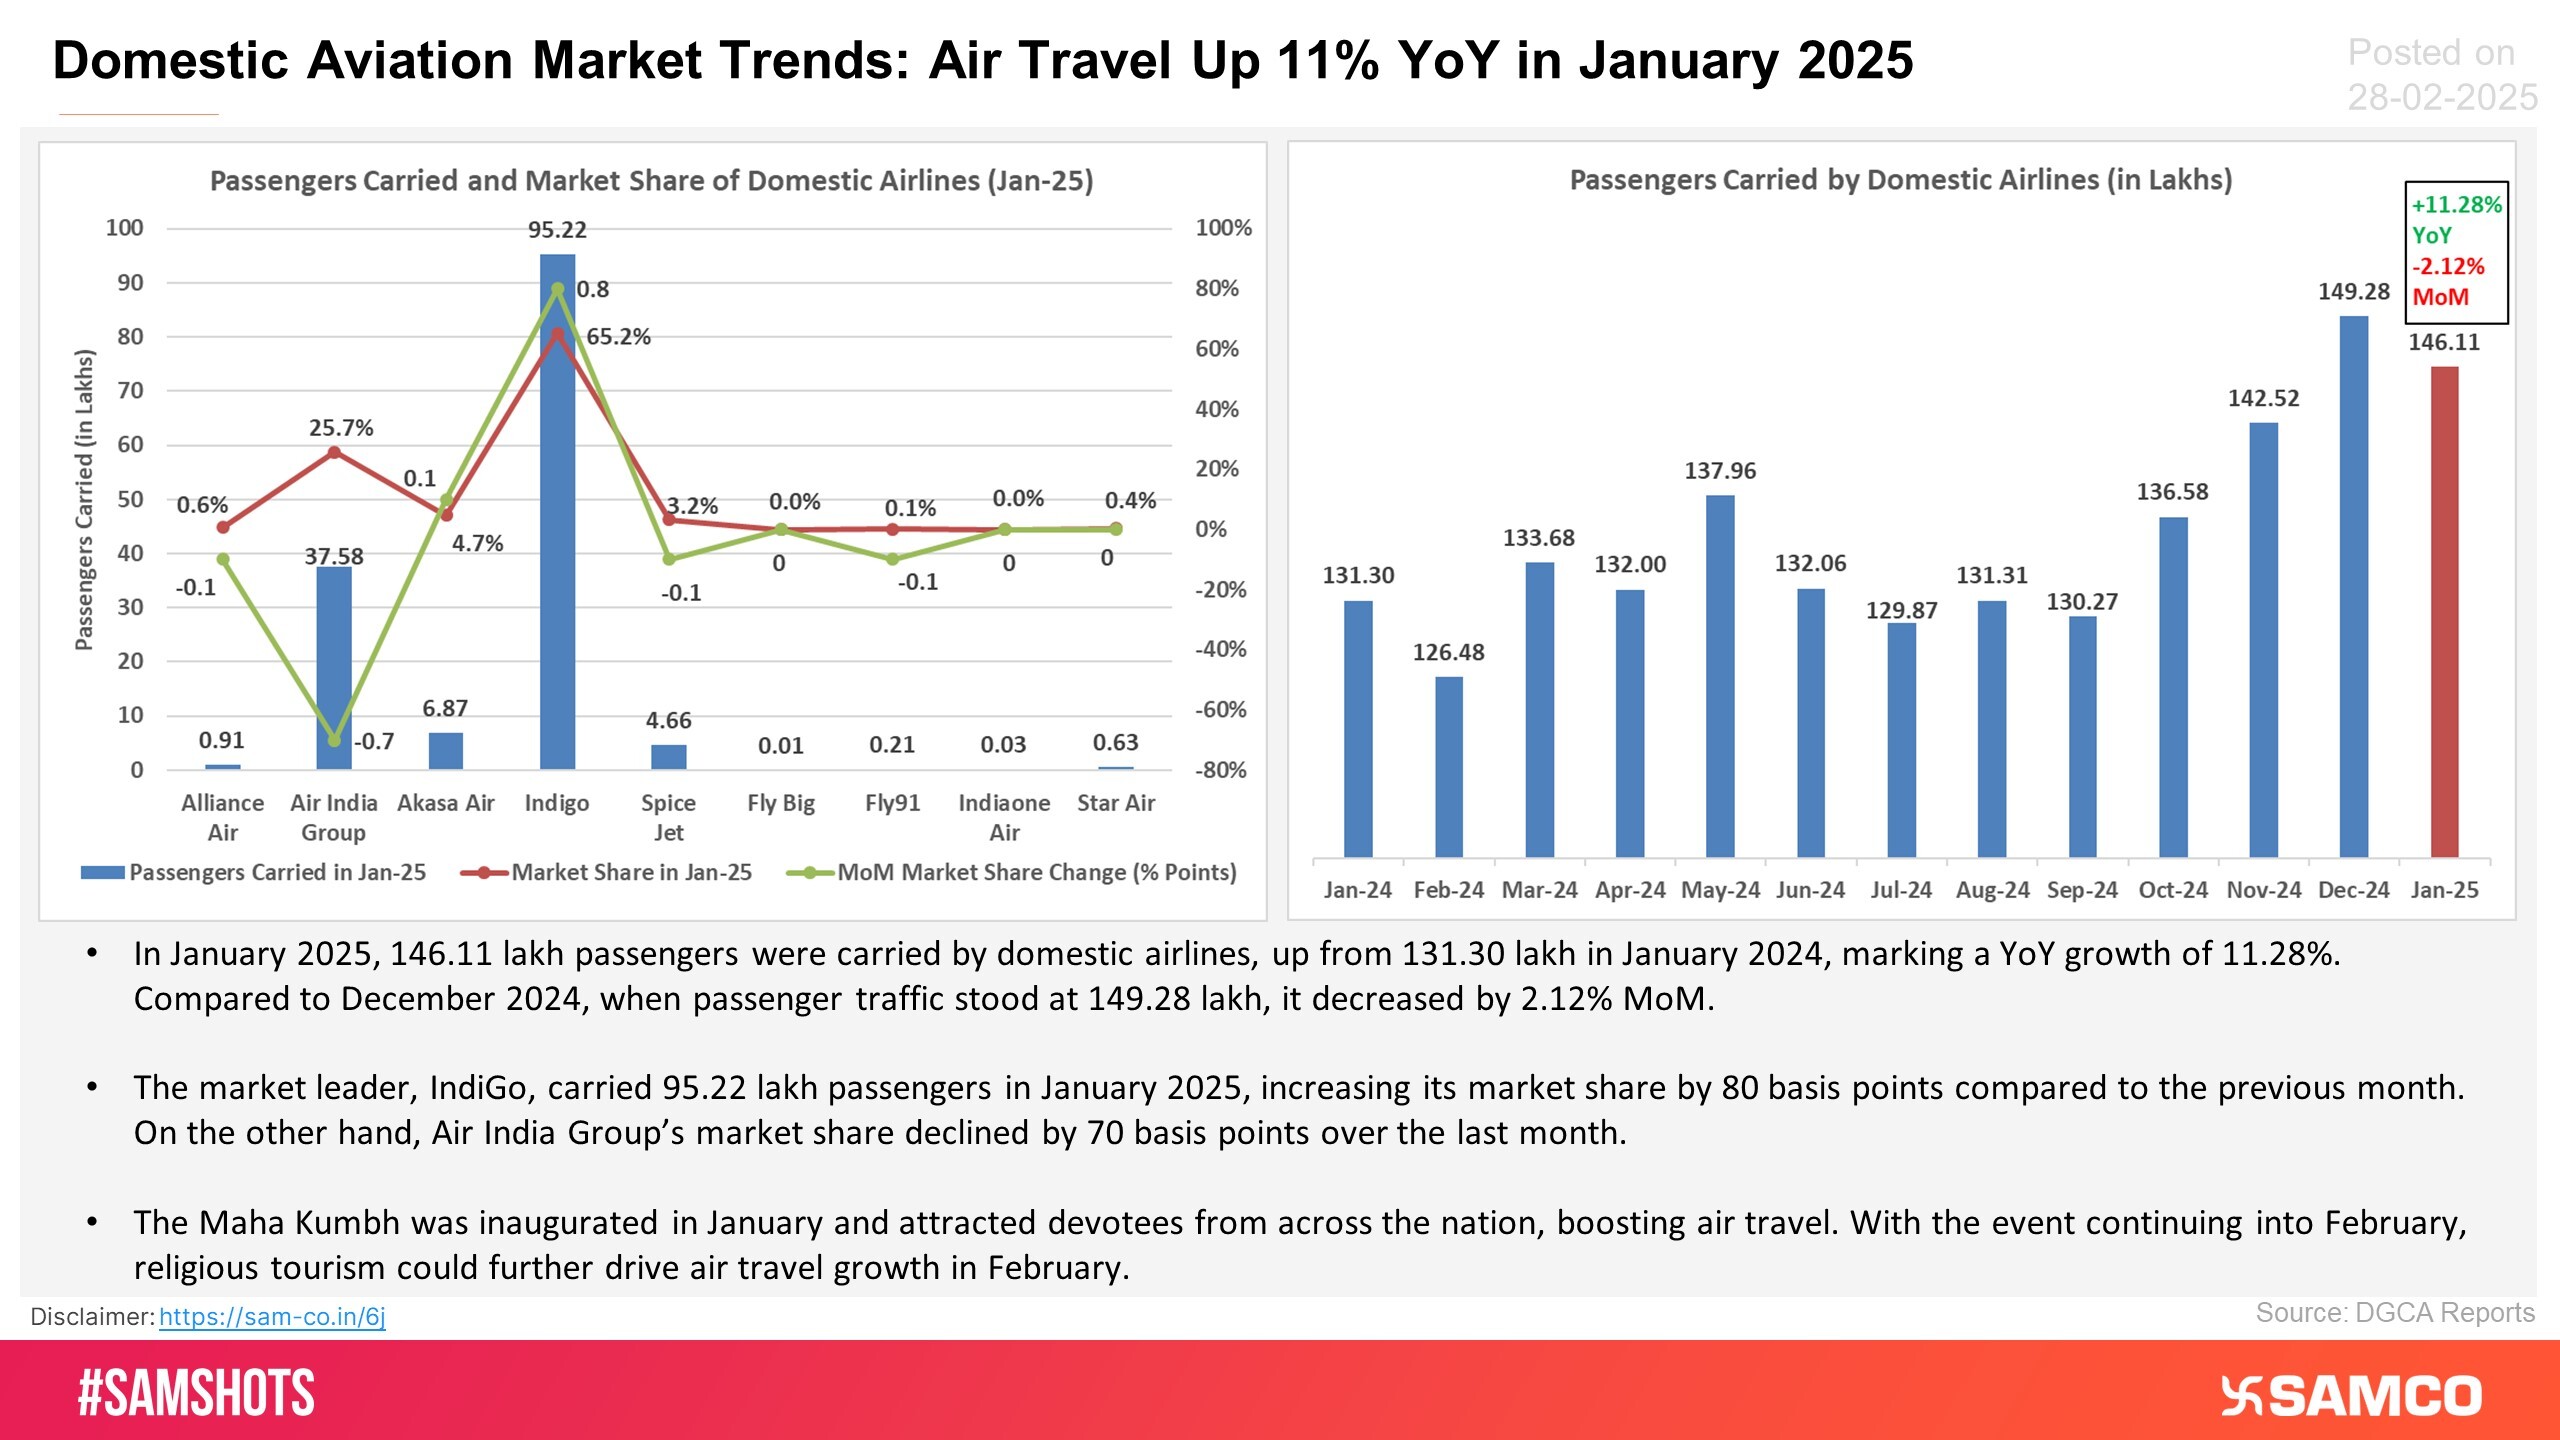
Let’s have a look at the operational performance of domestic airline companies for January 2025.
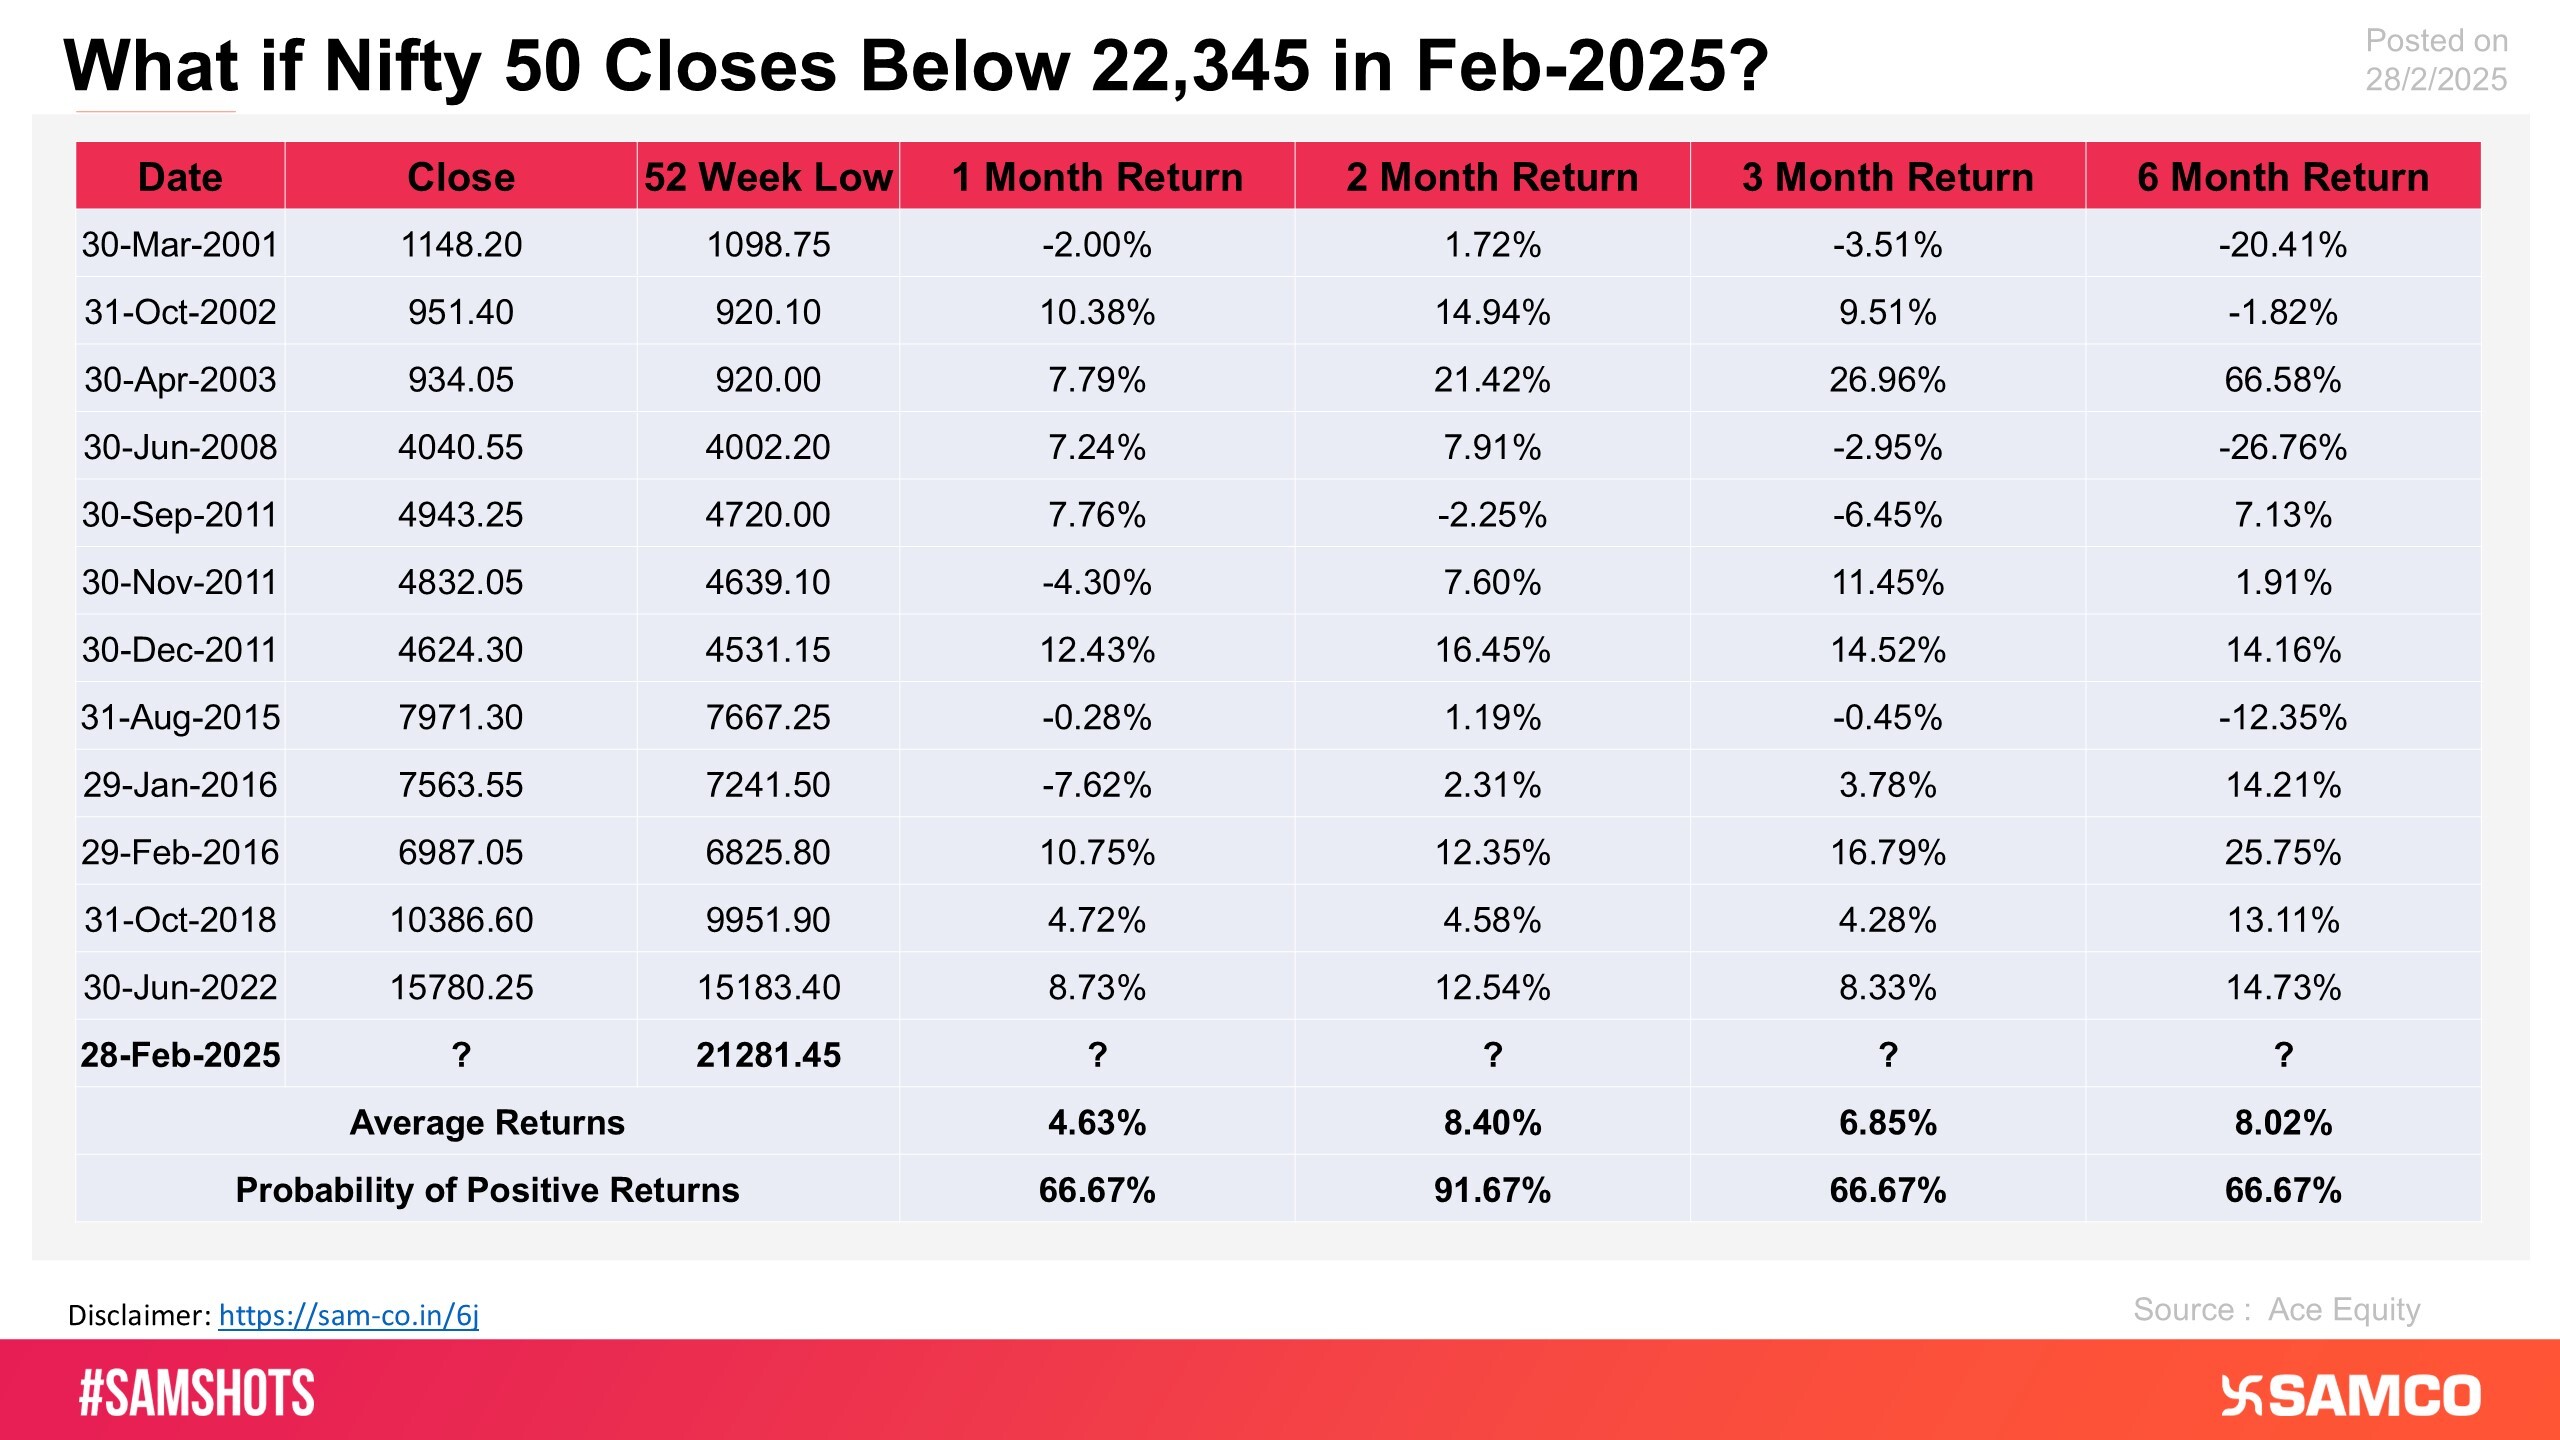
The chart displays the historical trend observed in Nifty 50 if it closes below 5% above its 52-week Low at month end.
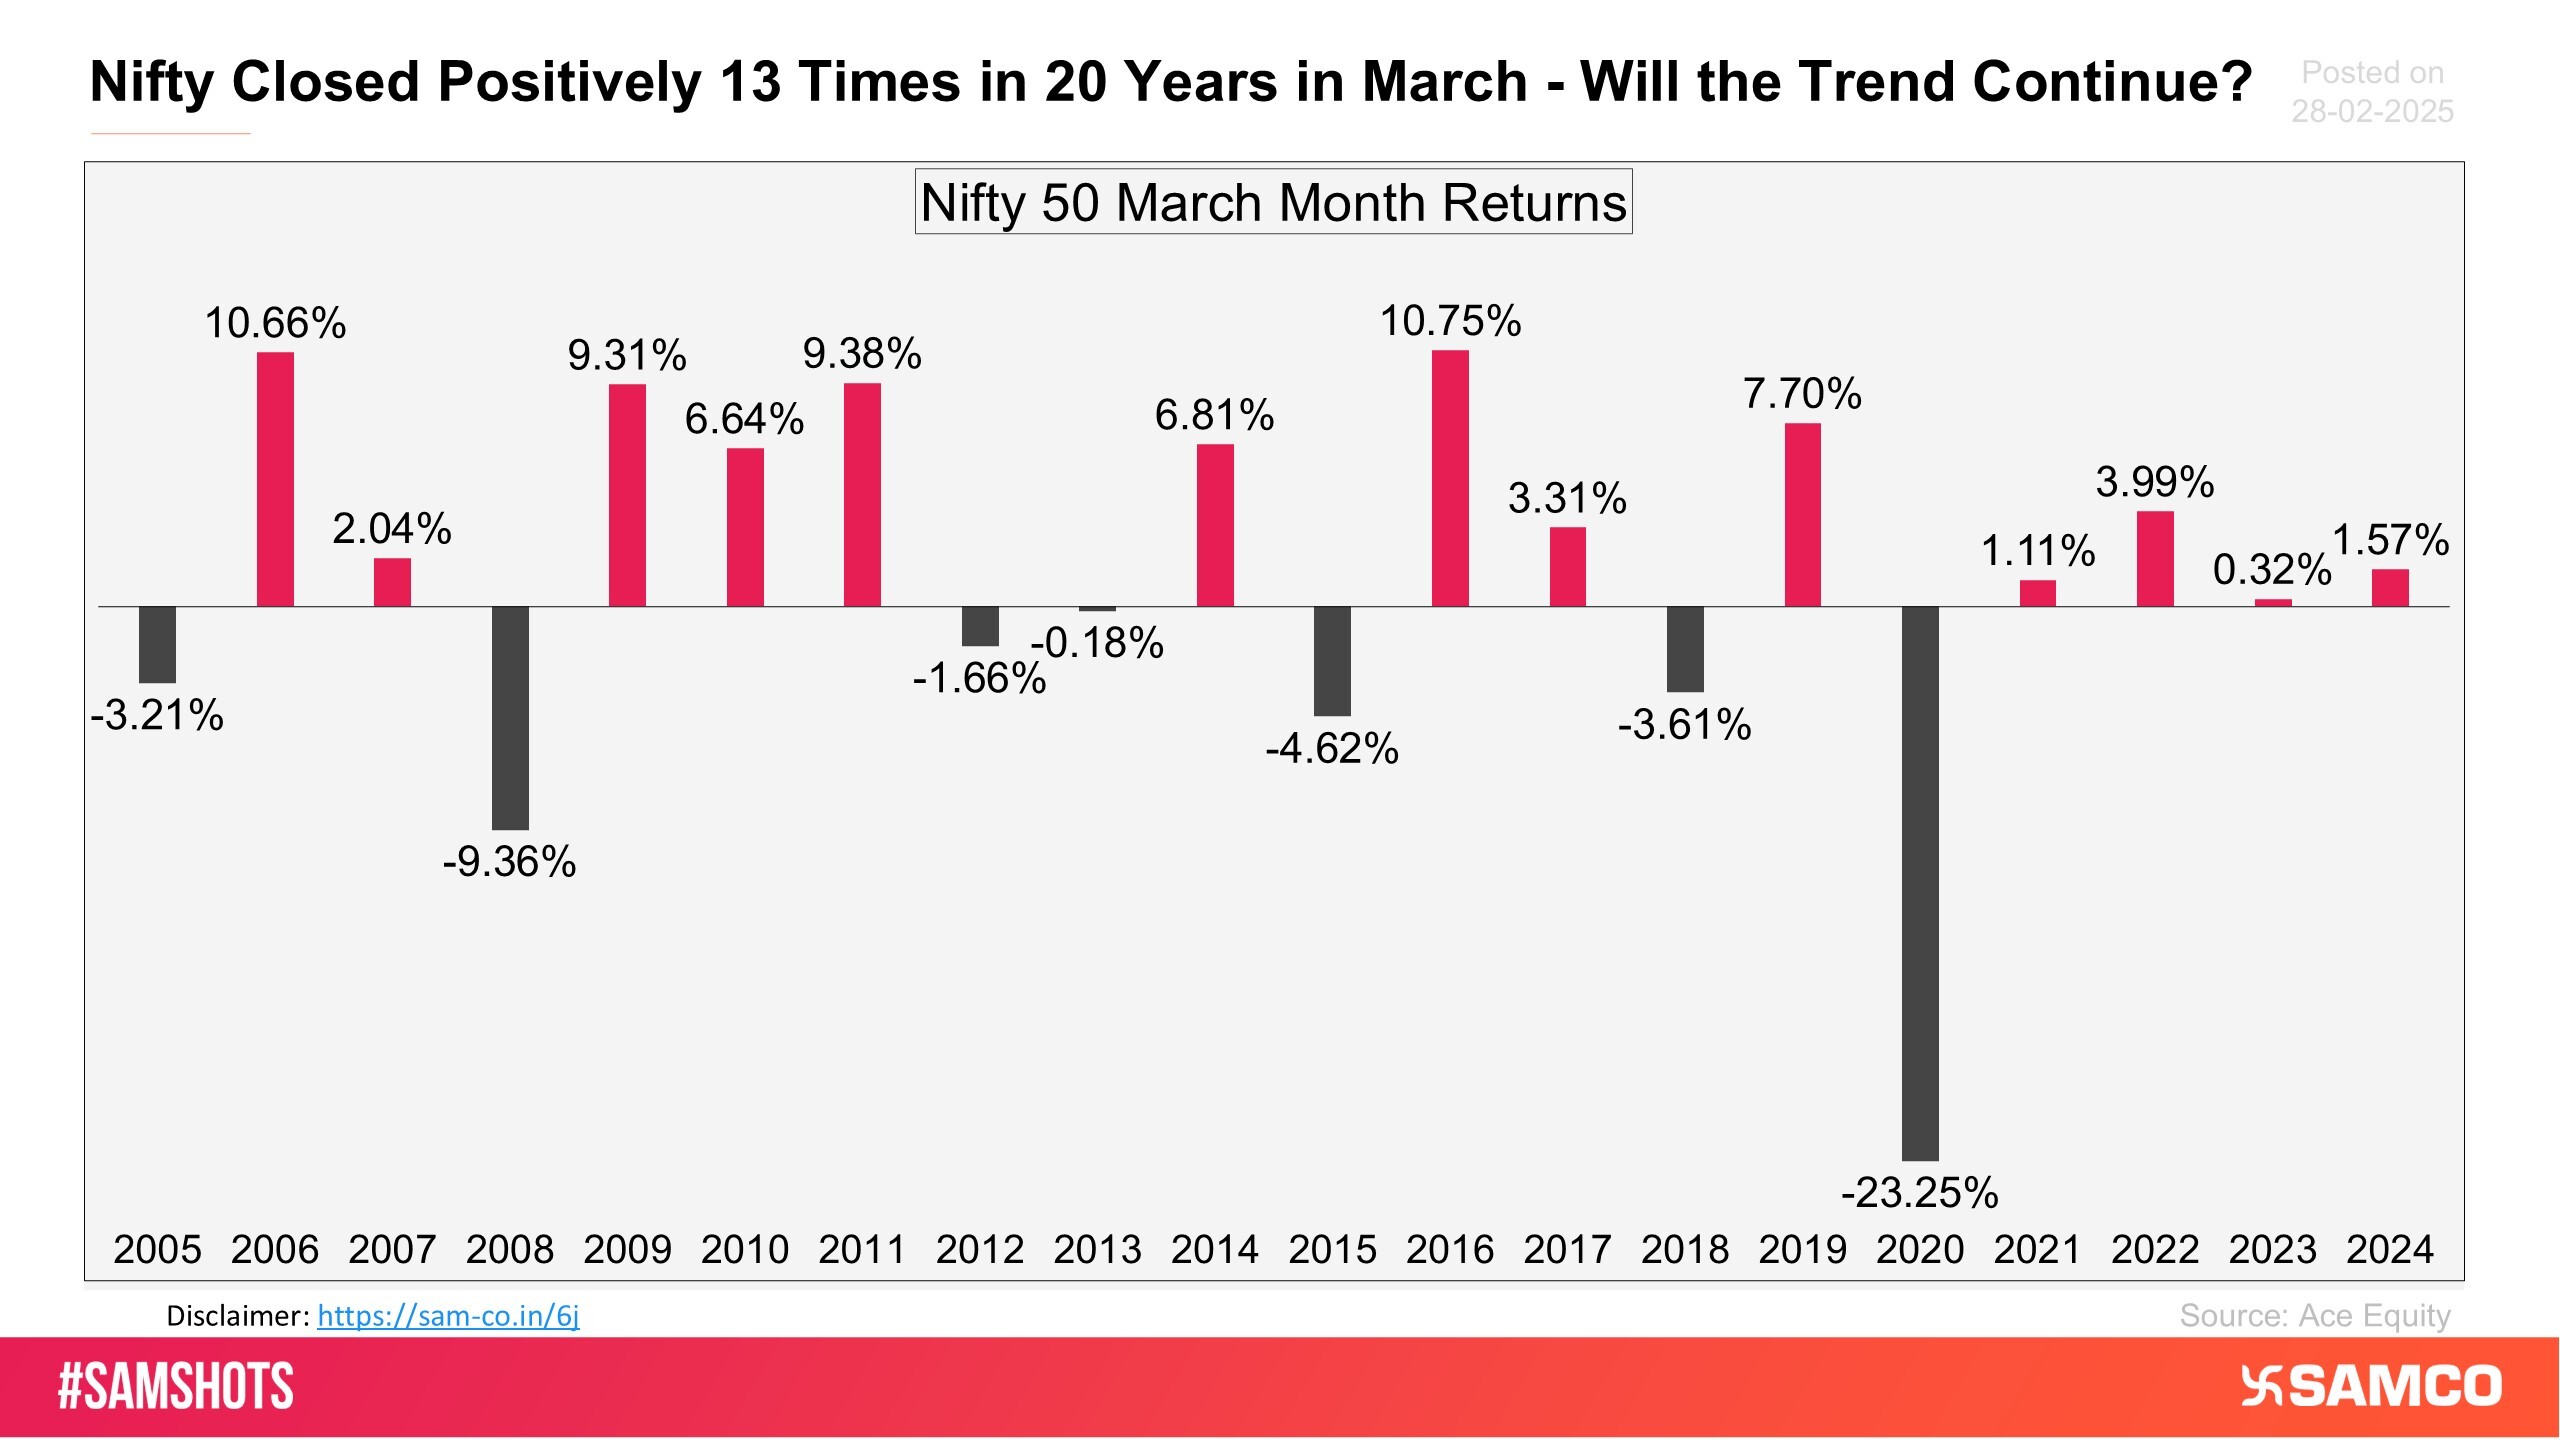
Here’s how Nifty 50 performed in March month over the past 20 years.
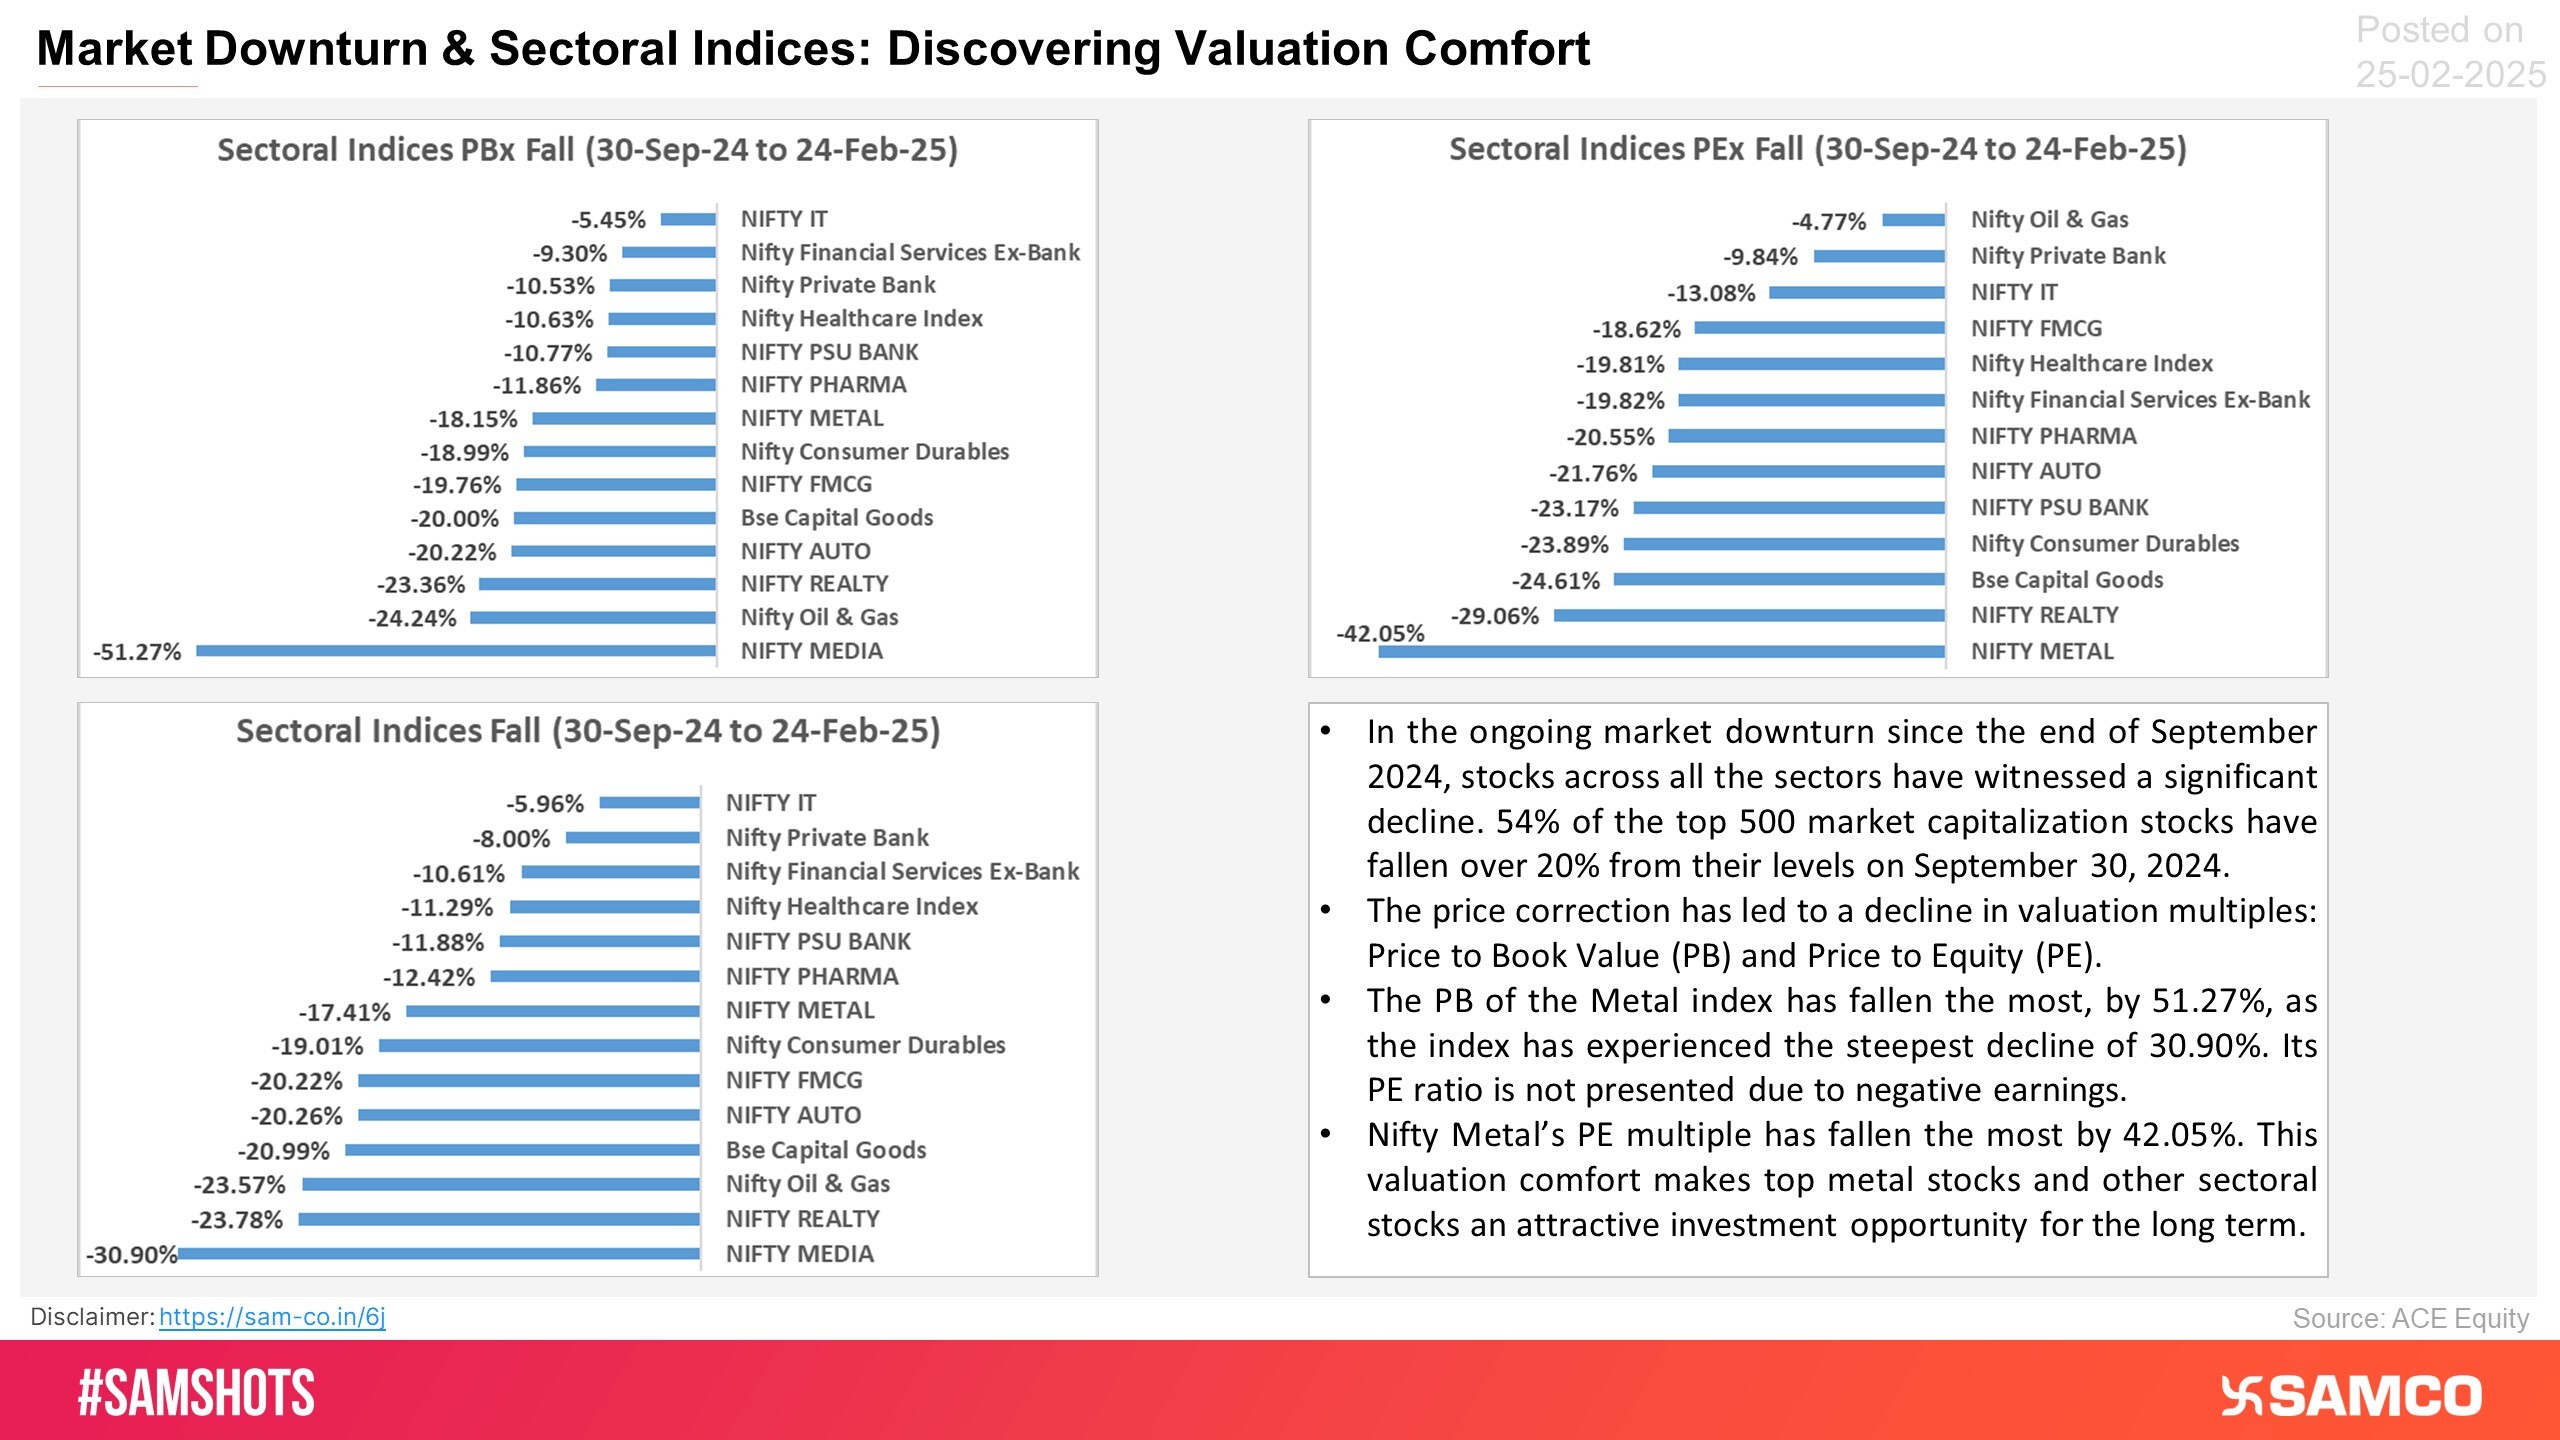
Take a glimpse at the declines in index levels and valuation multiples for key sectoral indices since October 2024.
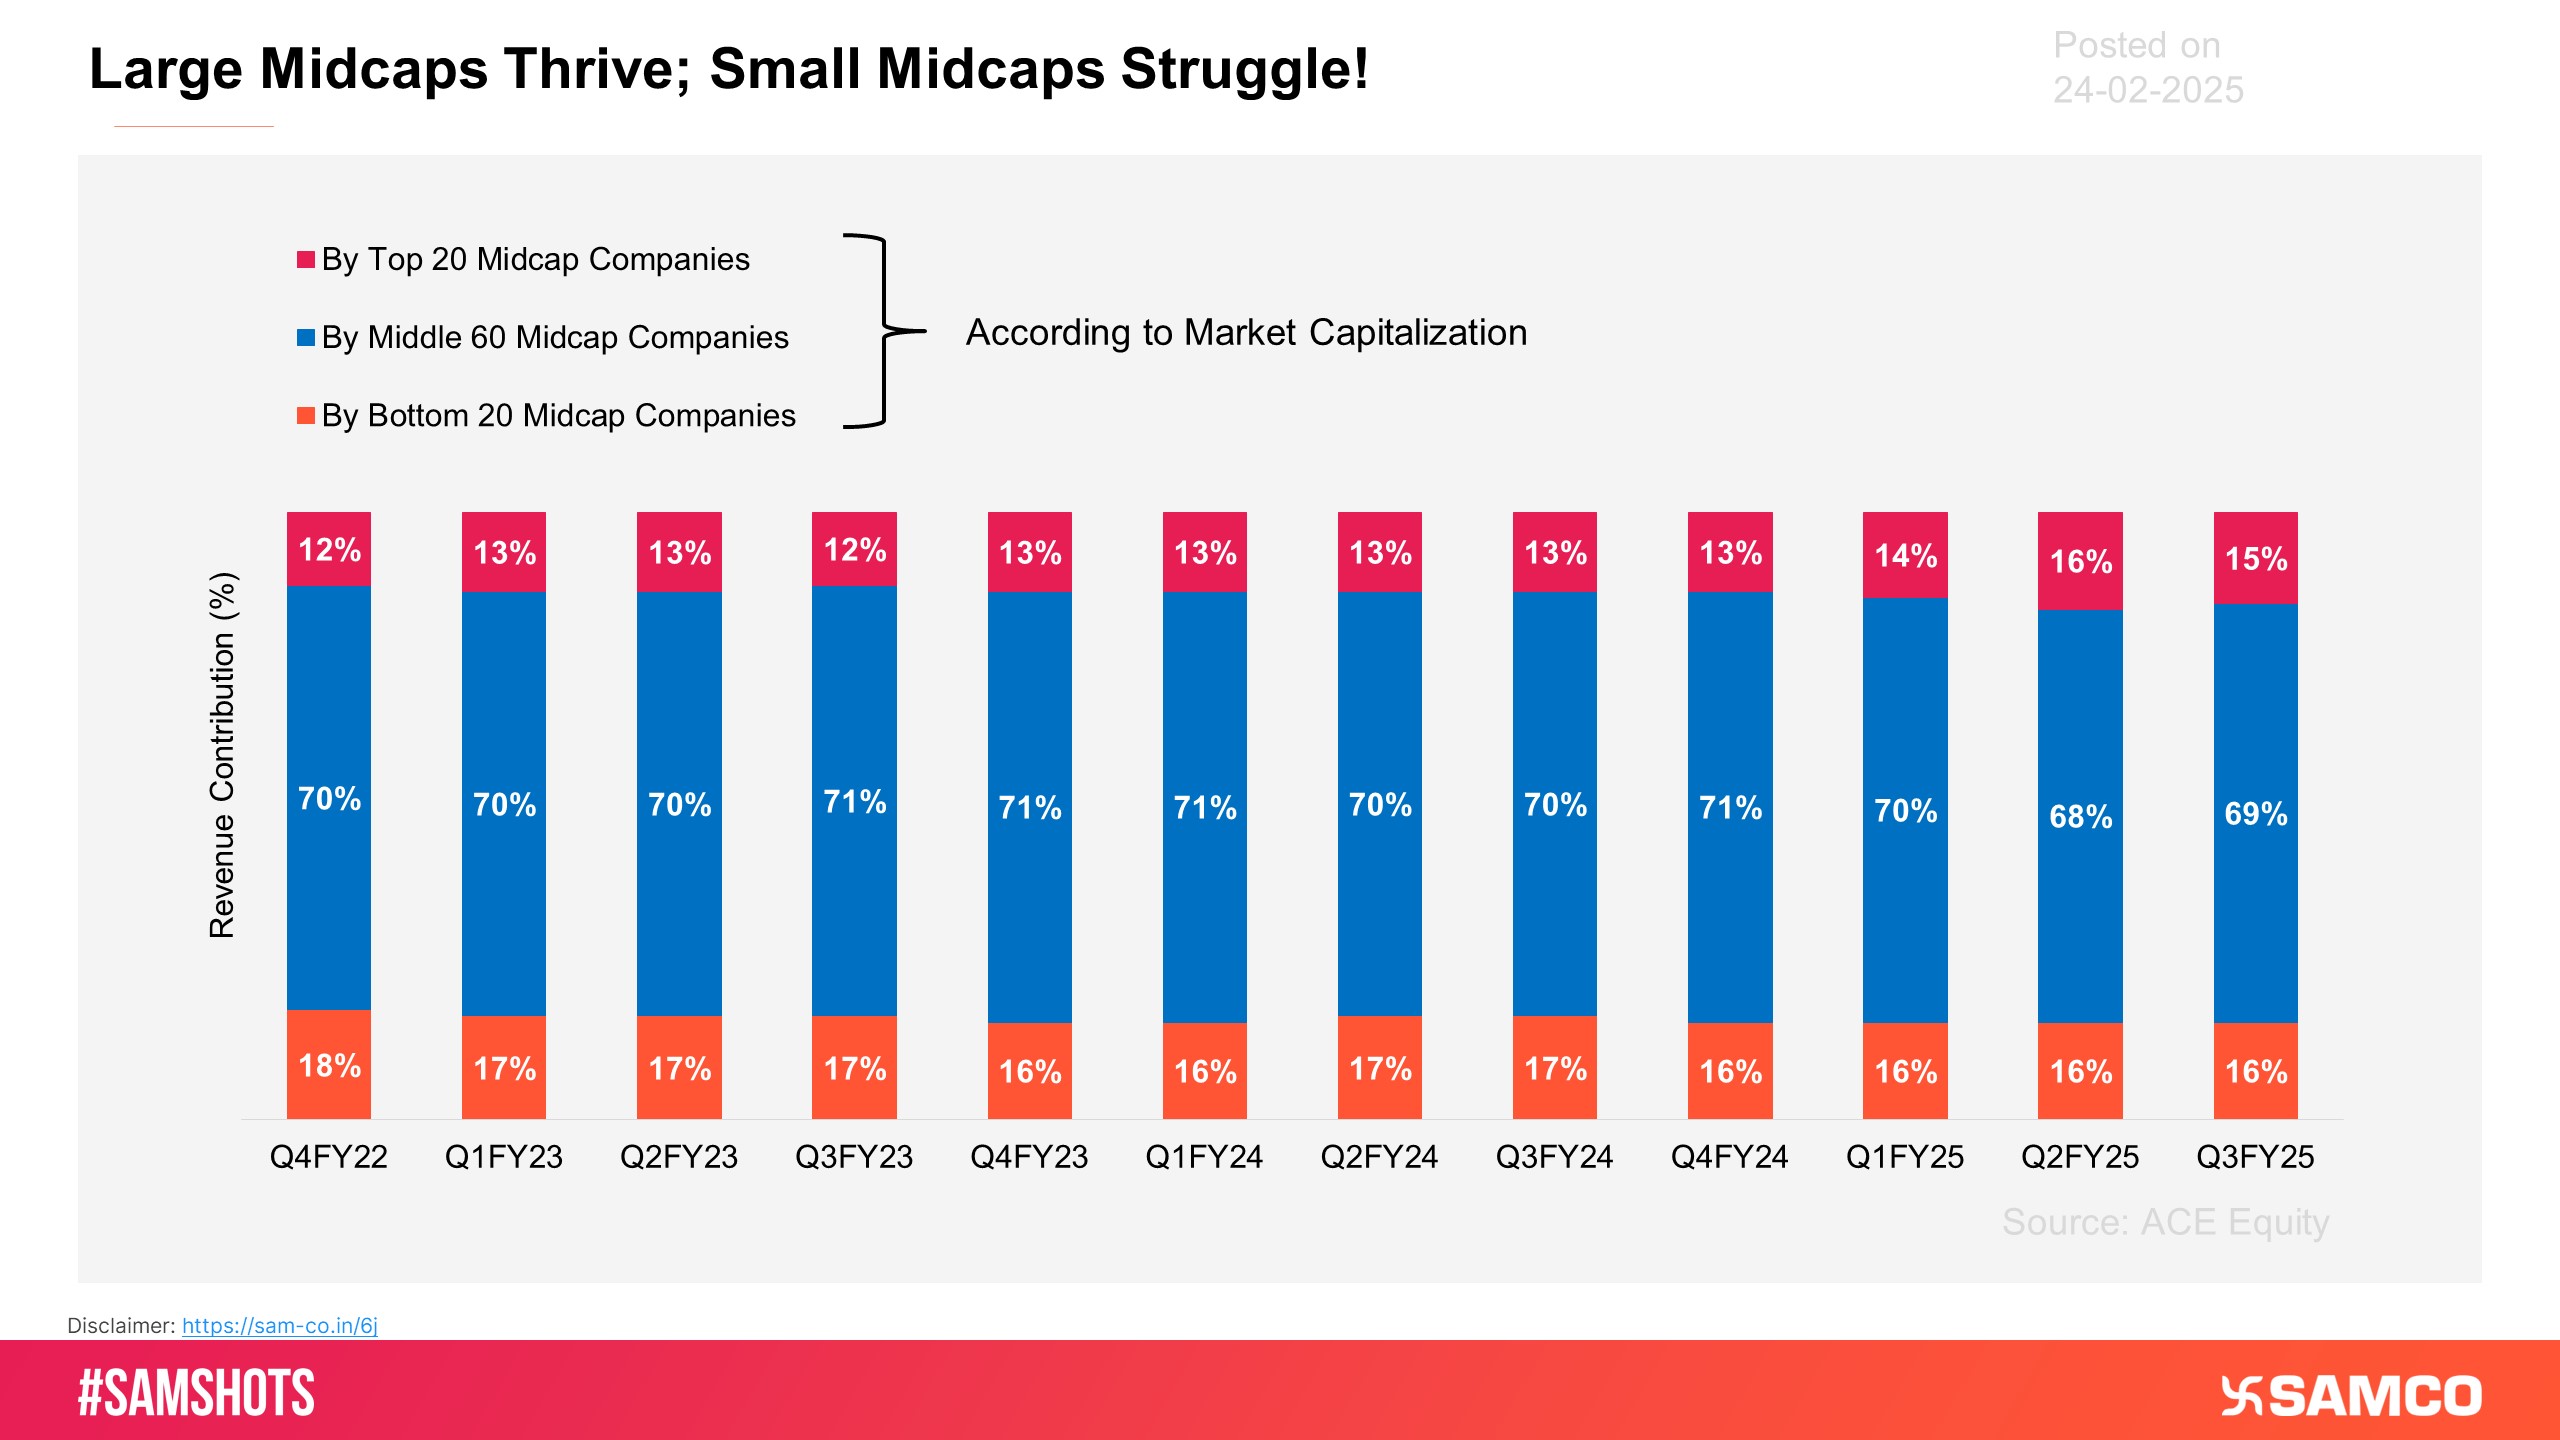
The below data reveals that the middle 60 companies have consistently contributed the largest share of revenue in the past 12 quarters. This stability indicates that these companies play a crucial role in driving overall revenue within the midcap segment.
All sectoral indices have closed red this week, led by Nifty IT; Nifty Bank fell the least.
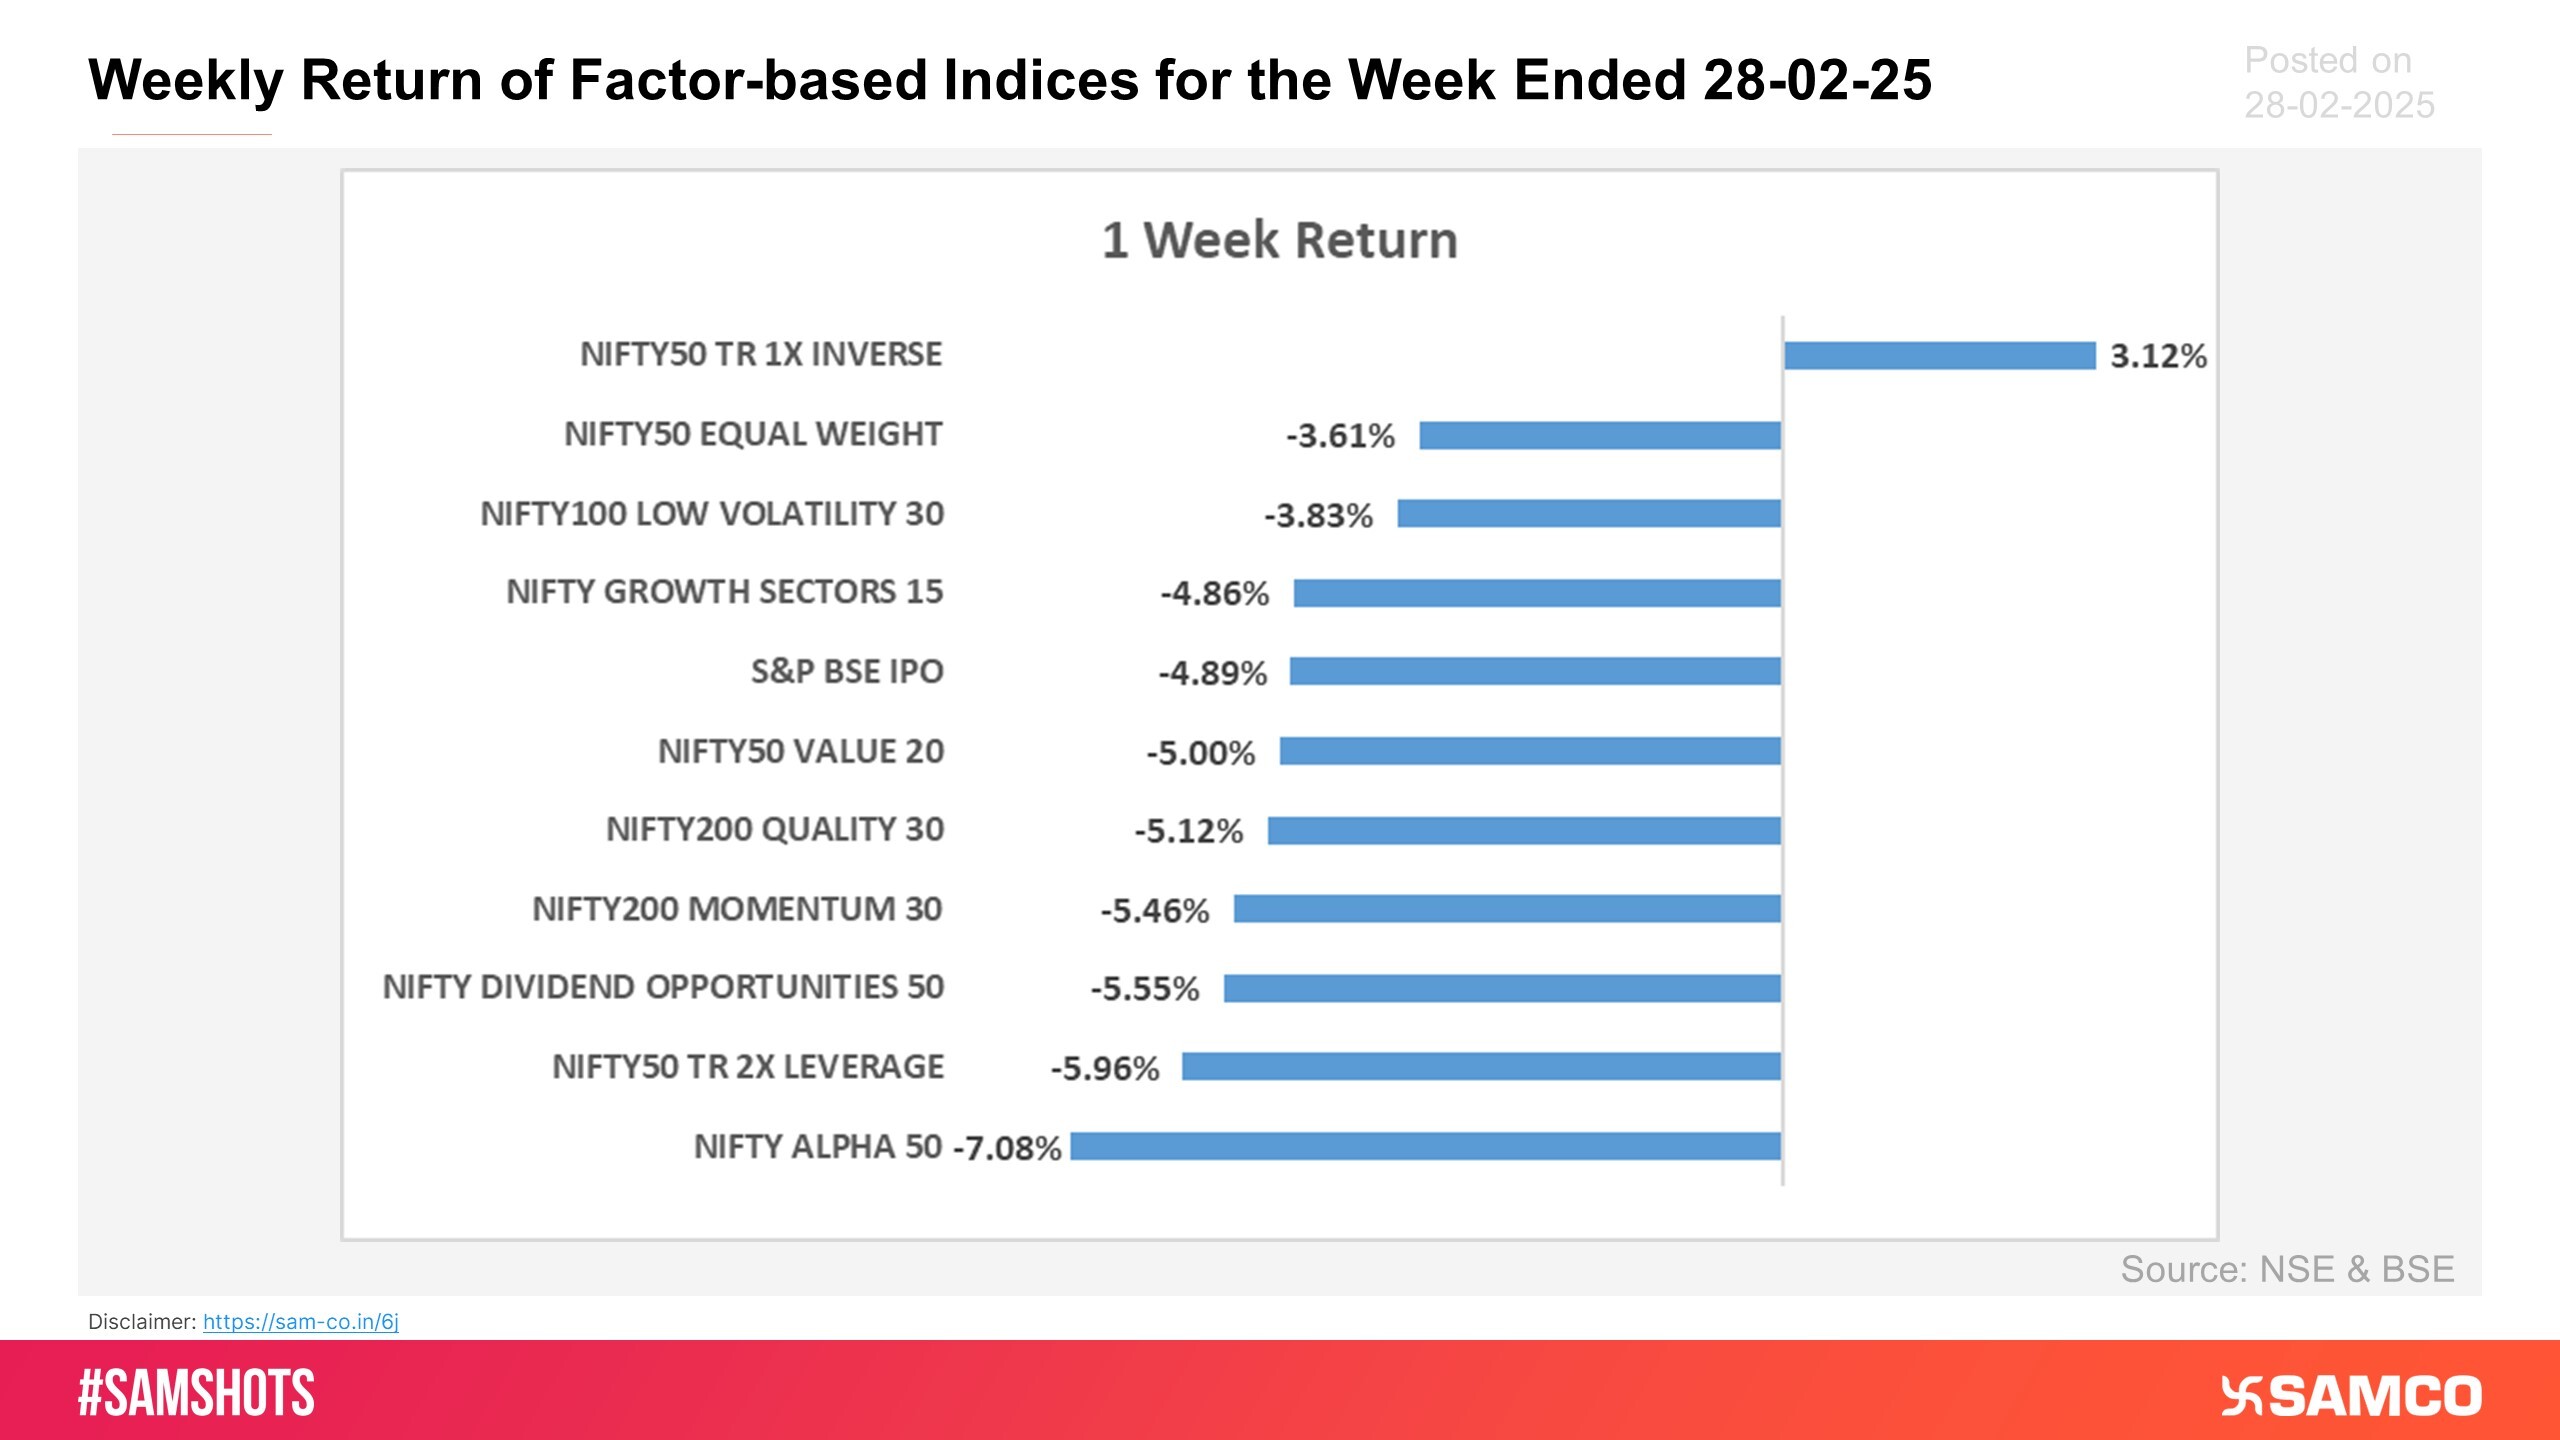
Except Inverse strategy, all other factor-based and strategy indices have declined this week.
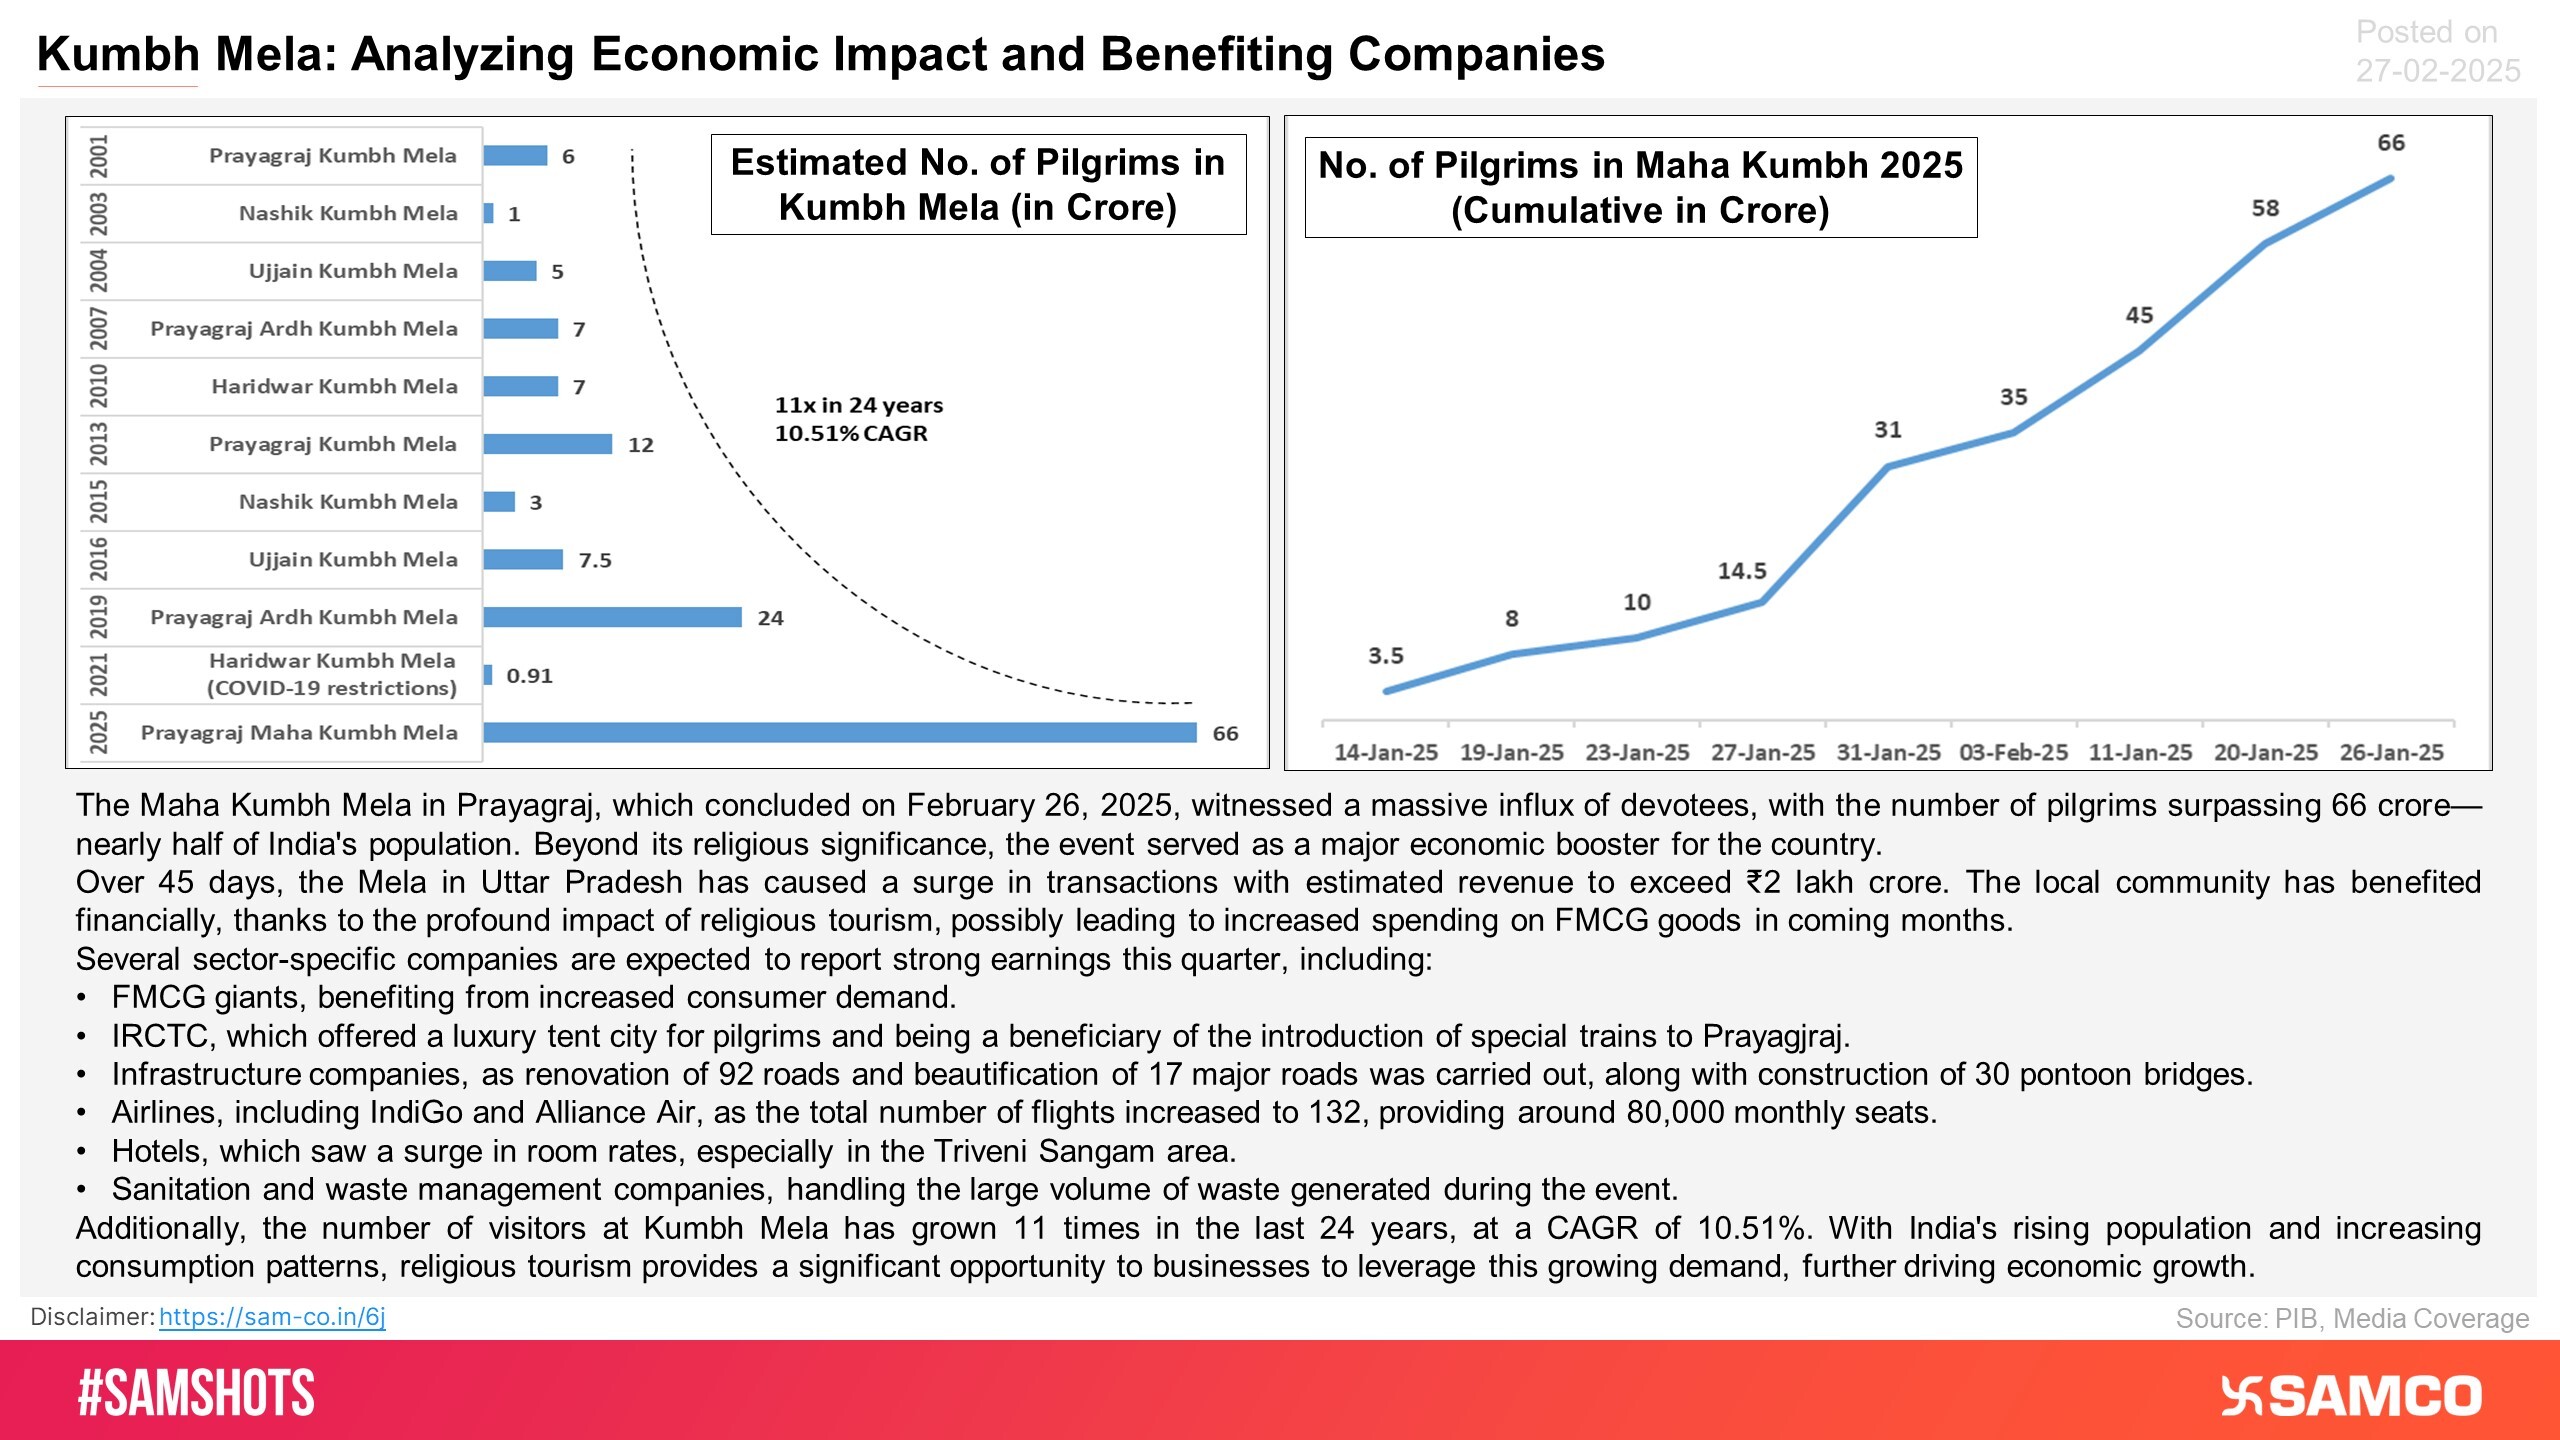
Let’s analyze the growth trend of religious tourism in India and the key beneficiaries of the Kumbh Mela.
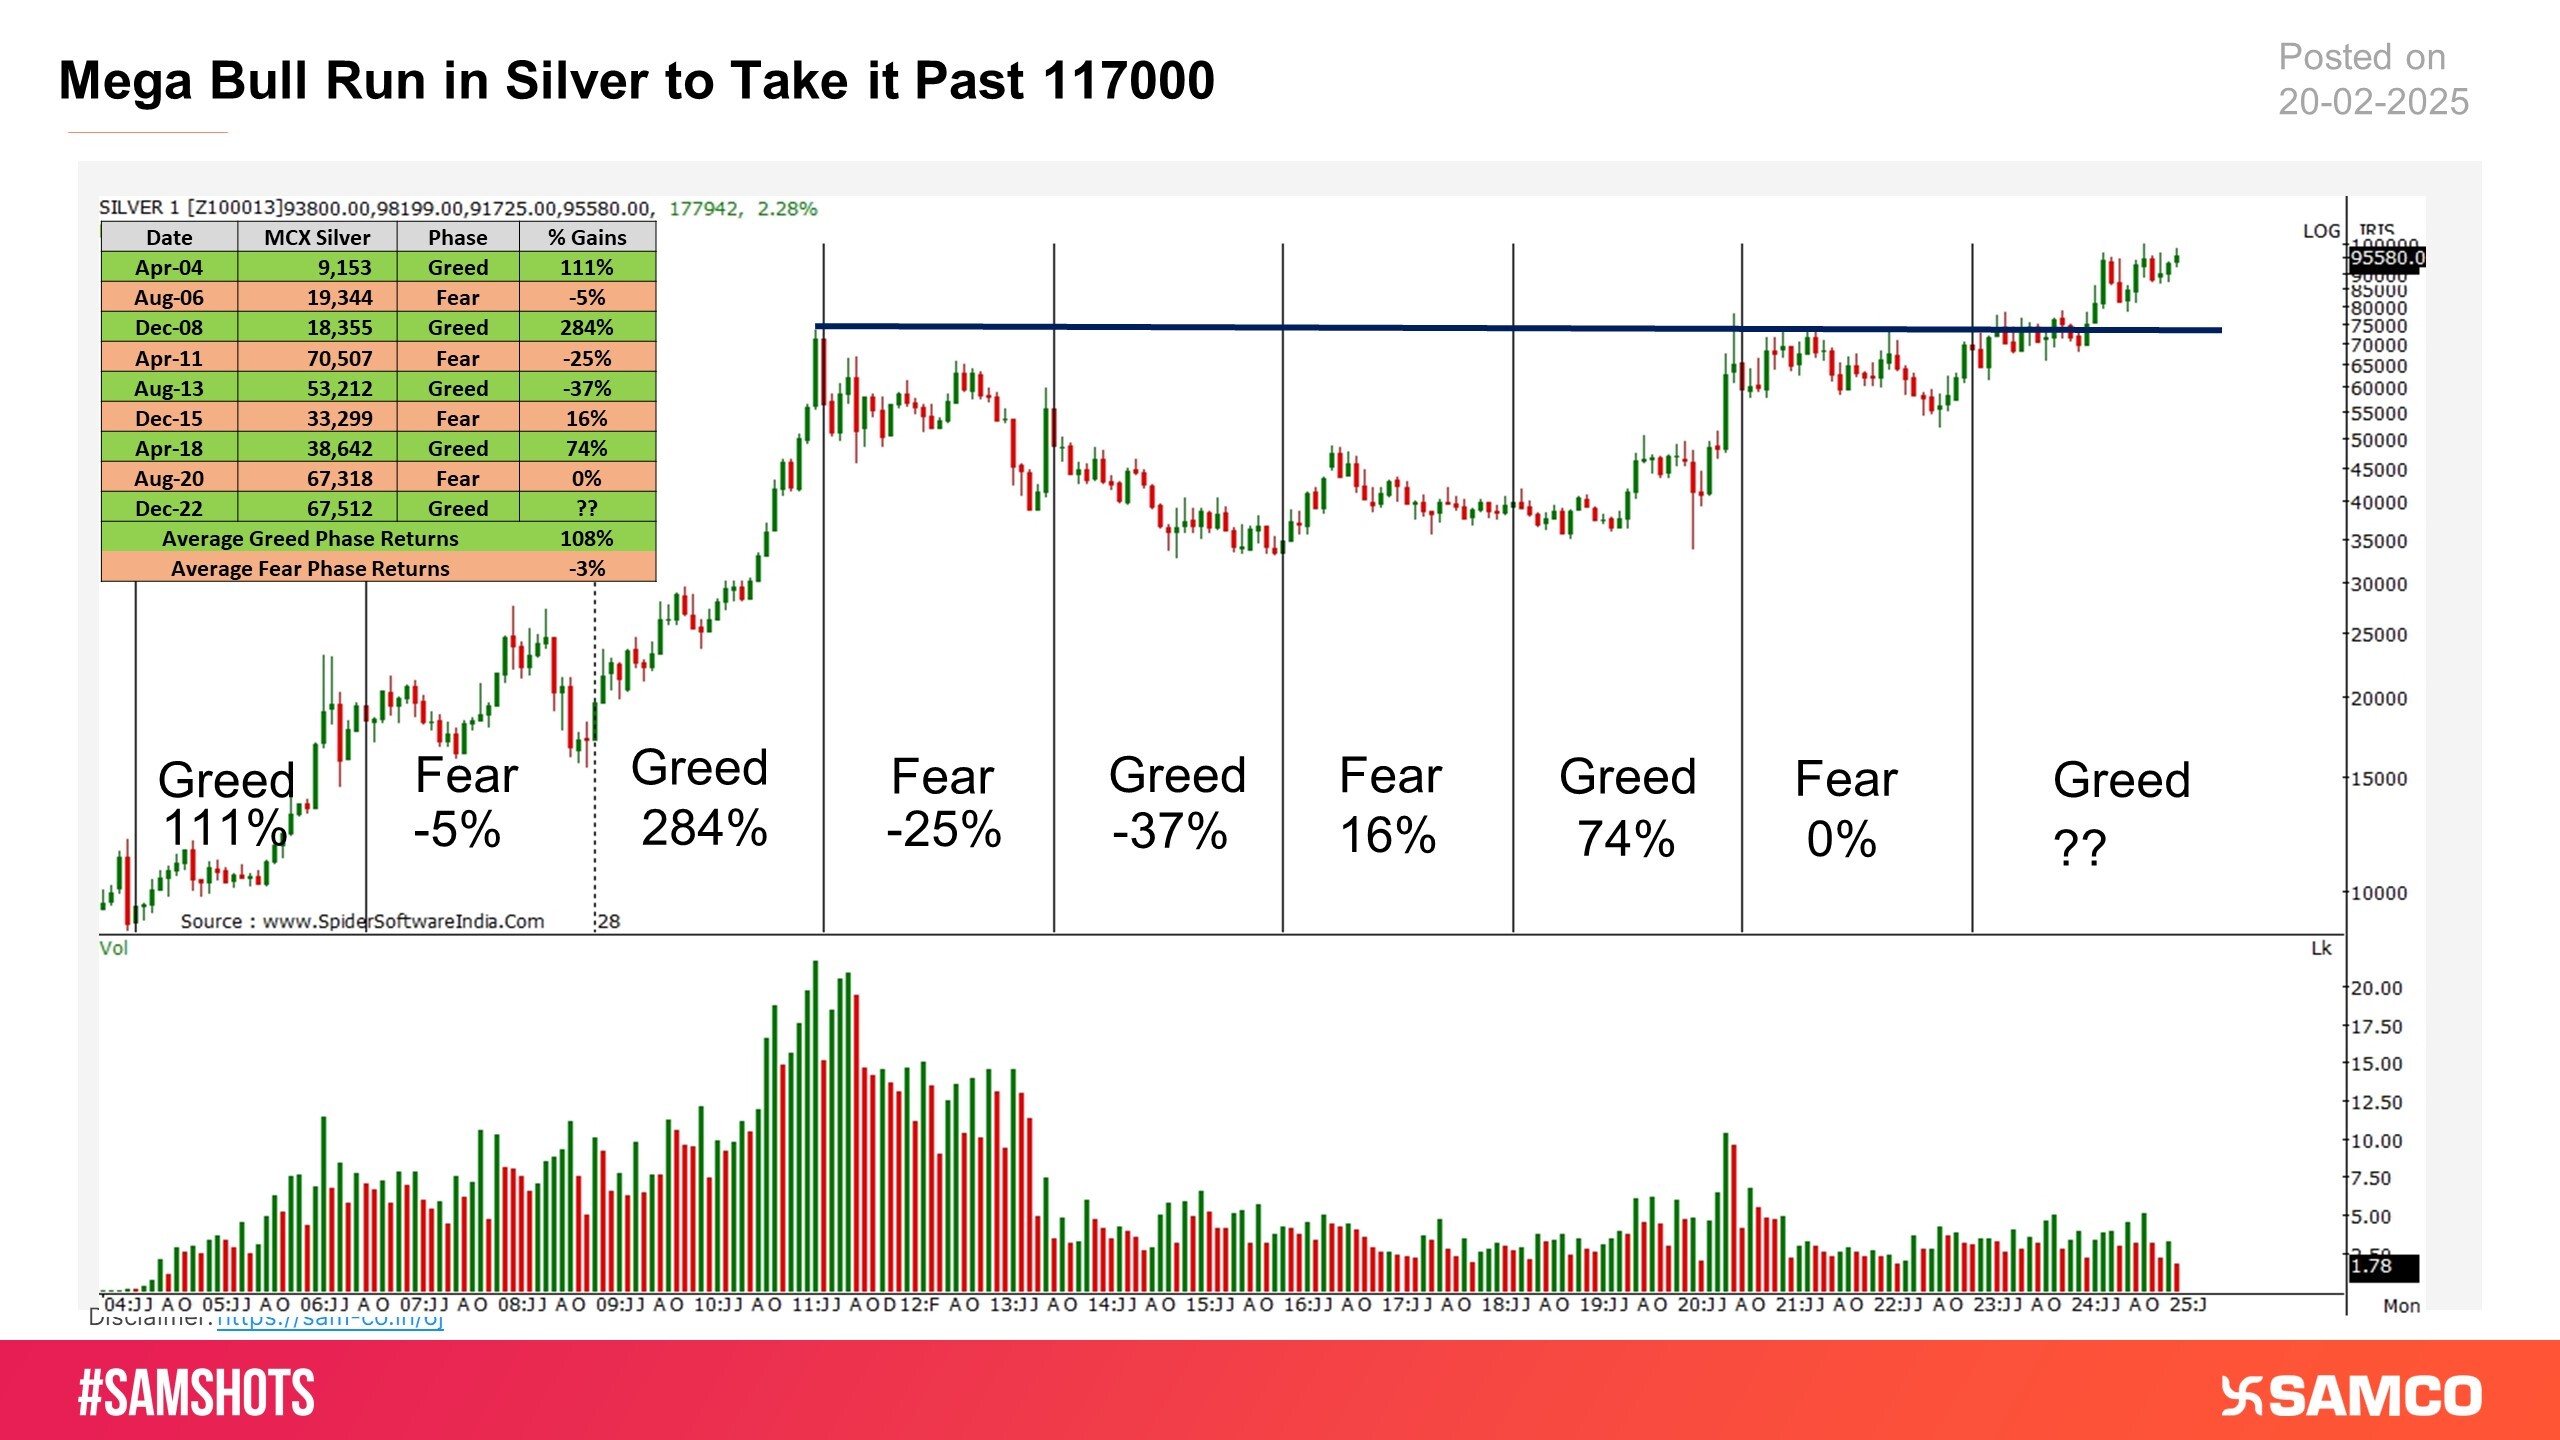
Silver entered the greed phase in January 2023 and will stay there till April 2025. While current phases returns are much lower than average, we believe that silver should be on your radar.
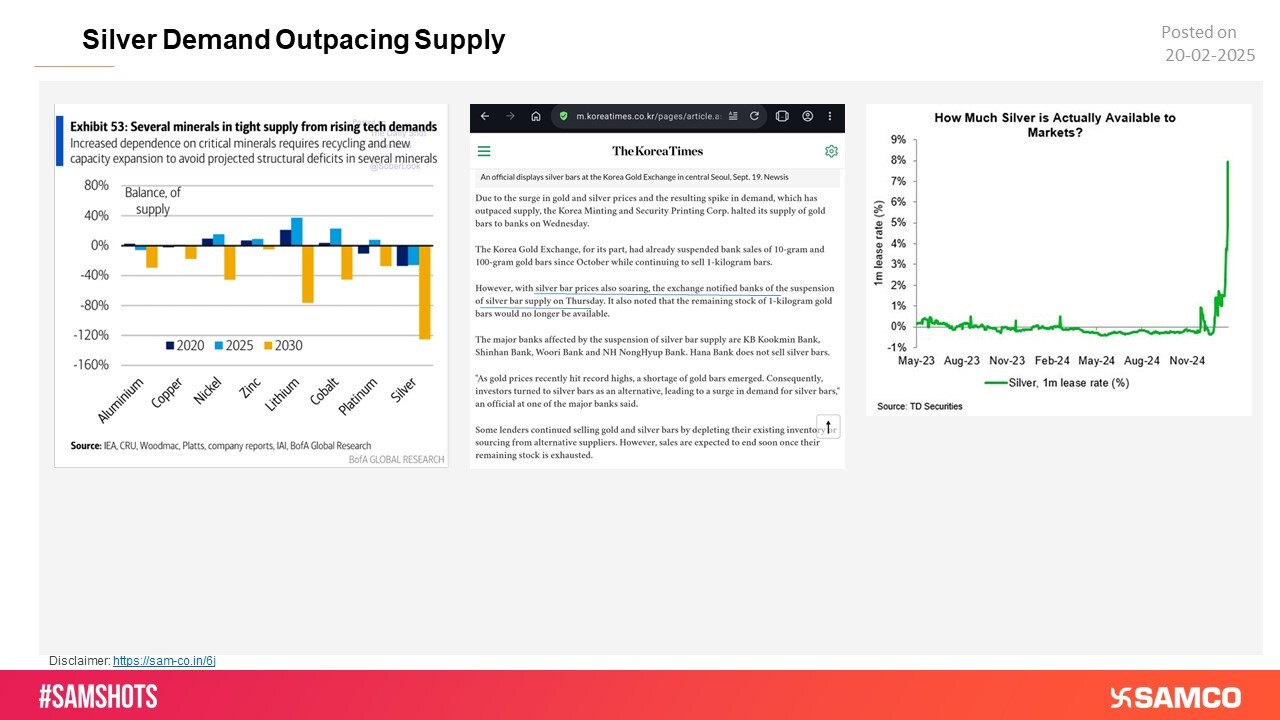
Silver demand is rising faster than its supply, driven by increasing industrial usage, especially in green energy sectors like solar panels and electric vehicles. This supply-demand gap could support silver prices in the near term, making it a potential o
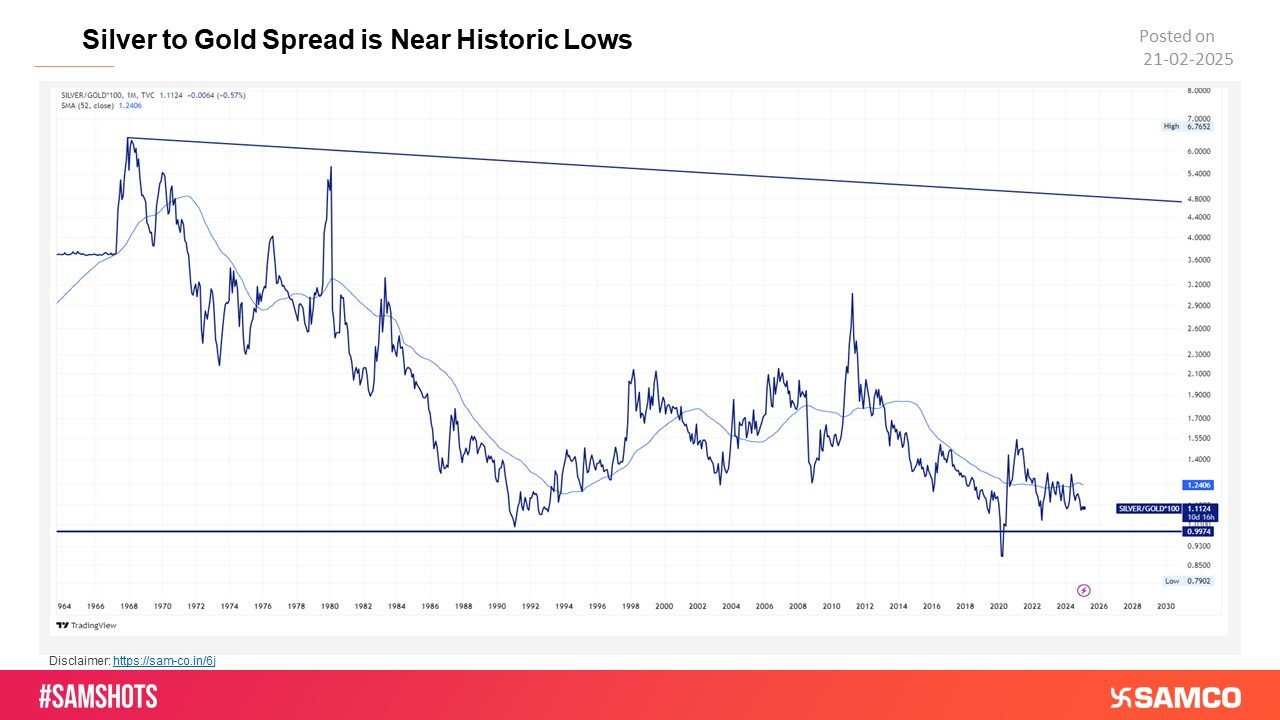
Silver to gold spread is extremely low and the only way for this ratio is to move up. This means silver prices needs to move up or gold needs to fall. We believe chances of former happening are high.
Weakness in dollar is a major positive for silver. When the dollar weakens, it takes more dollars to buy the same amount of silver, making silver prices rise.
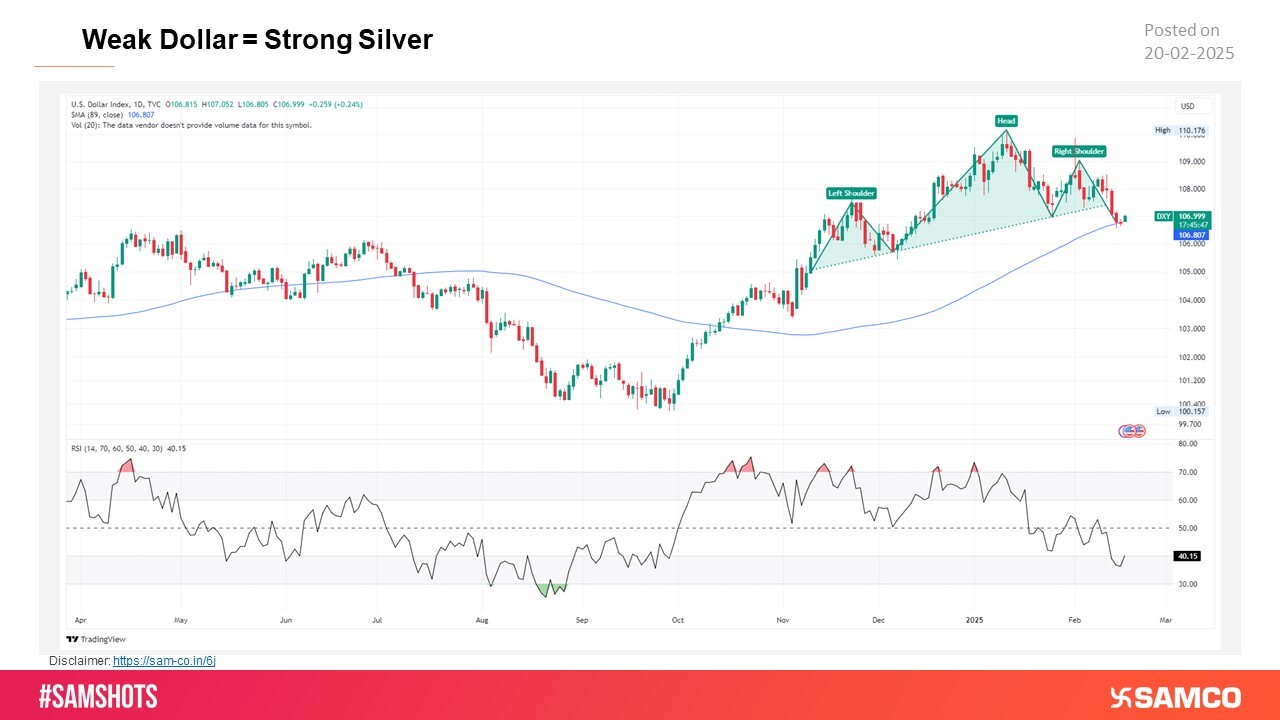
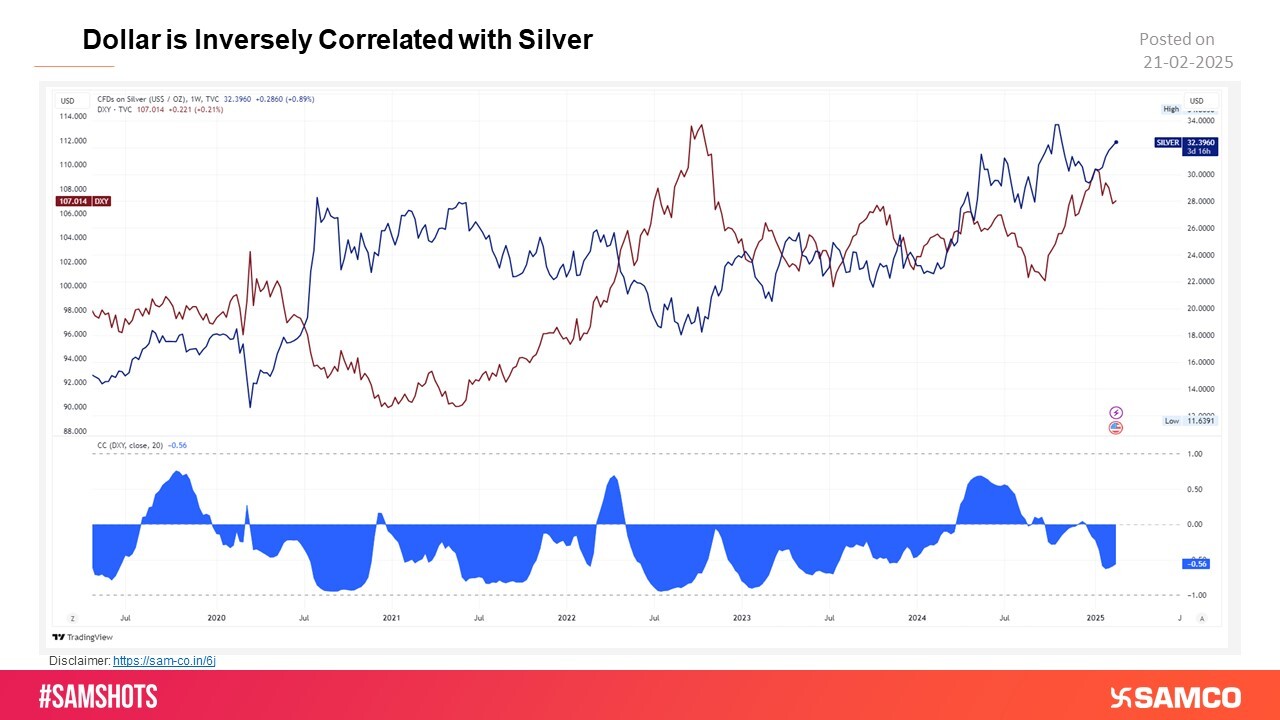
When the Dollar strengthens, silver prices tend to fall as it becomes more expensive for global buyers. On the other hand, when the Dollar weakens, silver often rallies as it becomes cheaper and more attractive as a safe-haven asset.
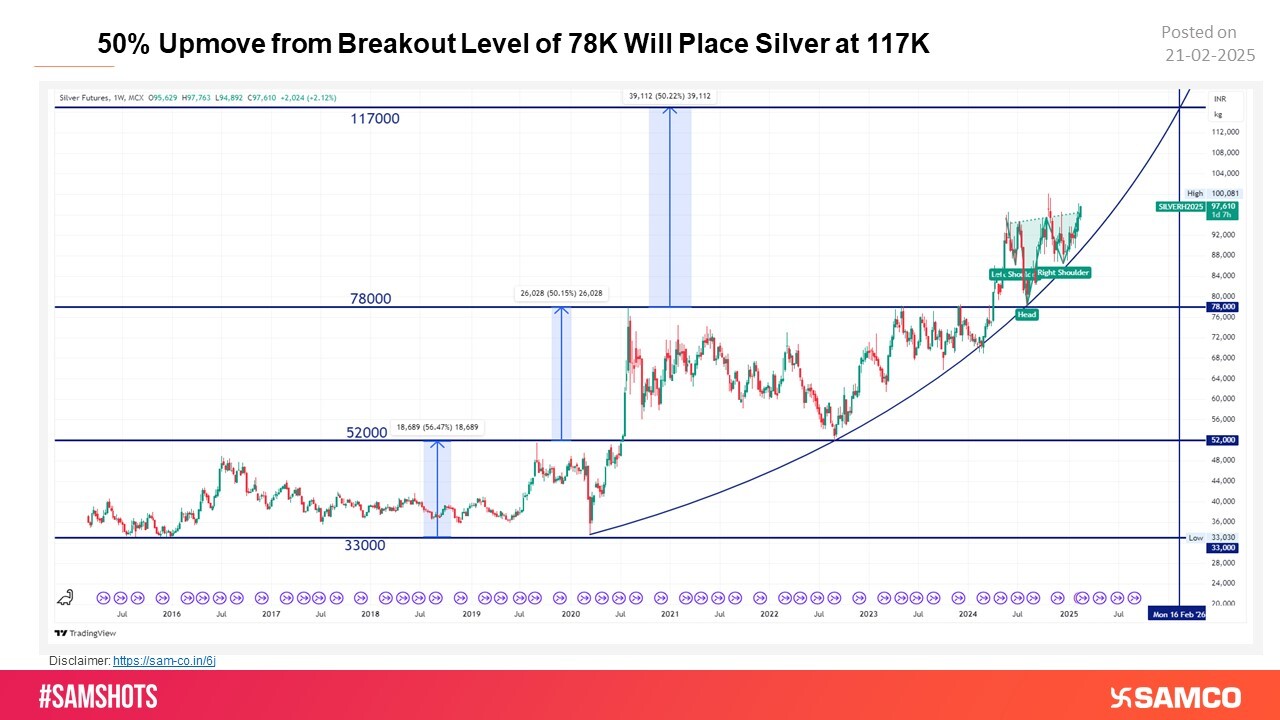
Silver is a very volatile asset and trading it is not for the ones with weak hearts. Despite this we have tried to identify ranges and tried to make sense out of this chaos.
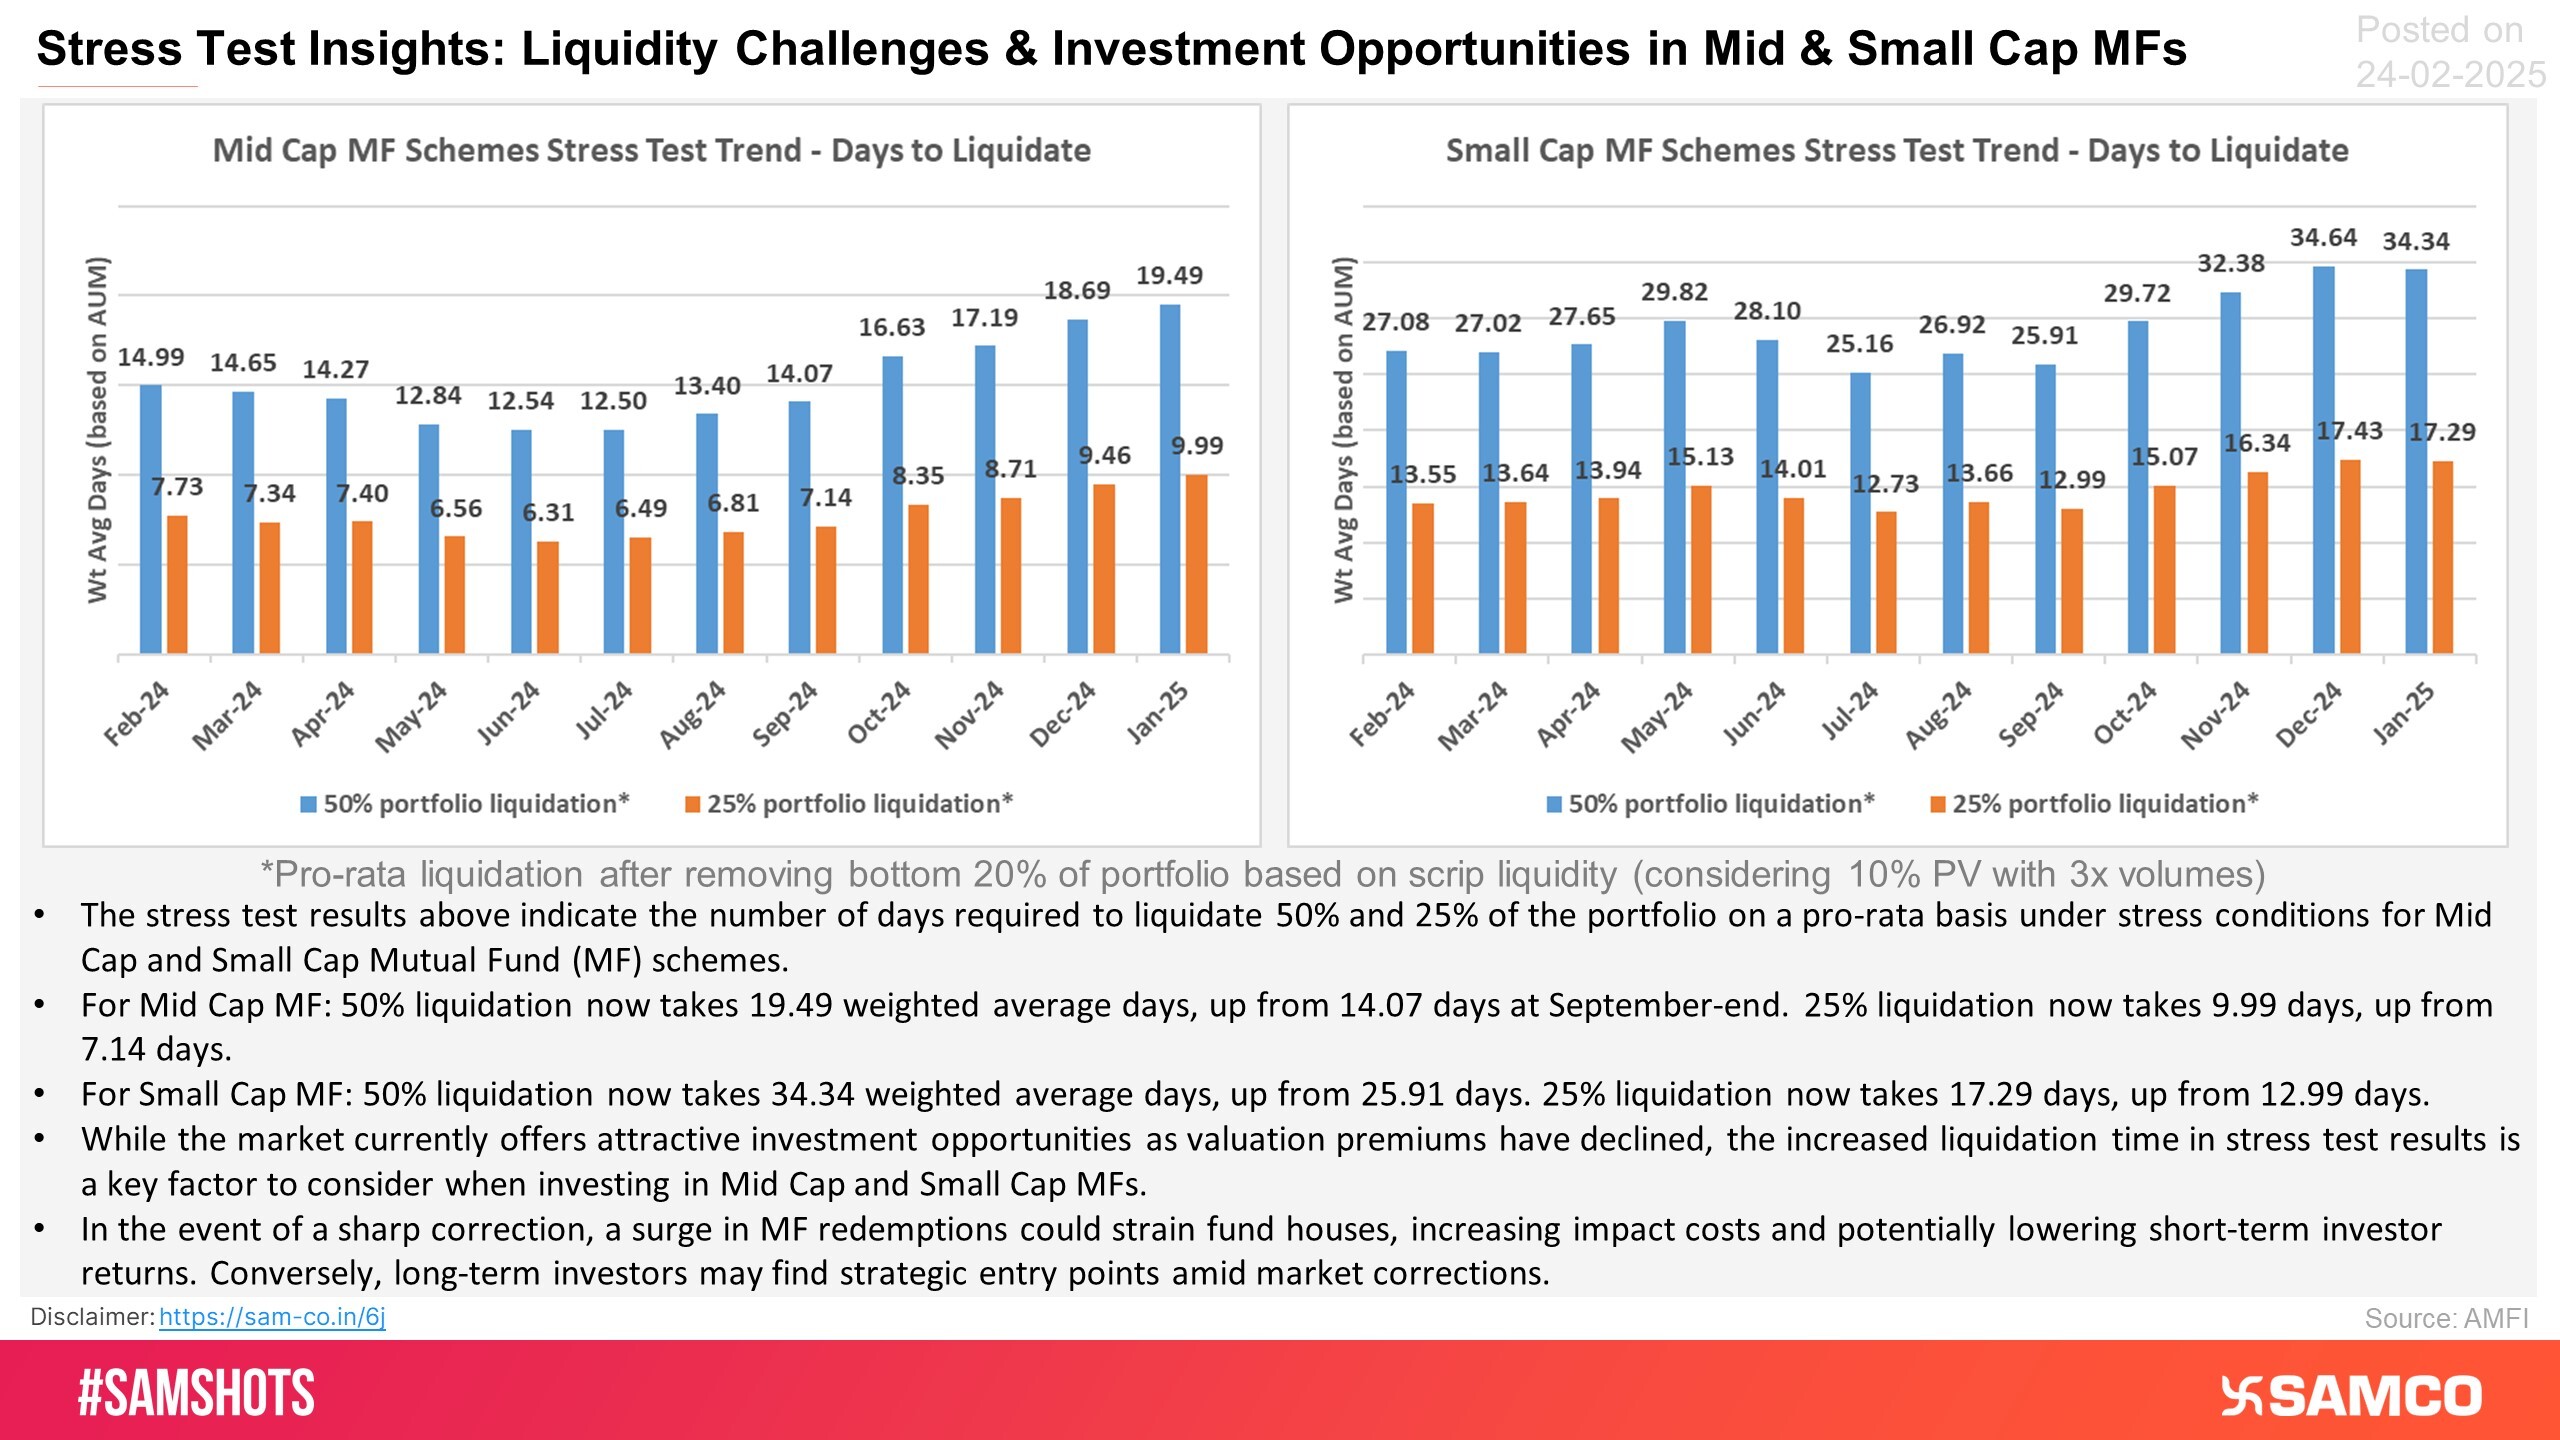
Have a look at what MF stress test data suggest for meeting redemption pressure amid ongoing volatile market conditions.
Sharp Sell-Off in Defence Stocks.
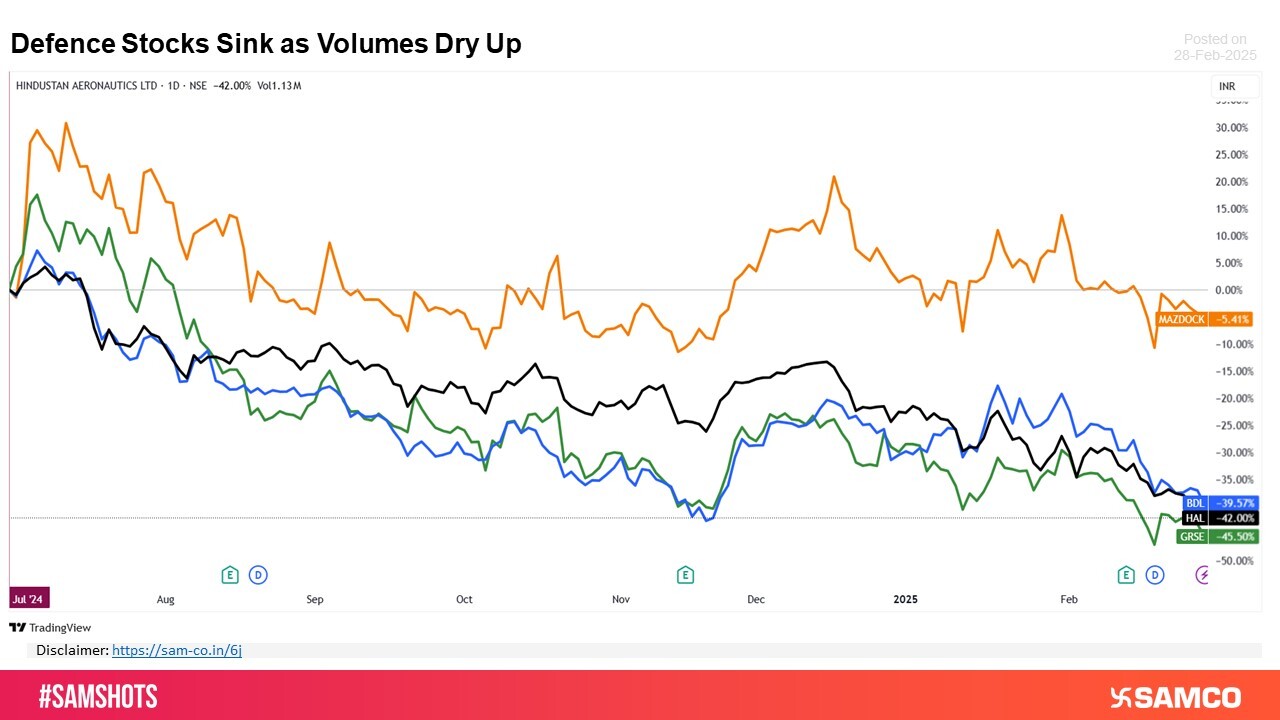
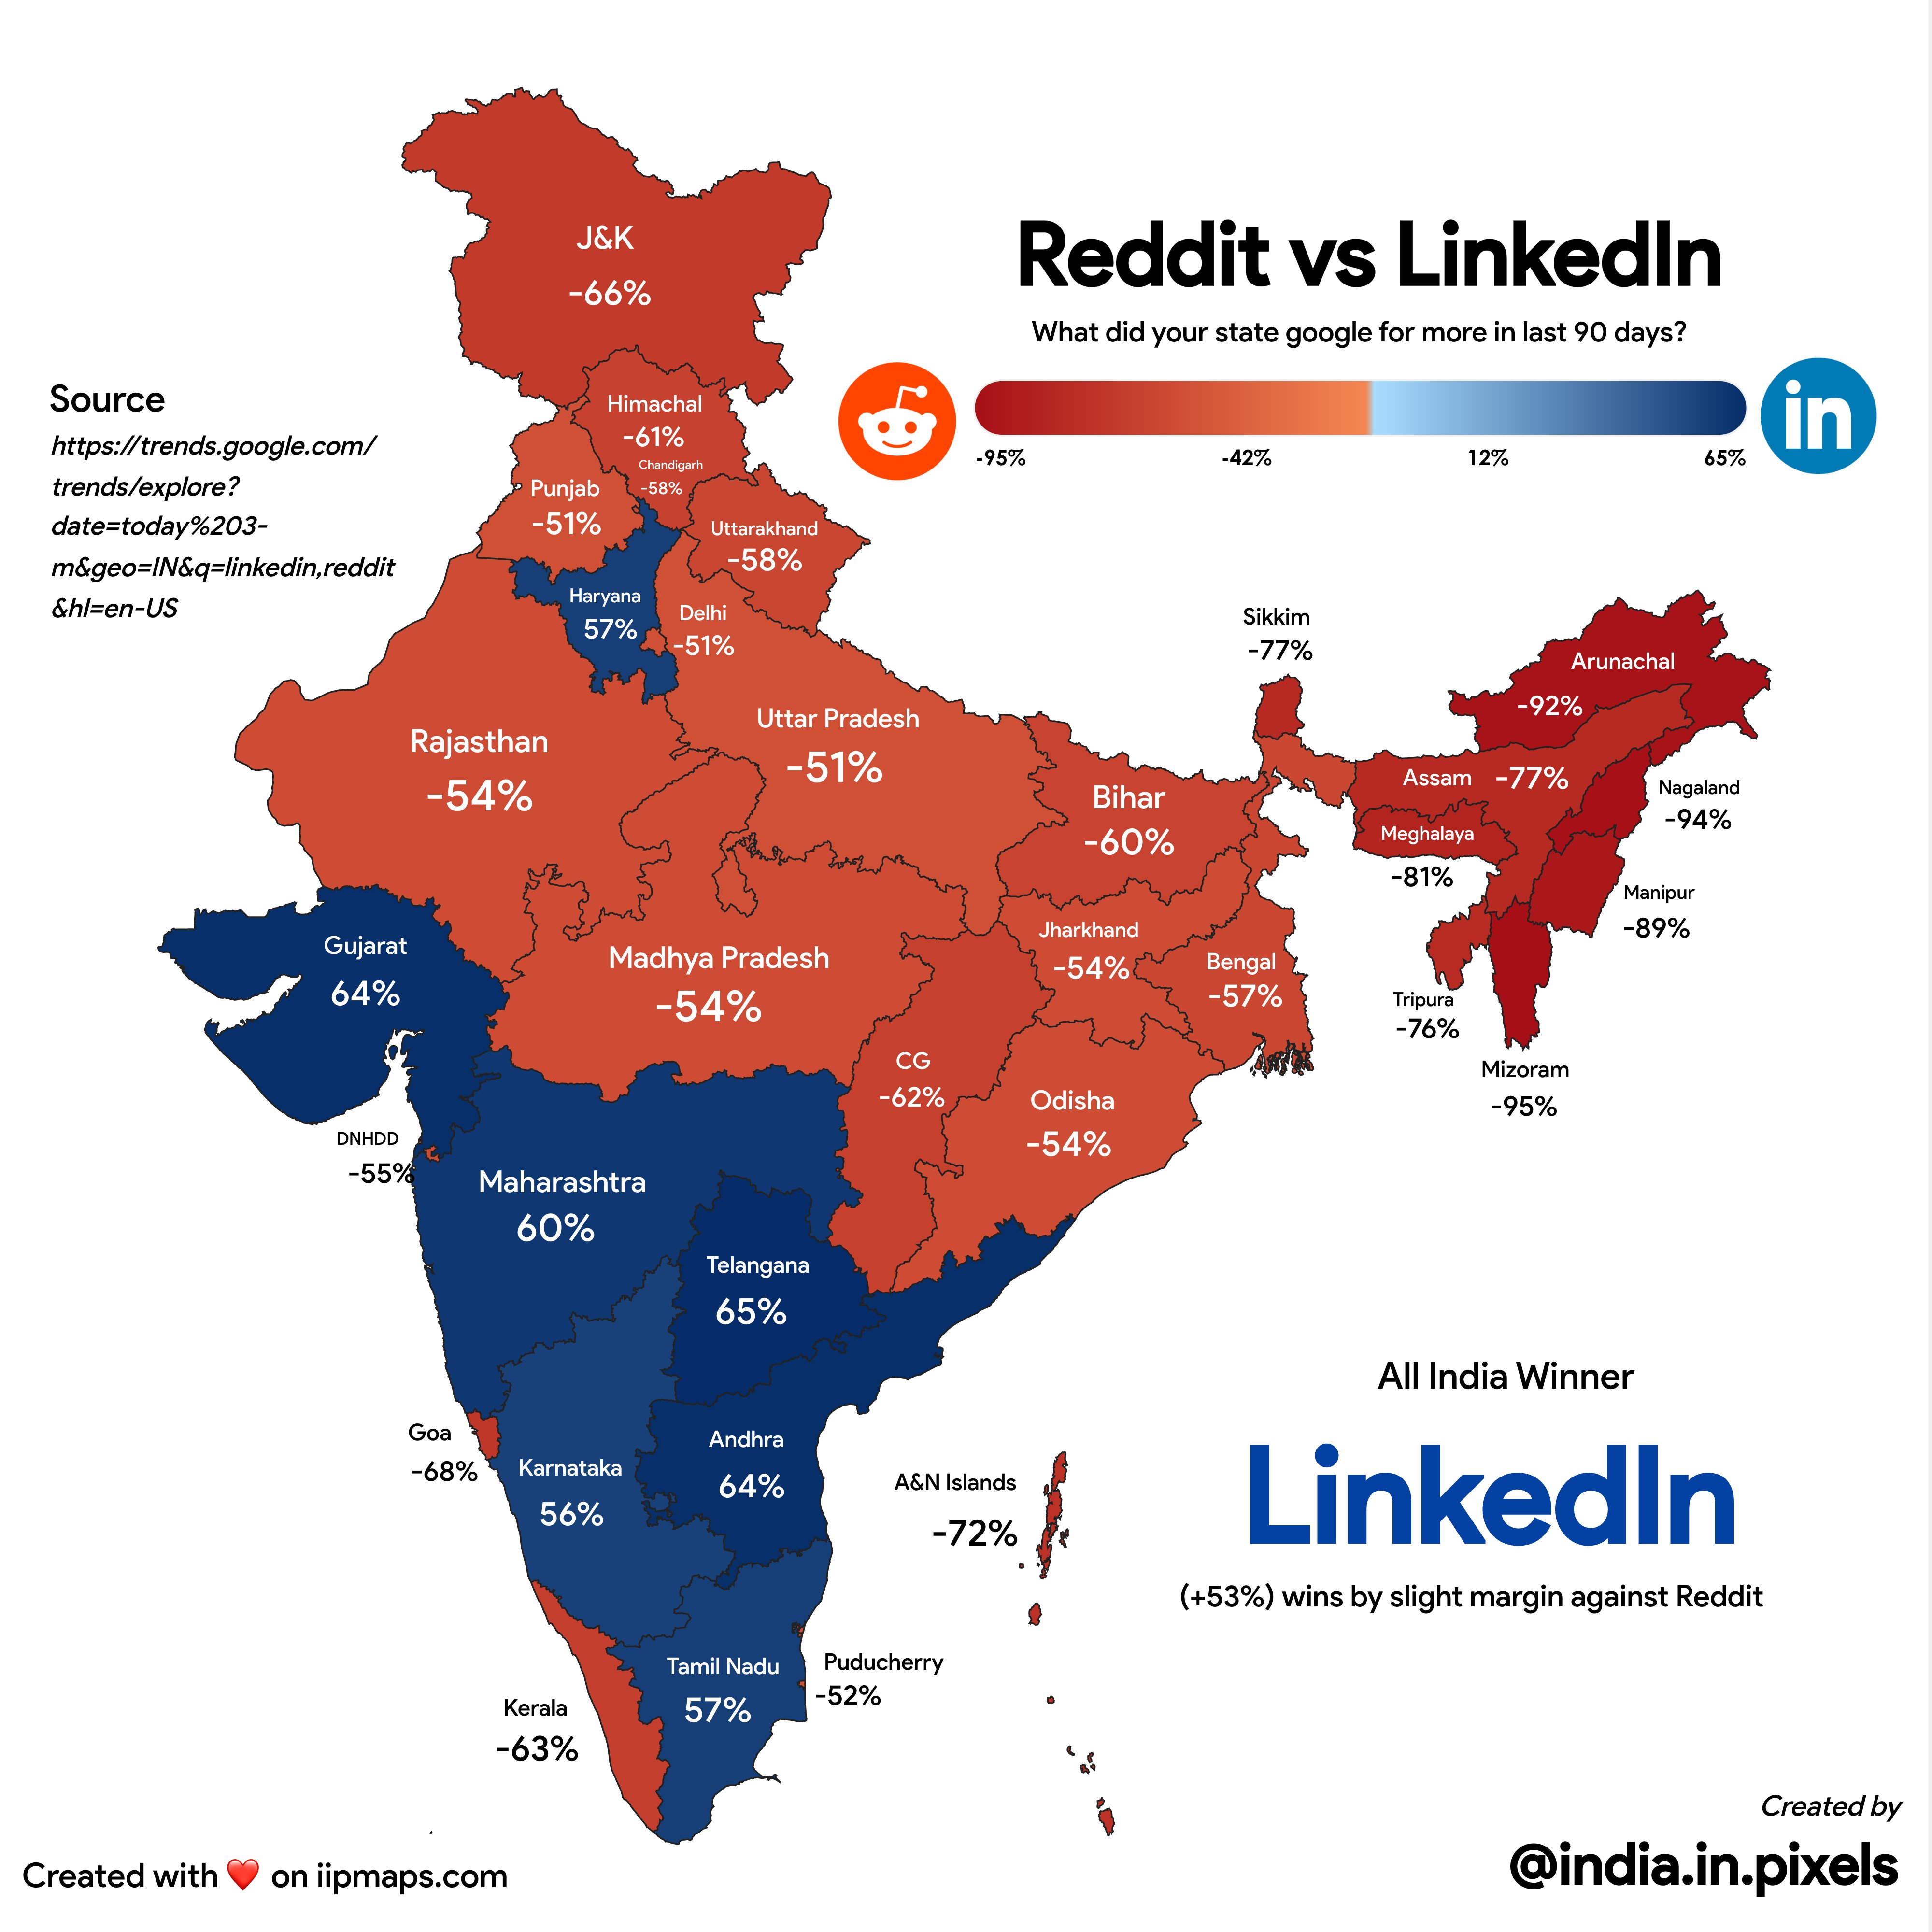
Image Source: @indiainpixels (Twitter)
 Easy & quick
1. Register on SCORES portal
2. Mandatory details for filling complaints on SCORES
Name | PAN | Address | Mobile | Number | E-mail ID
3. Benefits
Effective Communication
Speedy redressal of the grievances
