The Indian markets continued to impress the investors as Nifty 50 achieved an all-time high for the fourth consecutive week. The India VIX significantly cooled down, plummeting by over 24% during the week, indicating reduced market volatility.
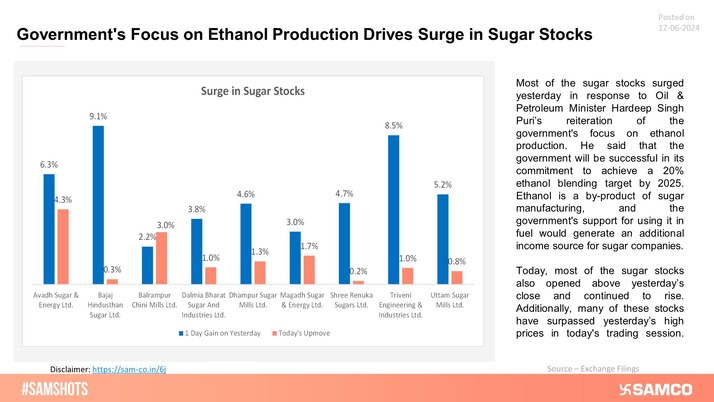
Defence stocks experienced a notable surge on Friday following the Defence Minister's ambitious plan to boost defence exports over the next five years. Sugar stocks also garnered attention due to the announcement of a 100% incentive for ethanol production.
Meanwhile, on the global front, the US Federal Reserve maintained its interest rate but hinted at a potential rate cut by year-end as part of its ongoing efforts to combat inflation.
Nifty 50 ended the week 0.75% higher at 23,466. Nifty Realty and Nifty PSE surged the most with a gain of 5.57% and 4.94% respectively
Scroll down to understand more of such market news and perspectives for the week gone by in easily understandable charts.
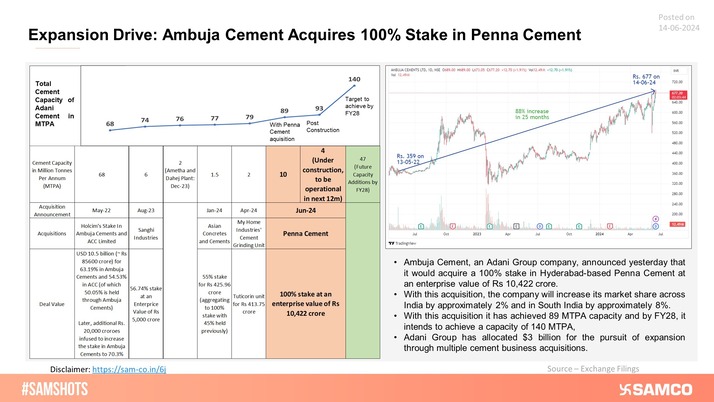
The chart below shows the continuation of Adani Cement's pursuit of expansion through acquisitions:


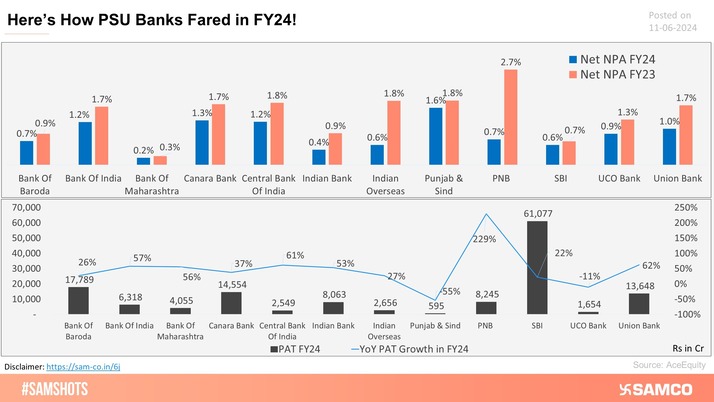
The below chart shows how PSU banks fared in FY24
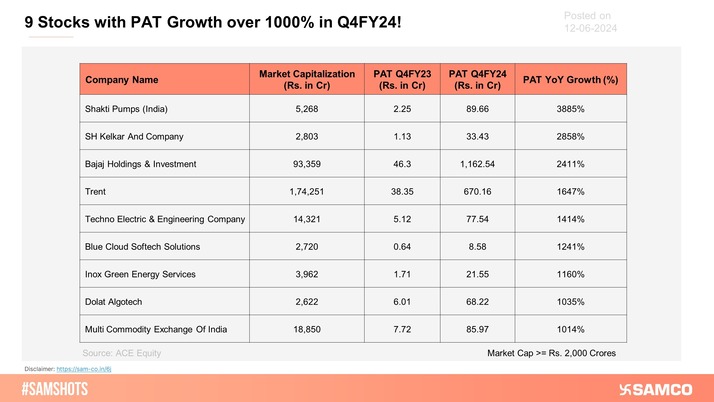
The above table shows 9 companies having market capitalization exceeding Rs. 2,000 crores that reported YoY PAT growth of over 1000% in Q4FY24.
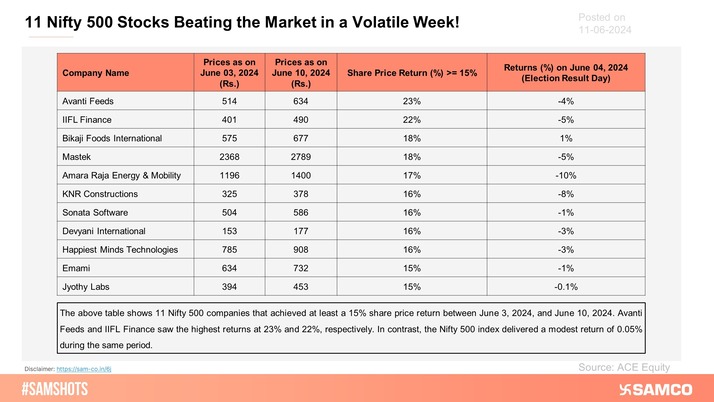
The above table shows 11 Nifty 500 companies that achieved at least a 15% share price return between June 3, 2024, and June 10, 2024.
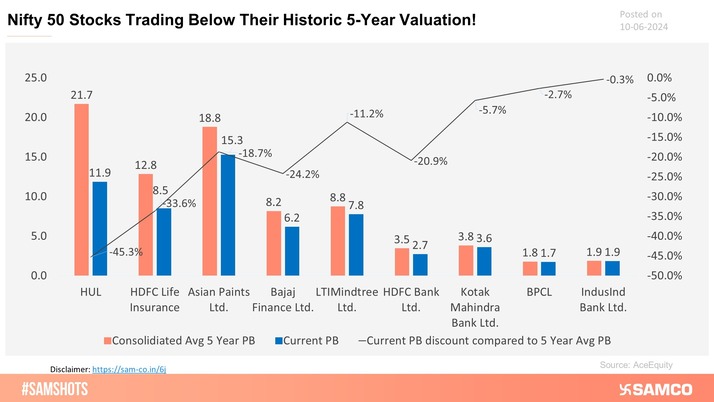
The chart displays Nifty 50 stocks are trading at low valuations despite overvalued market conditions.
The below table shows 9 companies having market capitalization exceeding Rs. 2,000 crores that reported YoY PAT growth of over 1000% in Q4FY24.
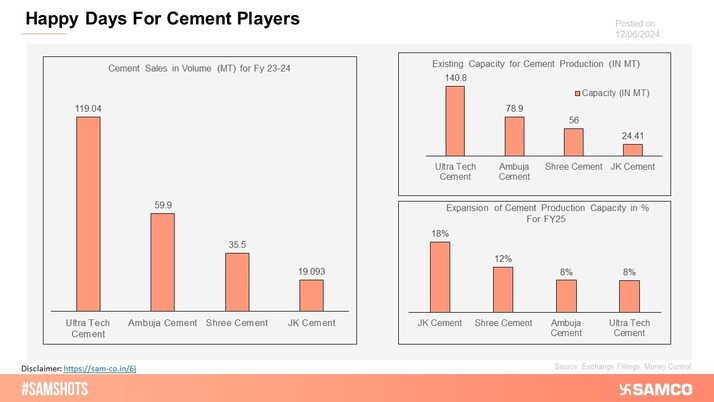
The graph explains performance of cement players during last FY and capacity expansion plans in response to increase in cement prices.
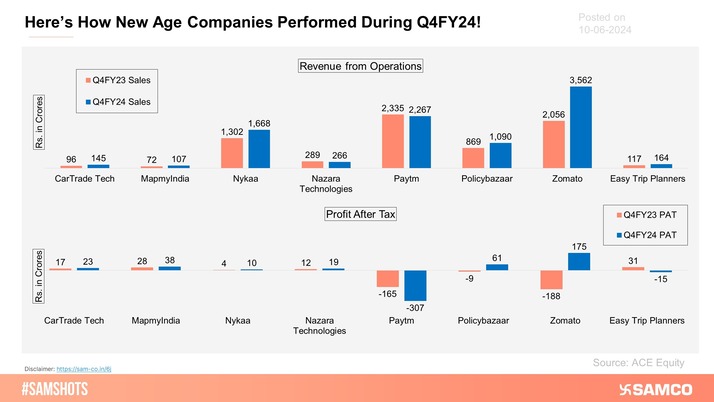
Most new-age companies showed strong sales growth, with notable profitability improvements in Q4FY24, except for Paytm and Easy Trip Planners' PAT downturns.
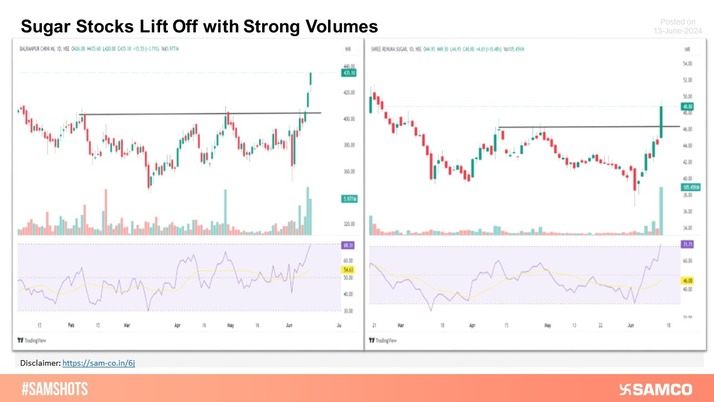
Sugar stocks' rally due to Govt's focus on Ethanol blending in fuel is presented below:
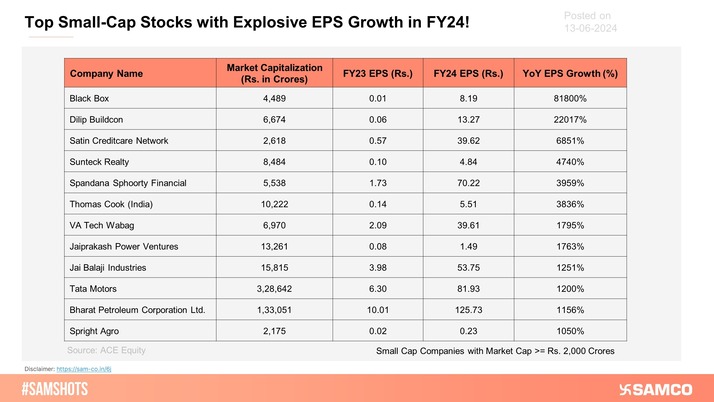
Here's the list of small-cap companies reporting a YoY EPS growth of over 1000% in FY24!
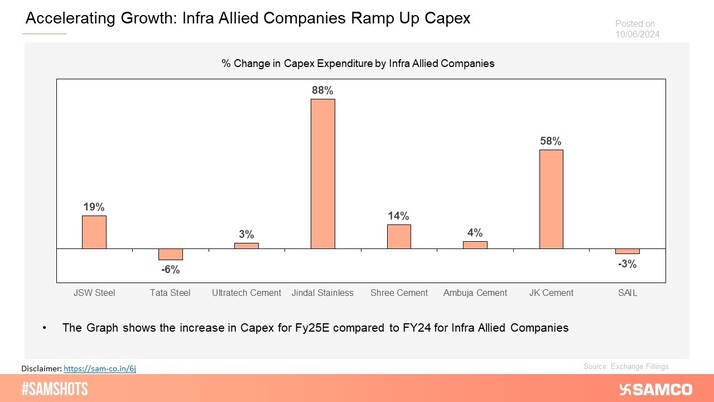
The chart below displays the increase in Capex by Cement and Steel producers in expectation of infrastructure development.
The above table shows 11 Nifty 500 companies that achieved at least a 15% share price return between June 3, 2024, and June 10, 2024.
Here's the list of small-cap companies reporting a YoY EPS growth of over 1000% in FY24!
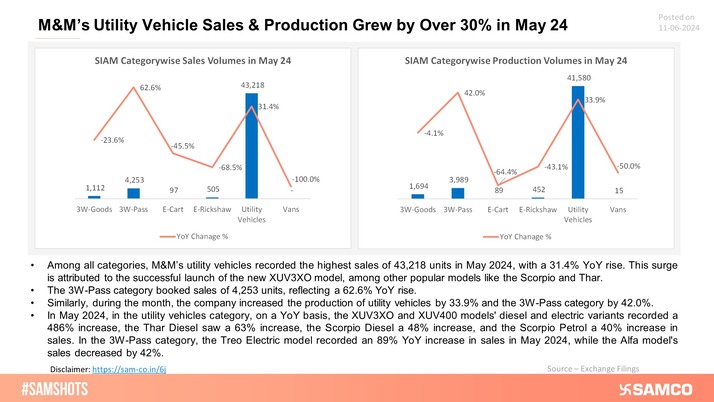
Here is M&M's SIAM category wise Production and Sales Chart for May 24:
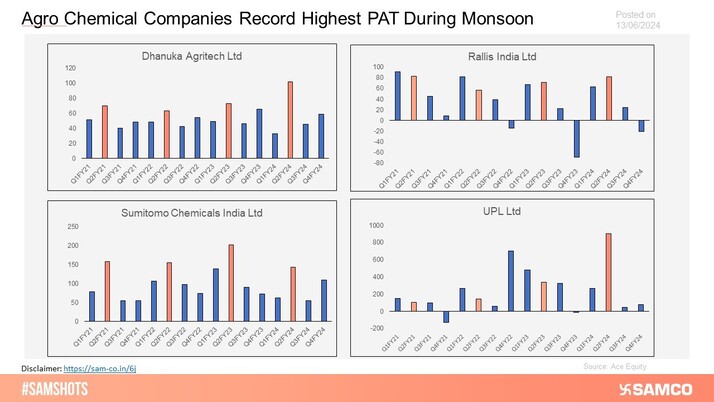
The Chart displays the surge in sales for agrochemicals companies in Q2 as compared to other quarters
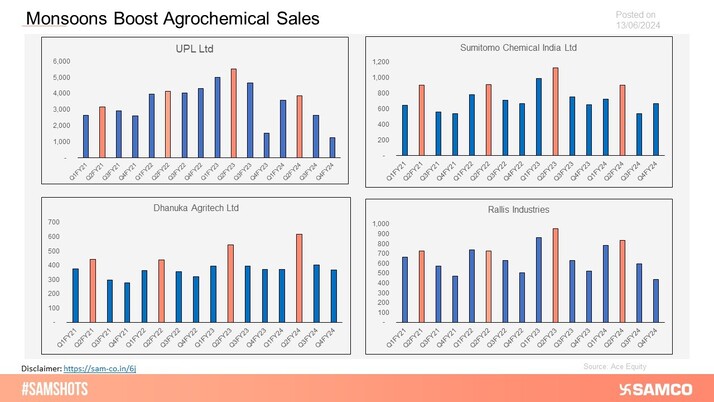
The graph shows 2nd Quarter of a FY is the highest yielding quarter for agrochemical companies.
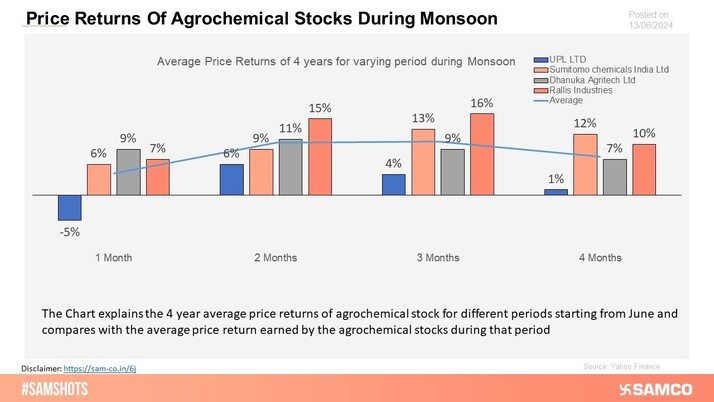
The highest sales and highest PAT in 2nd quarter, results in positive price returns for agrochemical stocks
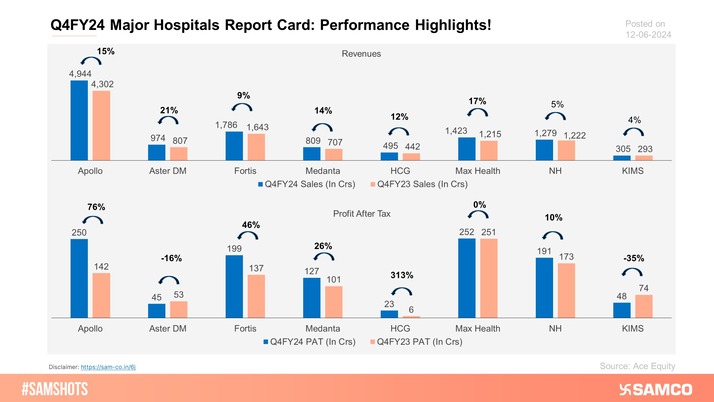
The accompanying chart presents performance of major hospitals in Q4FY24.
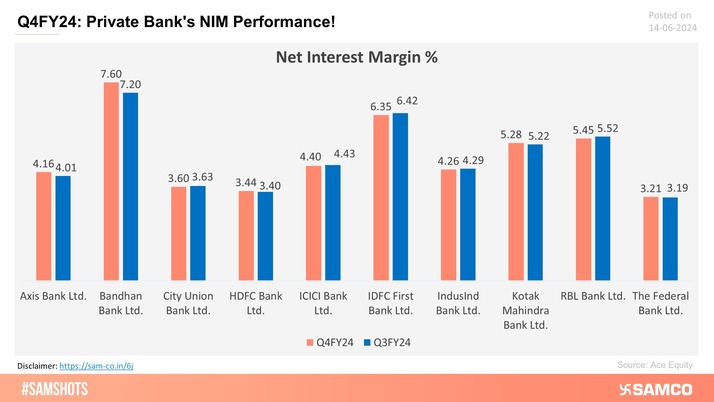
Here's how the private sector banks has maintained its NIM in Q4FY24
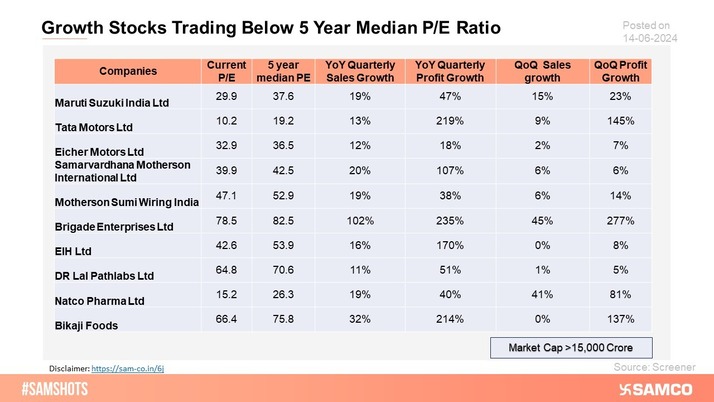
The Table Displays Stock available at low valuations despite growth in quarterly sales and quarterly profit
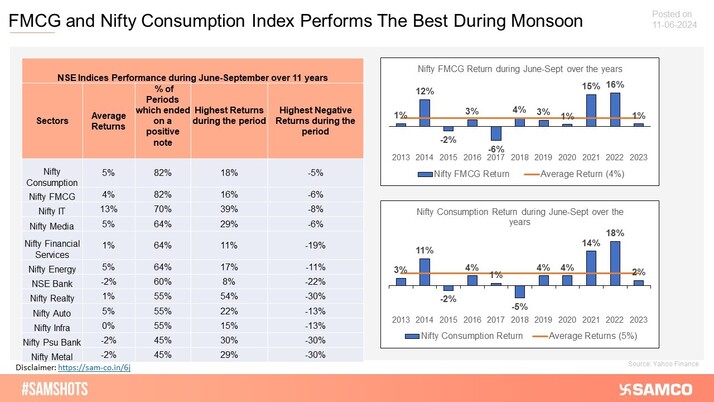
The below chart shows the performance of various indices over the period during the monsoon
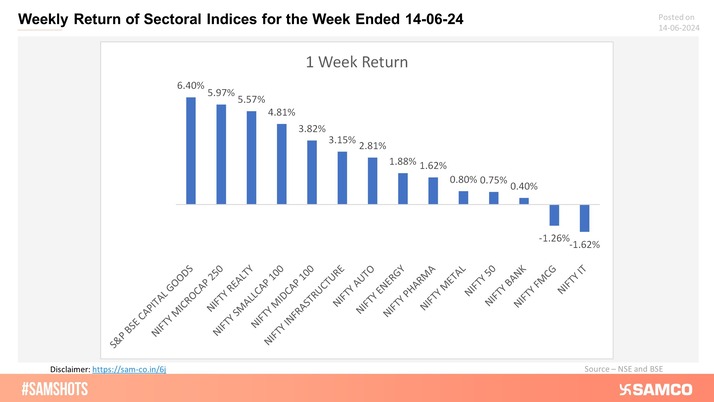
Presented below are the returns of sectoral indices for the past week:
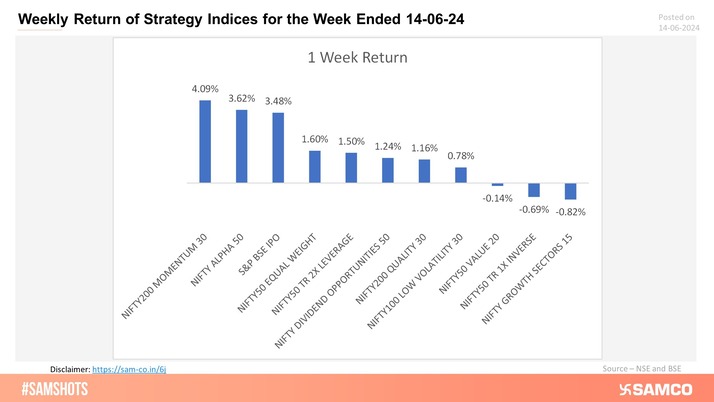
Weekly Return of Strategy Indices for the Week Ended 14-06-24
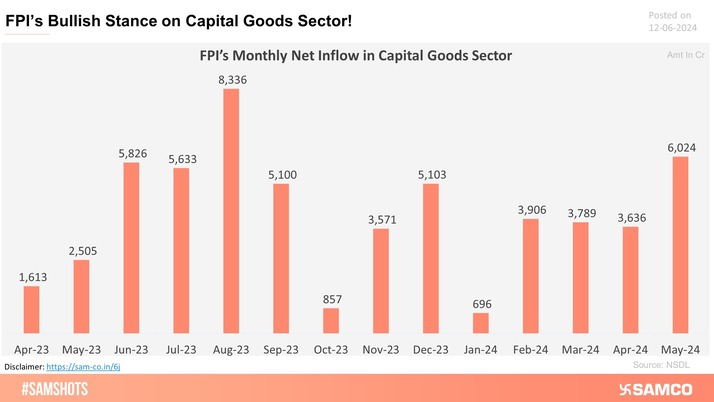
The chart below shows FPI's inflow in the capital goods sector since April 2023.
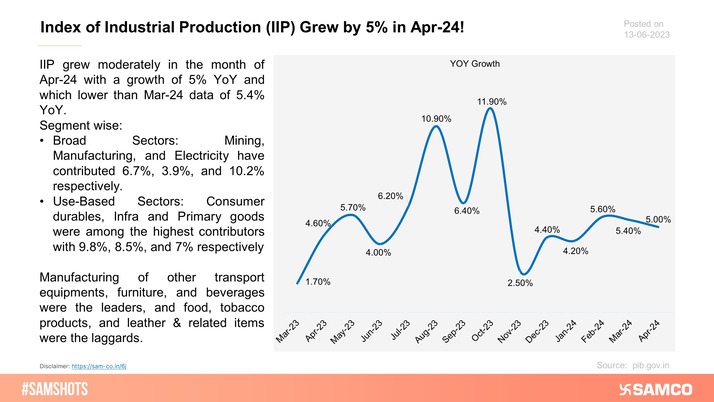
The below chart presents Index of Industrial Production in Apr-24.
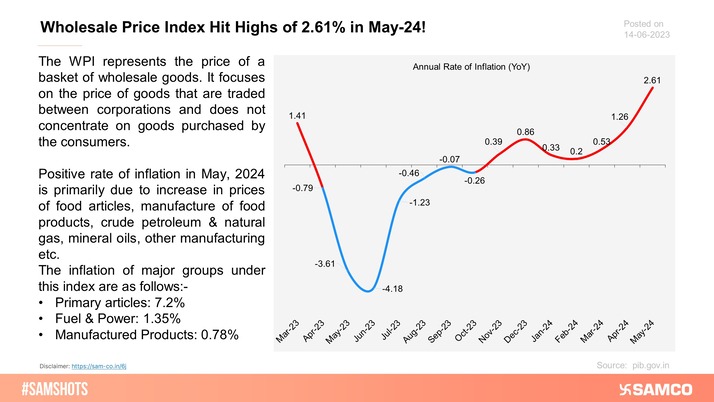
The below chart presents wholesale Price Index in May-24.
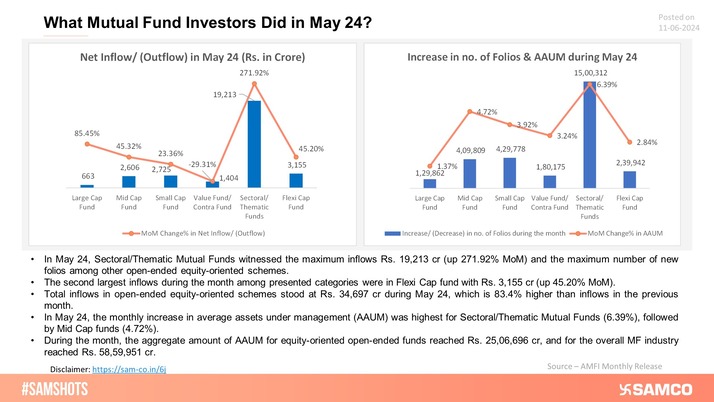
Net inflows and new folio additions for MF schemes in May 24 are presented below:
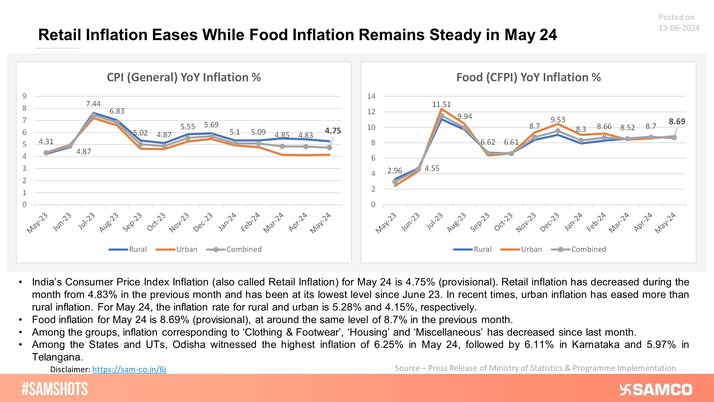
India's Retail and Food Inflation trends are presented below:
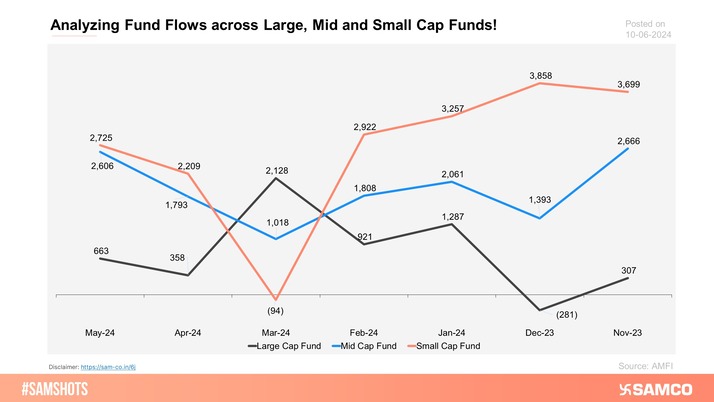
Here's how investors showed their preference while parking their funds in mutual funds in May-24:
The below chart presents the Sugar Stocks turning sweet with higher volumes.
CAMS sustains above weekly resistance.
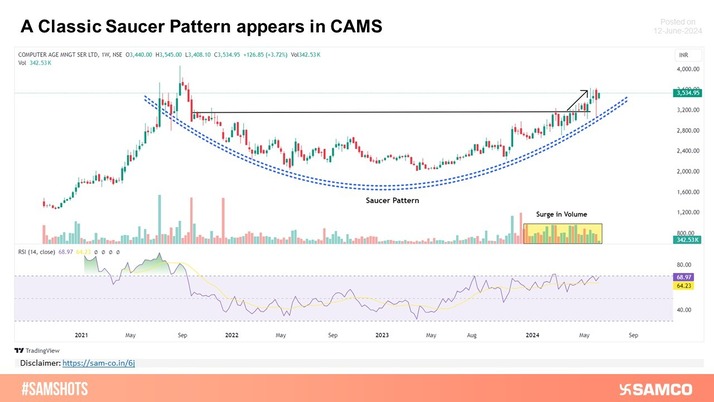
Image Source: @VisualCapitalist

 Easy & quick
1. Register on SCORES portal
2. Mandatory details for filling complaints on SCORES
Name | PAN | Address | Mobile | Number | E-mail ID
3. Benefits
Effective Communication
Speedy redressal of the grievances
