The past week was marked by volatility in the Indian markets with significant movements across various sectors. There was some profit-booking on Wednesday, but the markets recovered later in the day.
The Nifty 50 surged to a new all-time high for the eighth consecutive week, boosted by stellar Q1FY25 results announced by TCS on Friday. TCS’s strong Q1FY25 performance set an optimistic tone for the large IT companies as Nifty IT ended the week near an all-time high, bolstering bullish investor sentiment.
Despite initial pressure, Smallcaps and Midcaps managed to recover by week’s end. As budget day approaches, volatility is expected to dominate the markets. Defensive sectors like FMCG and IT garnered heightened investor interest, reflecting market sentiment favoring stability amidst uncertain conditions.
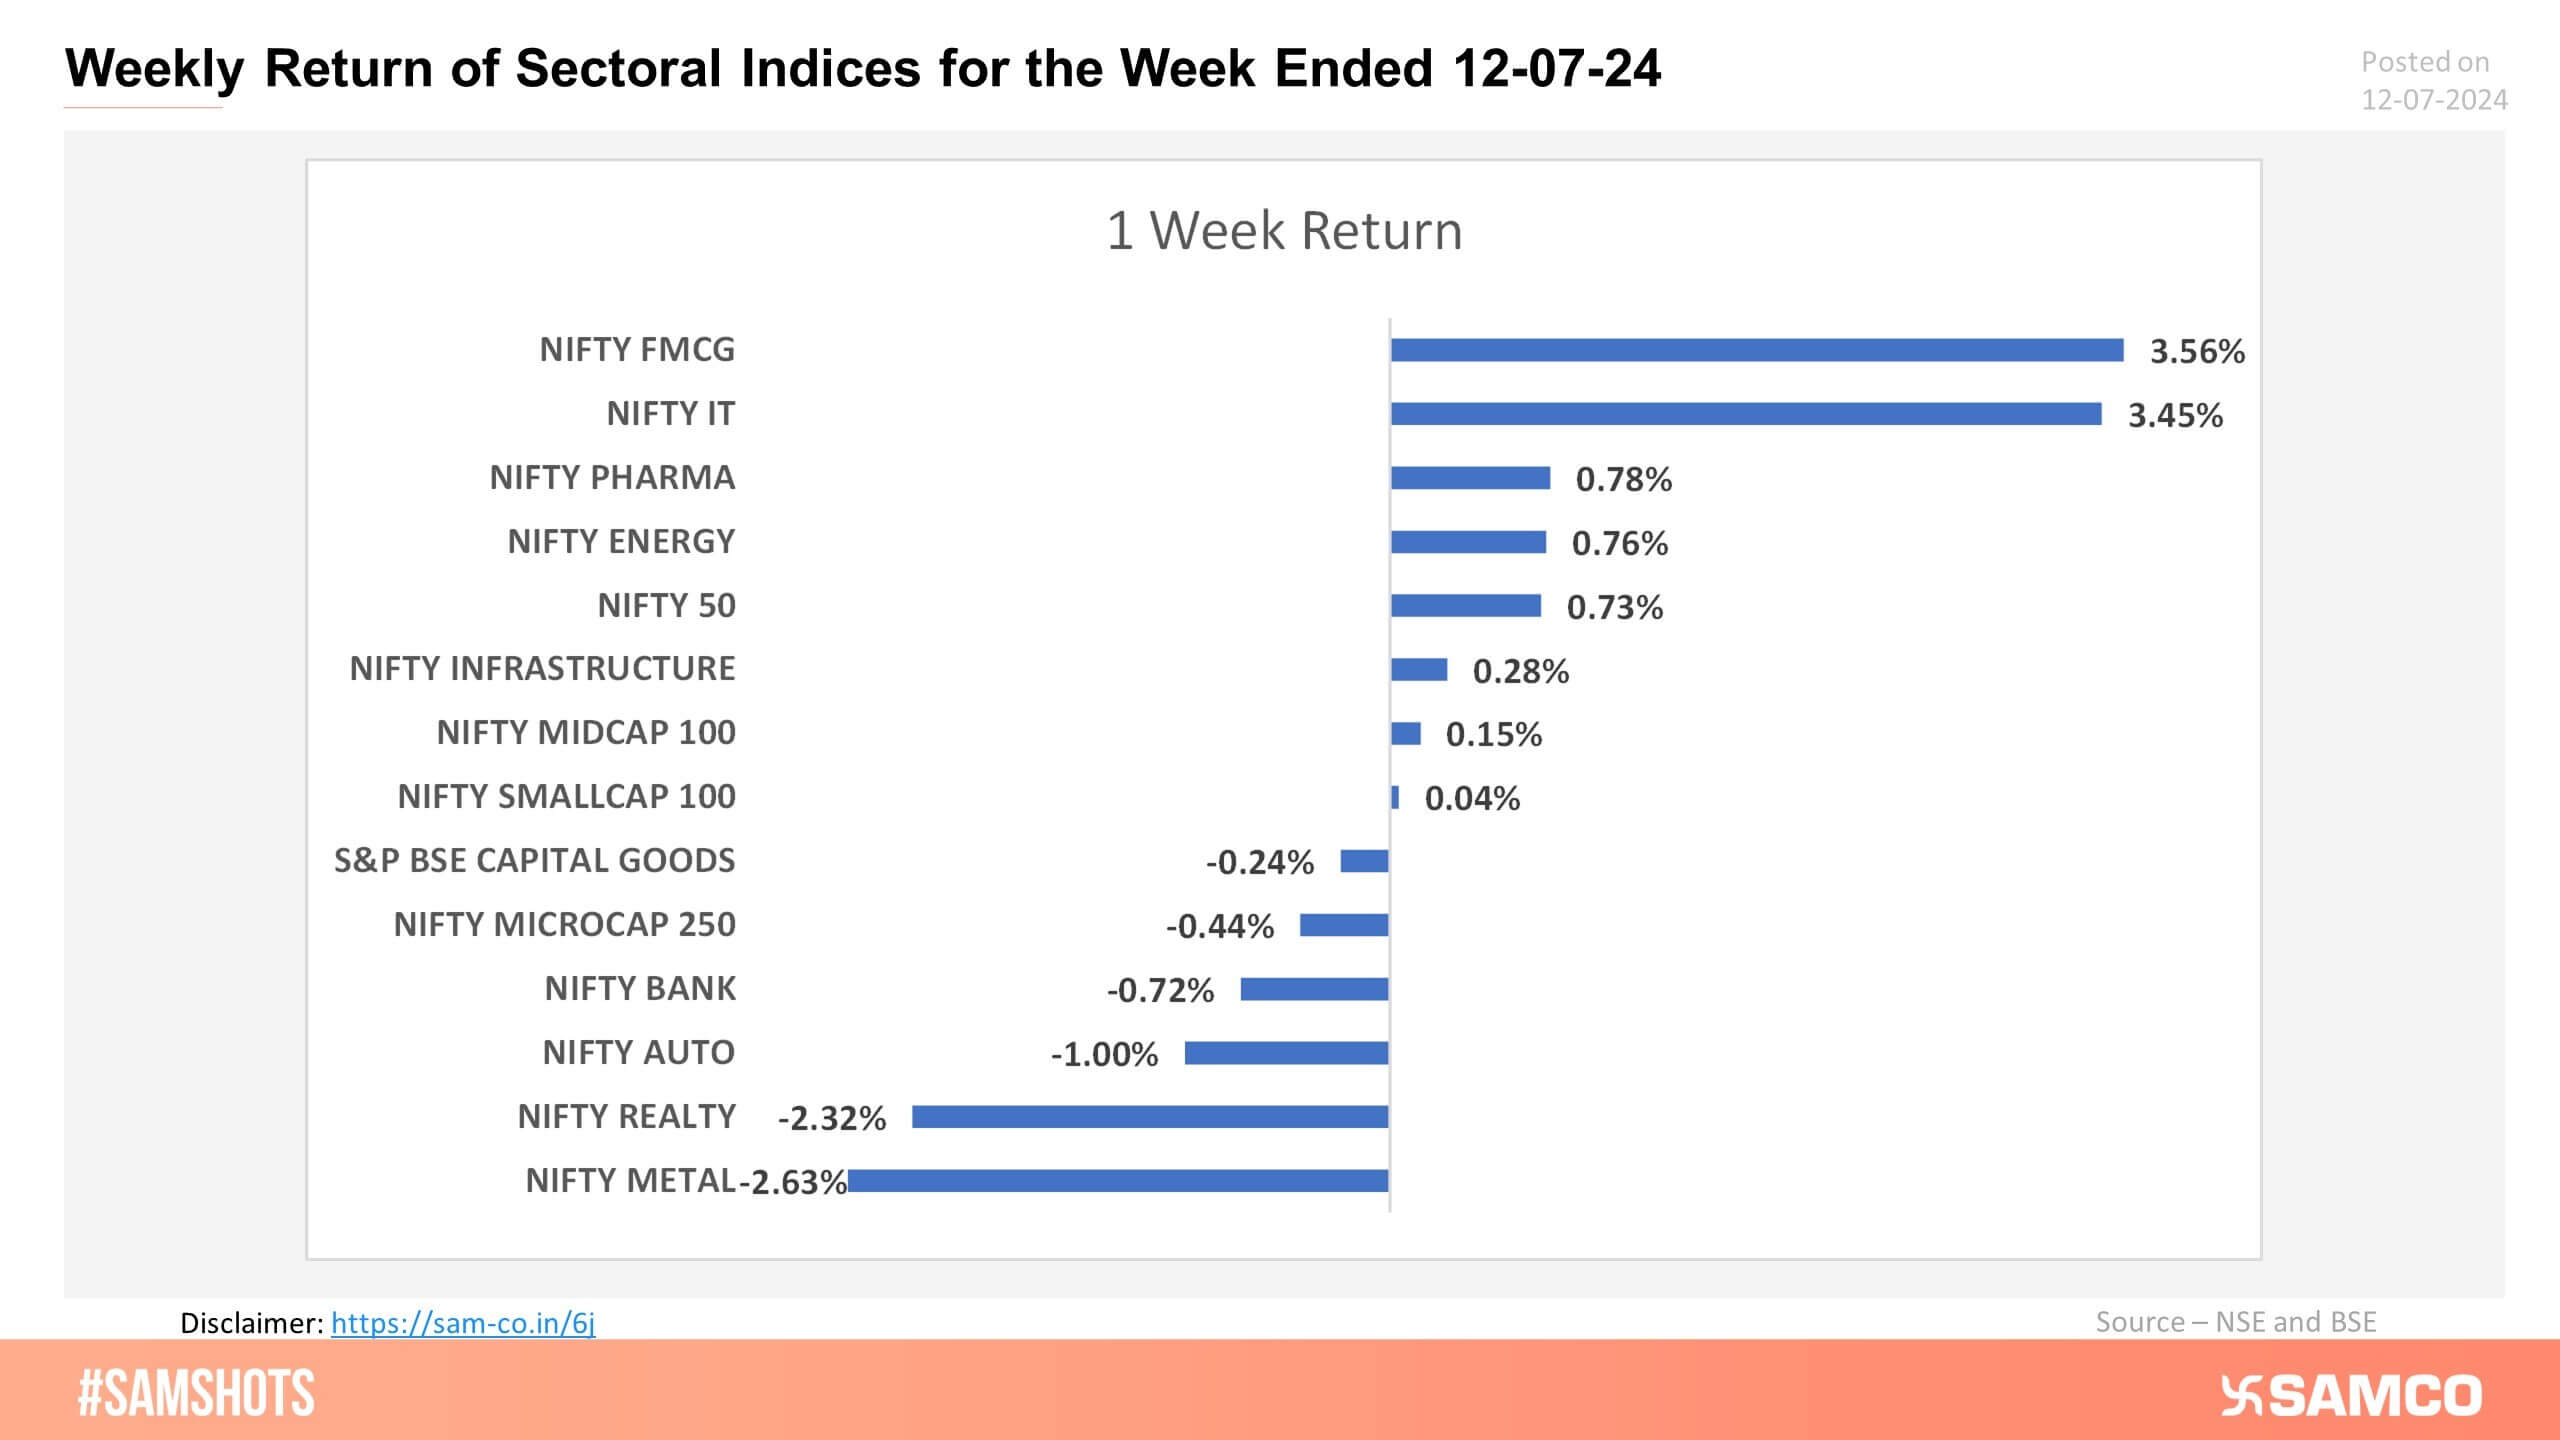
Nifty 50 ended the week 0.73% higher at 24,502. Nifty FMCG and Nifty IT surged the most with gains of 3.56%, and 3.45% respectively.
Scroll down to understand more of such market news and perspectives for the week gone by in easily understandable charts.
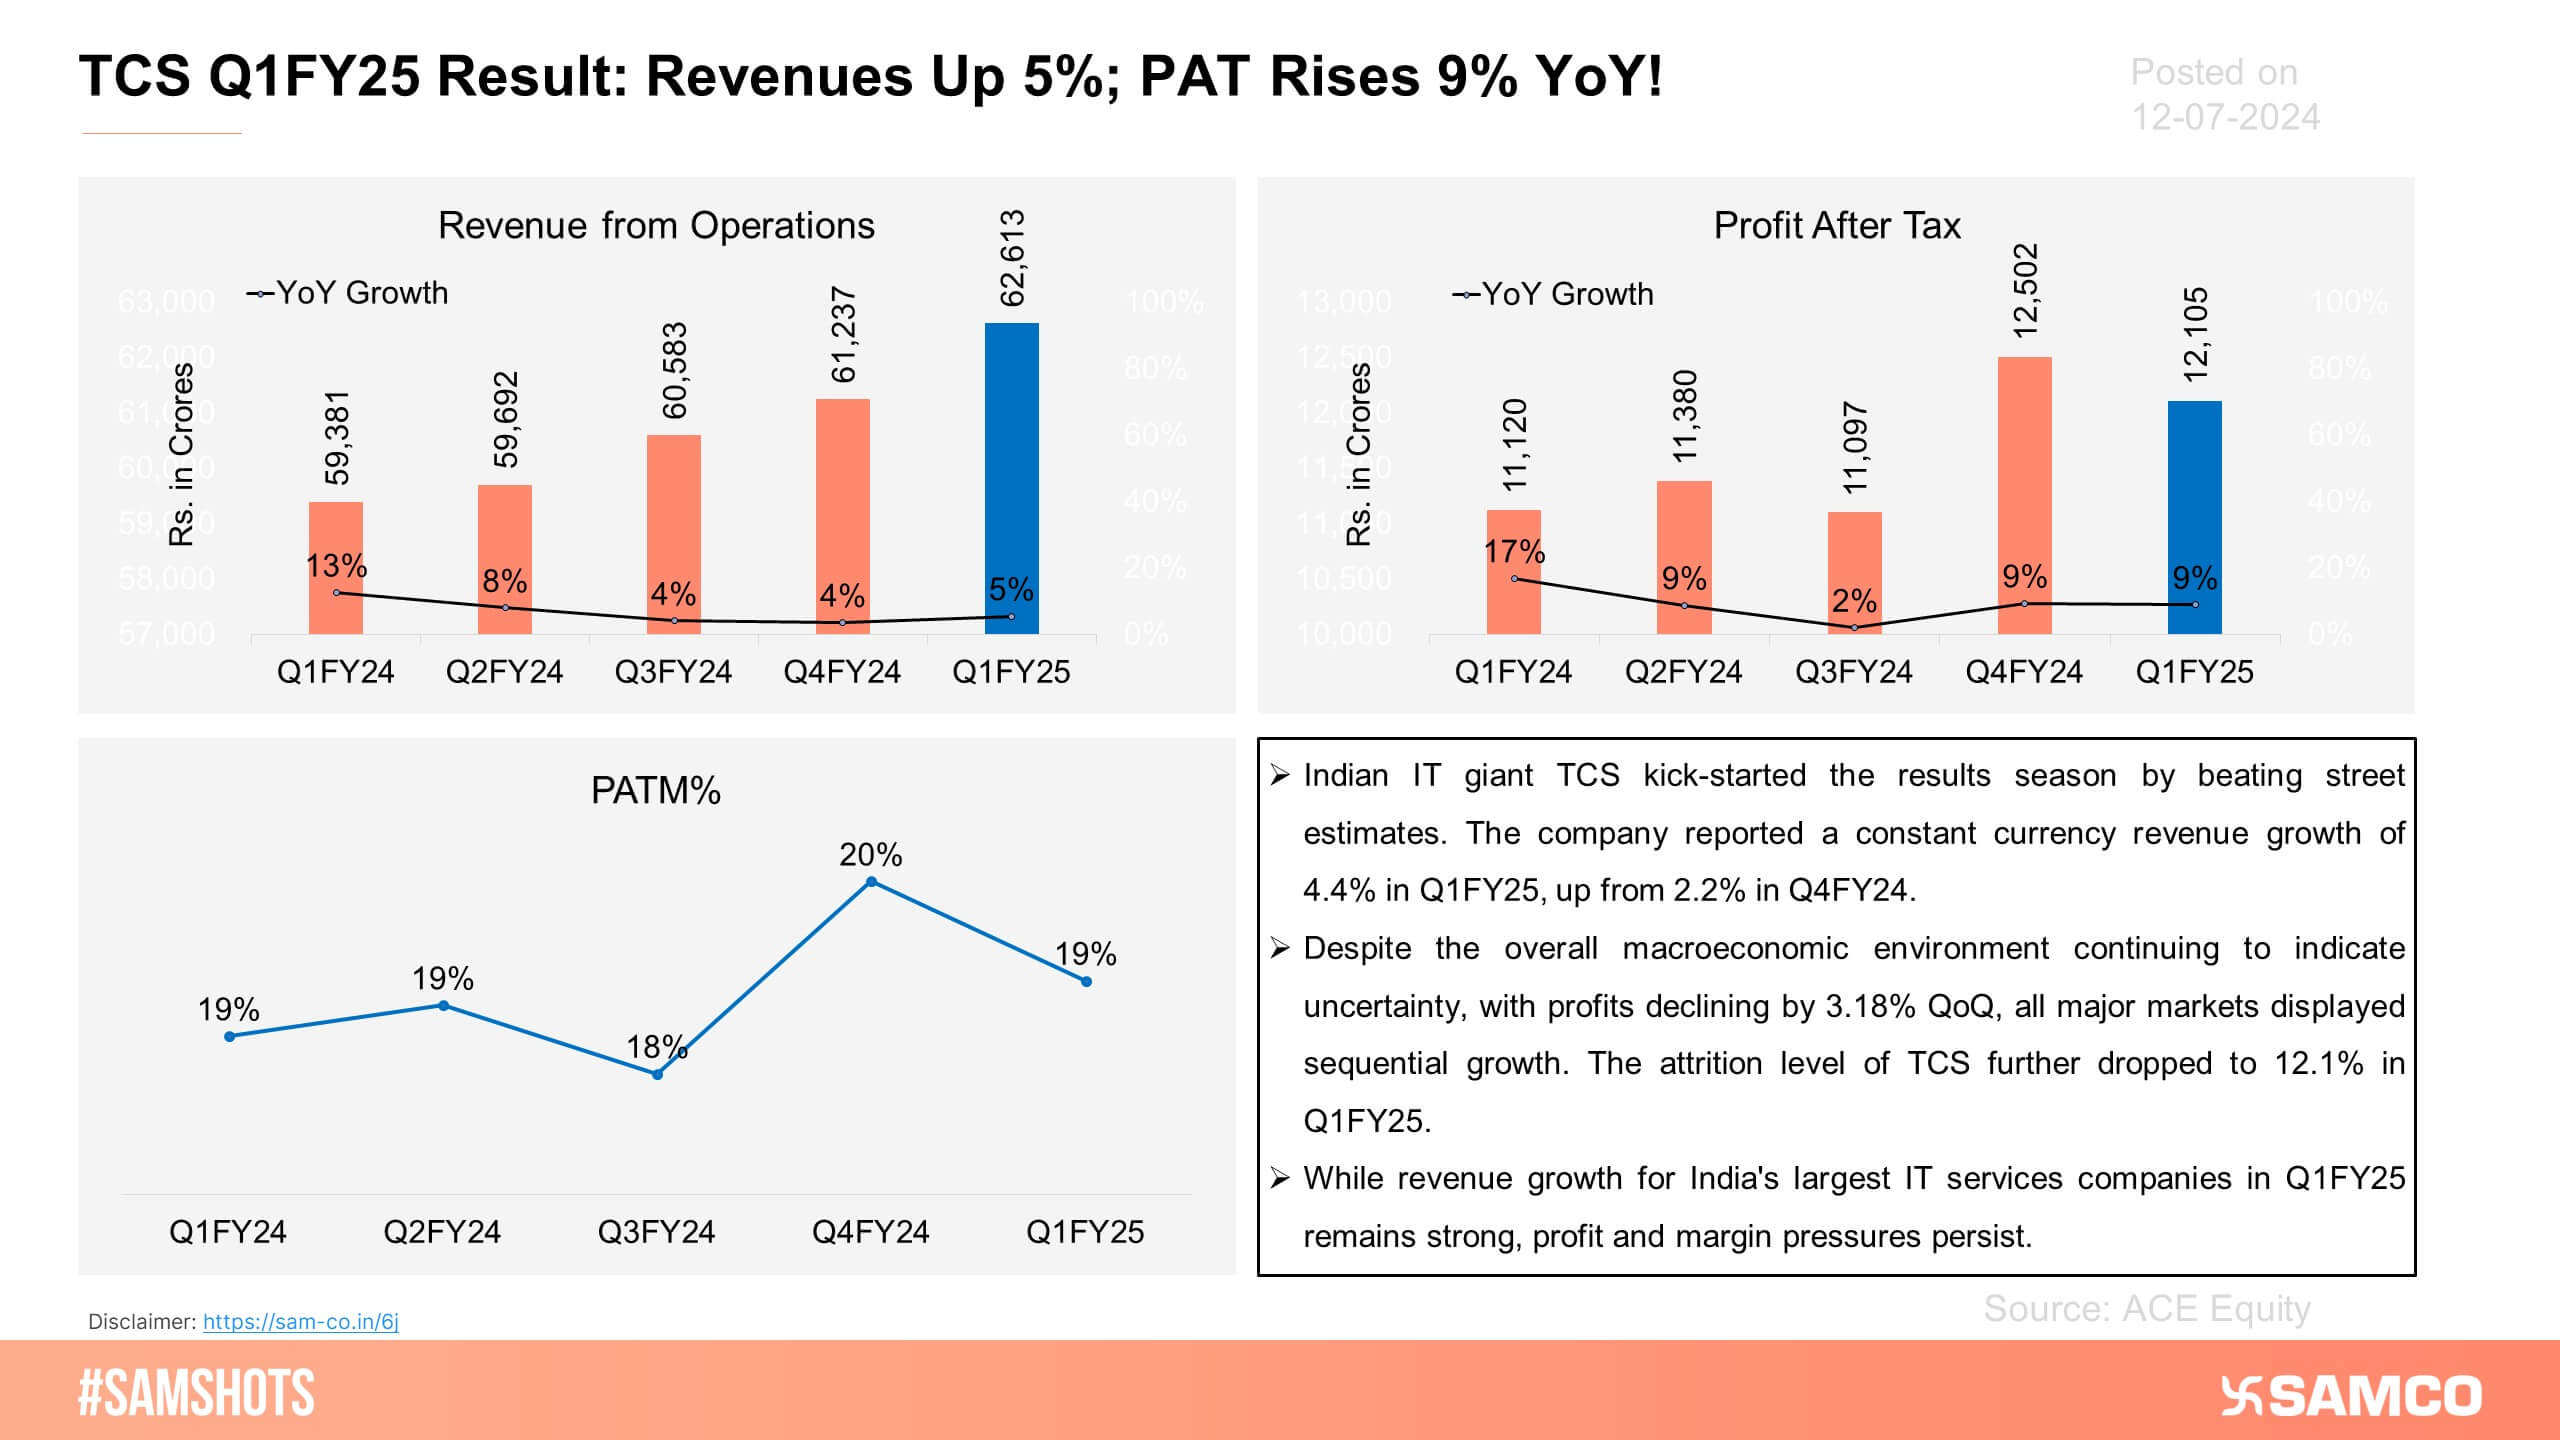
The above chart illustrates the robust performance of TCS in Q1FY25. The share price of TCS surged by over 4% on Friday over strong Q1FY25 result.


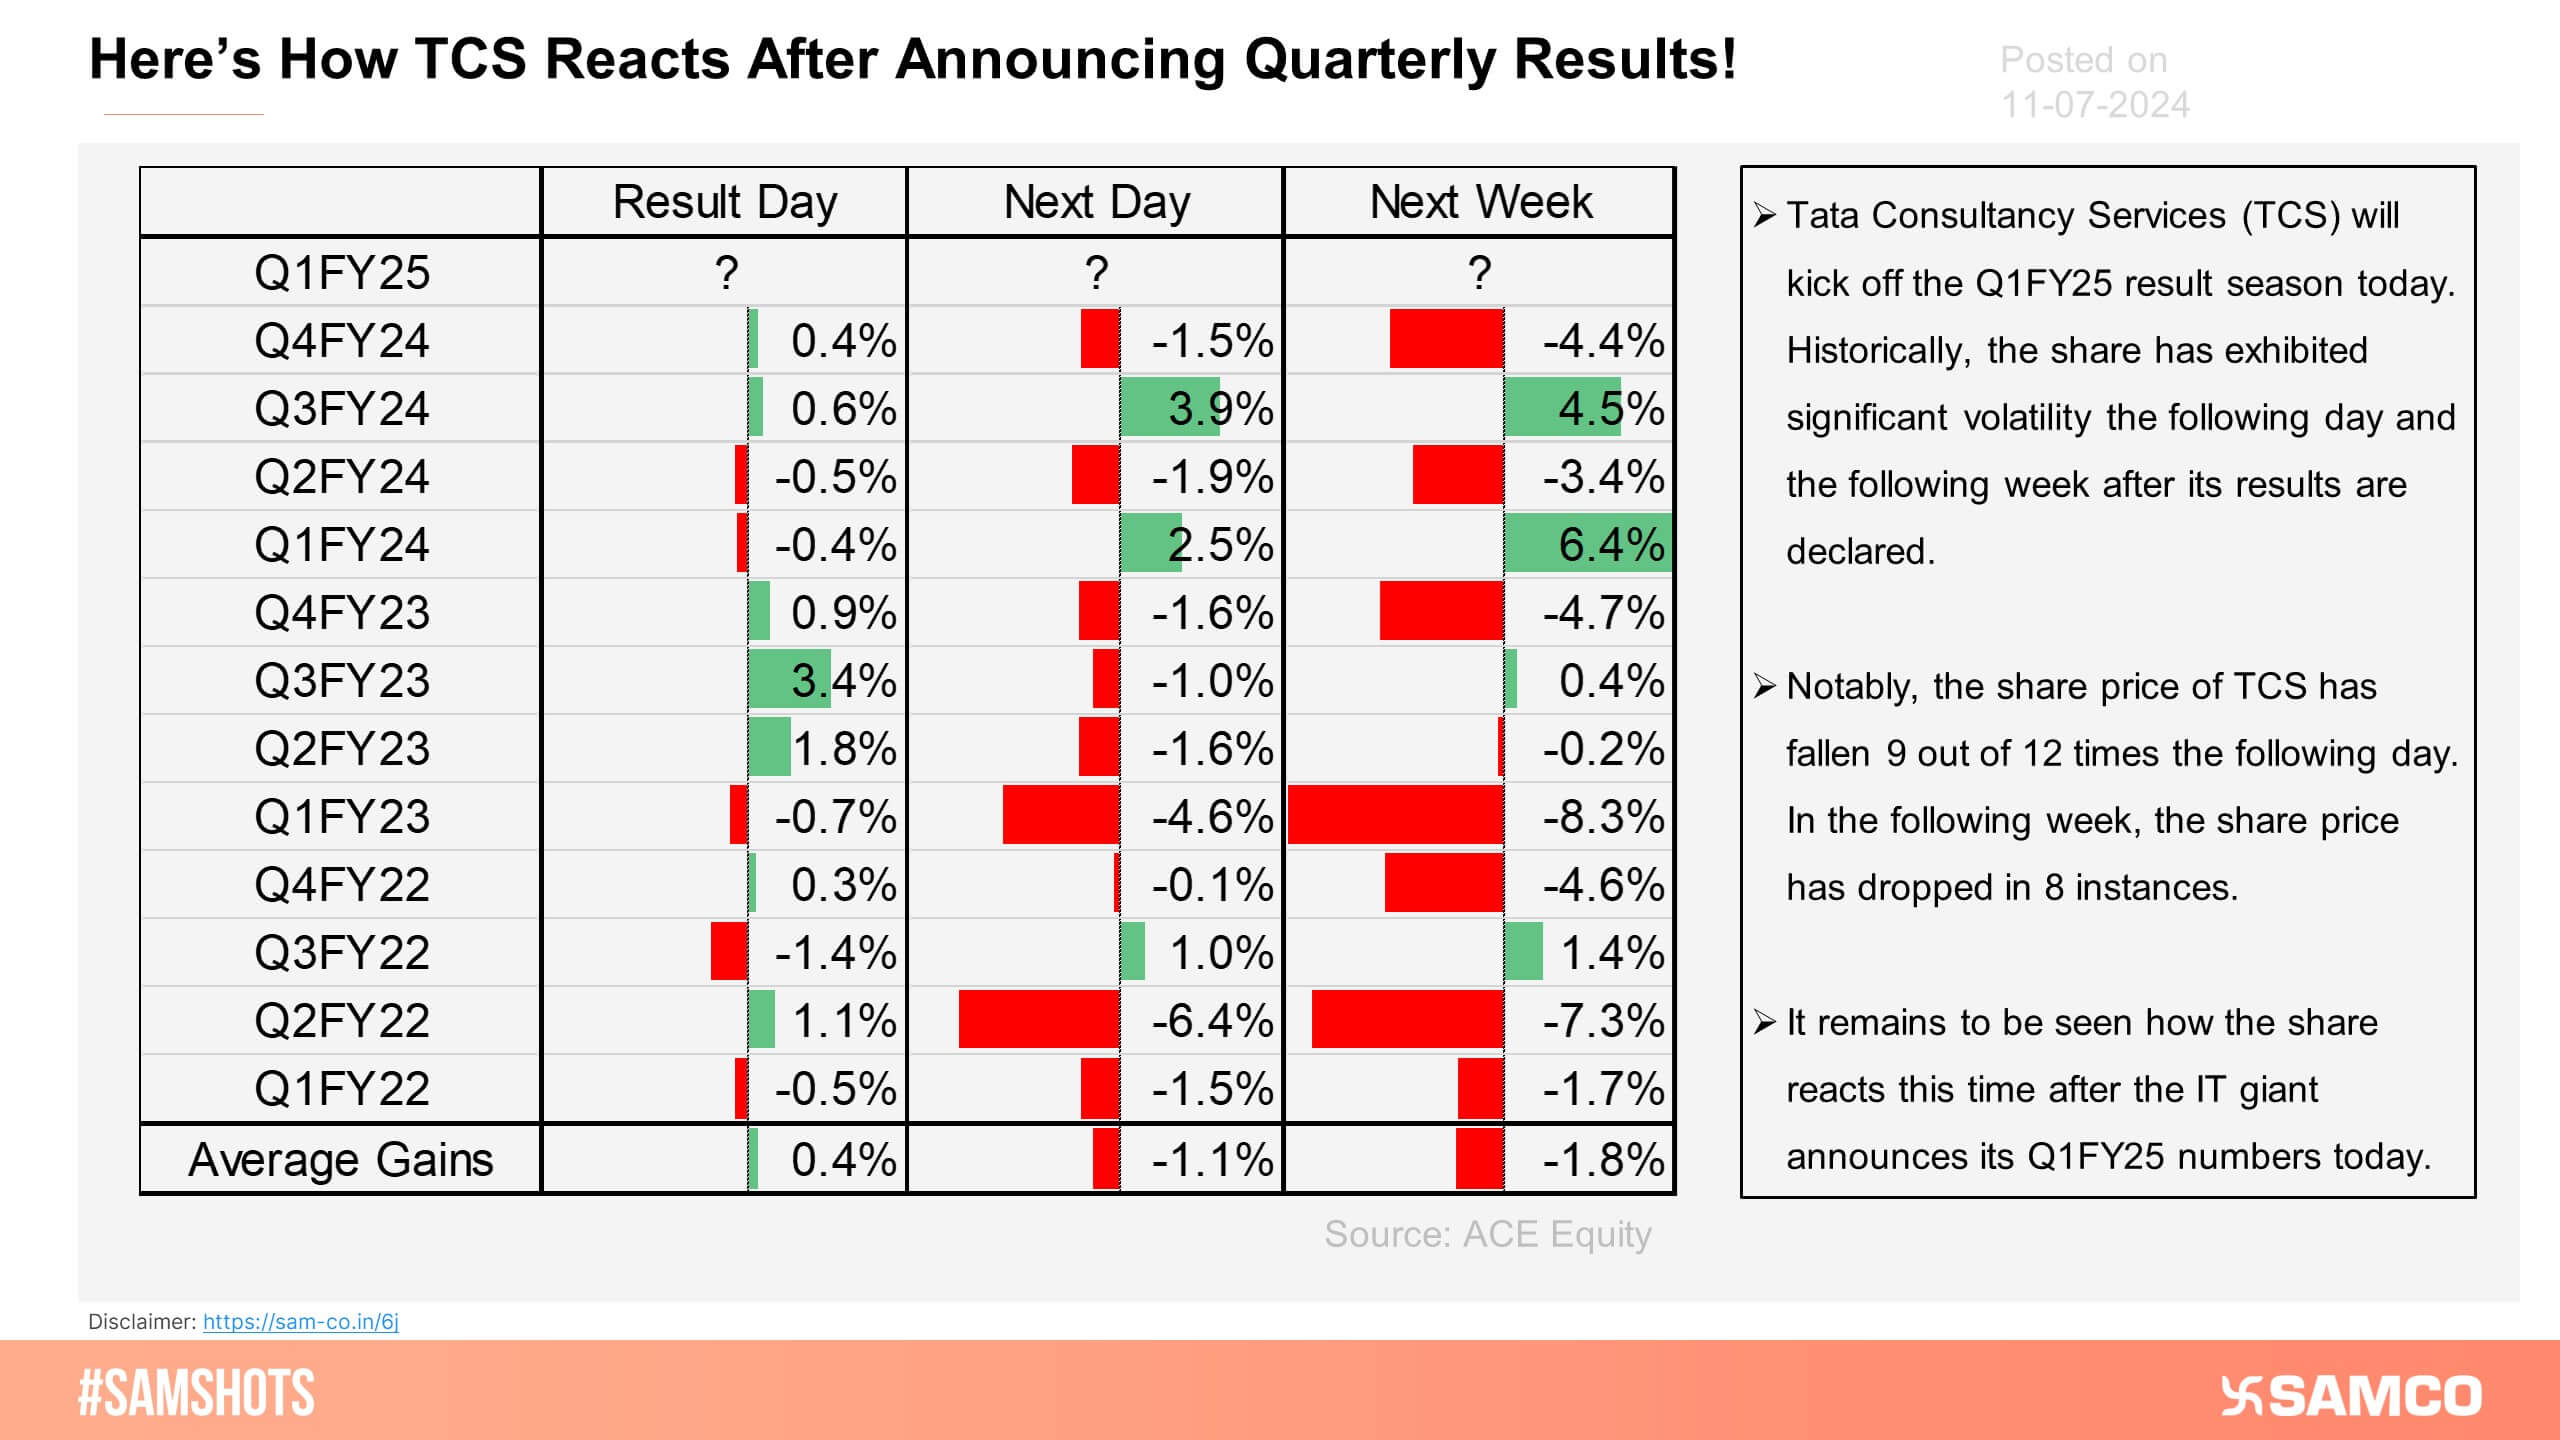
The above chart indicates the share price movements of TCS after it announces quarterly results.
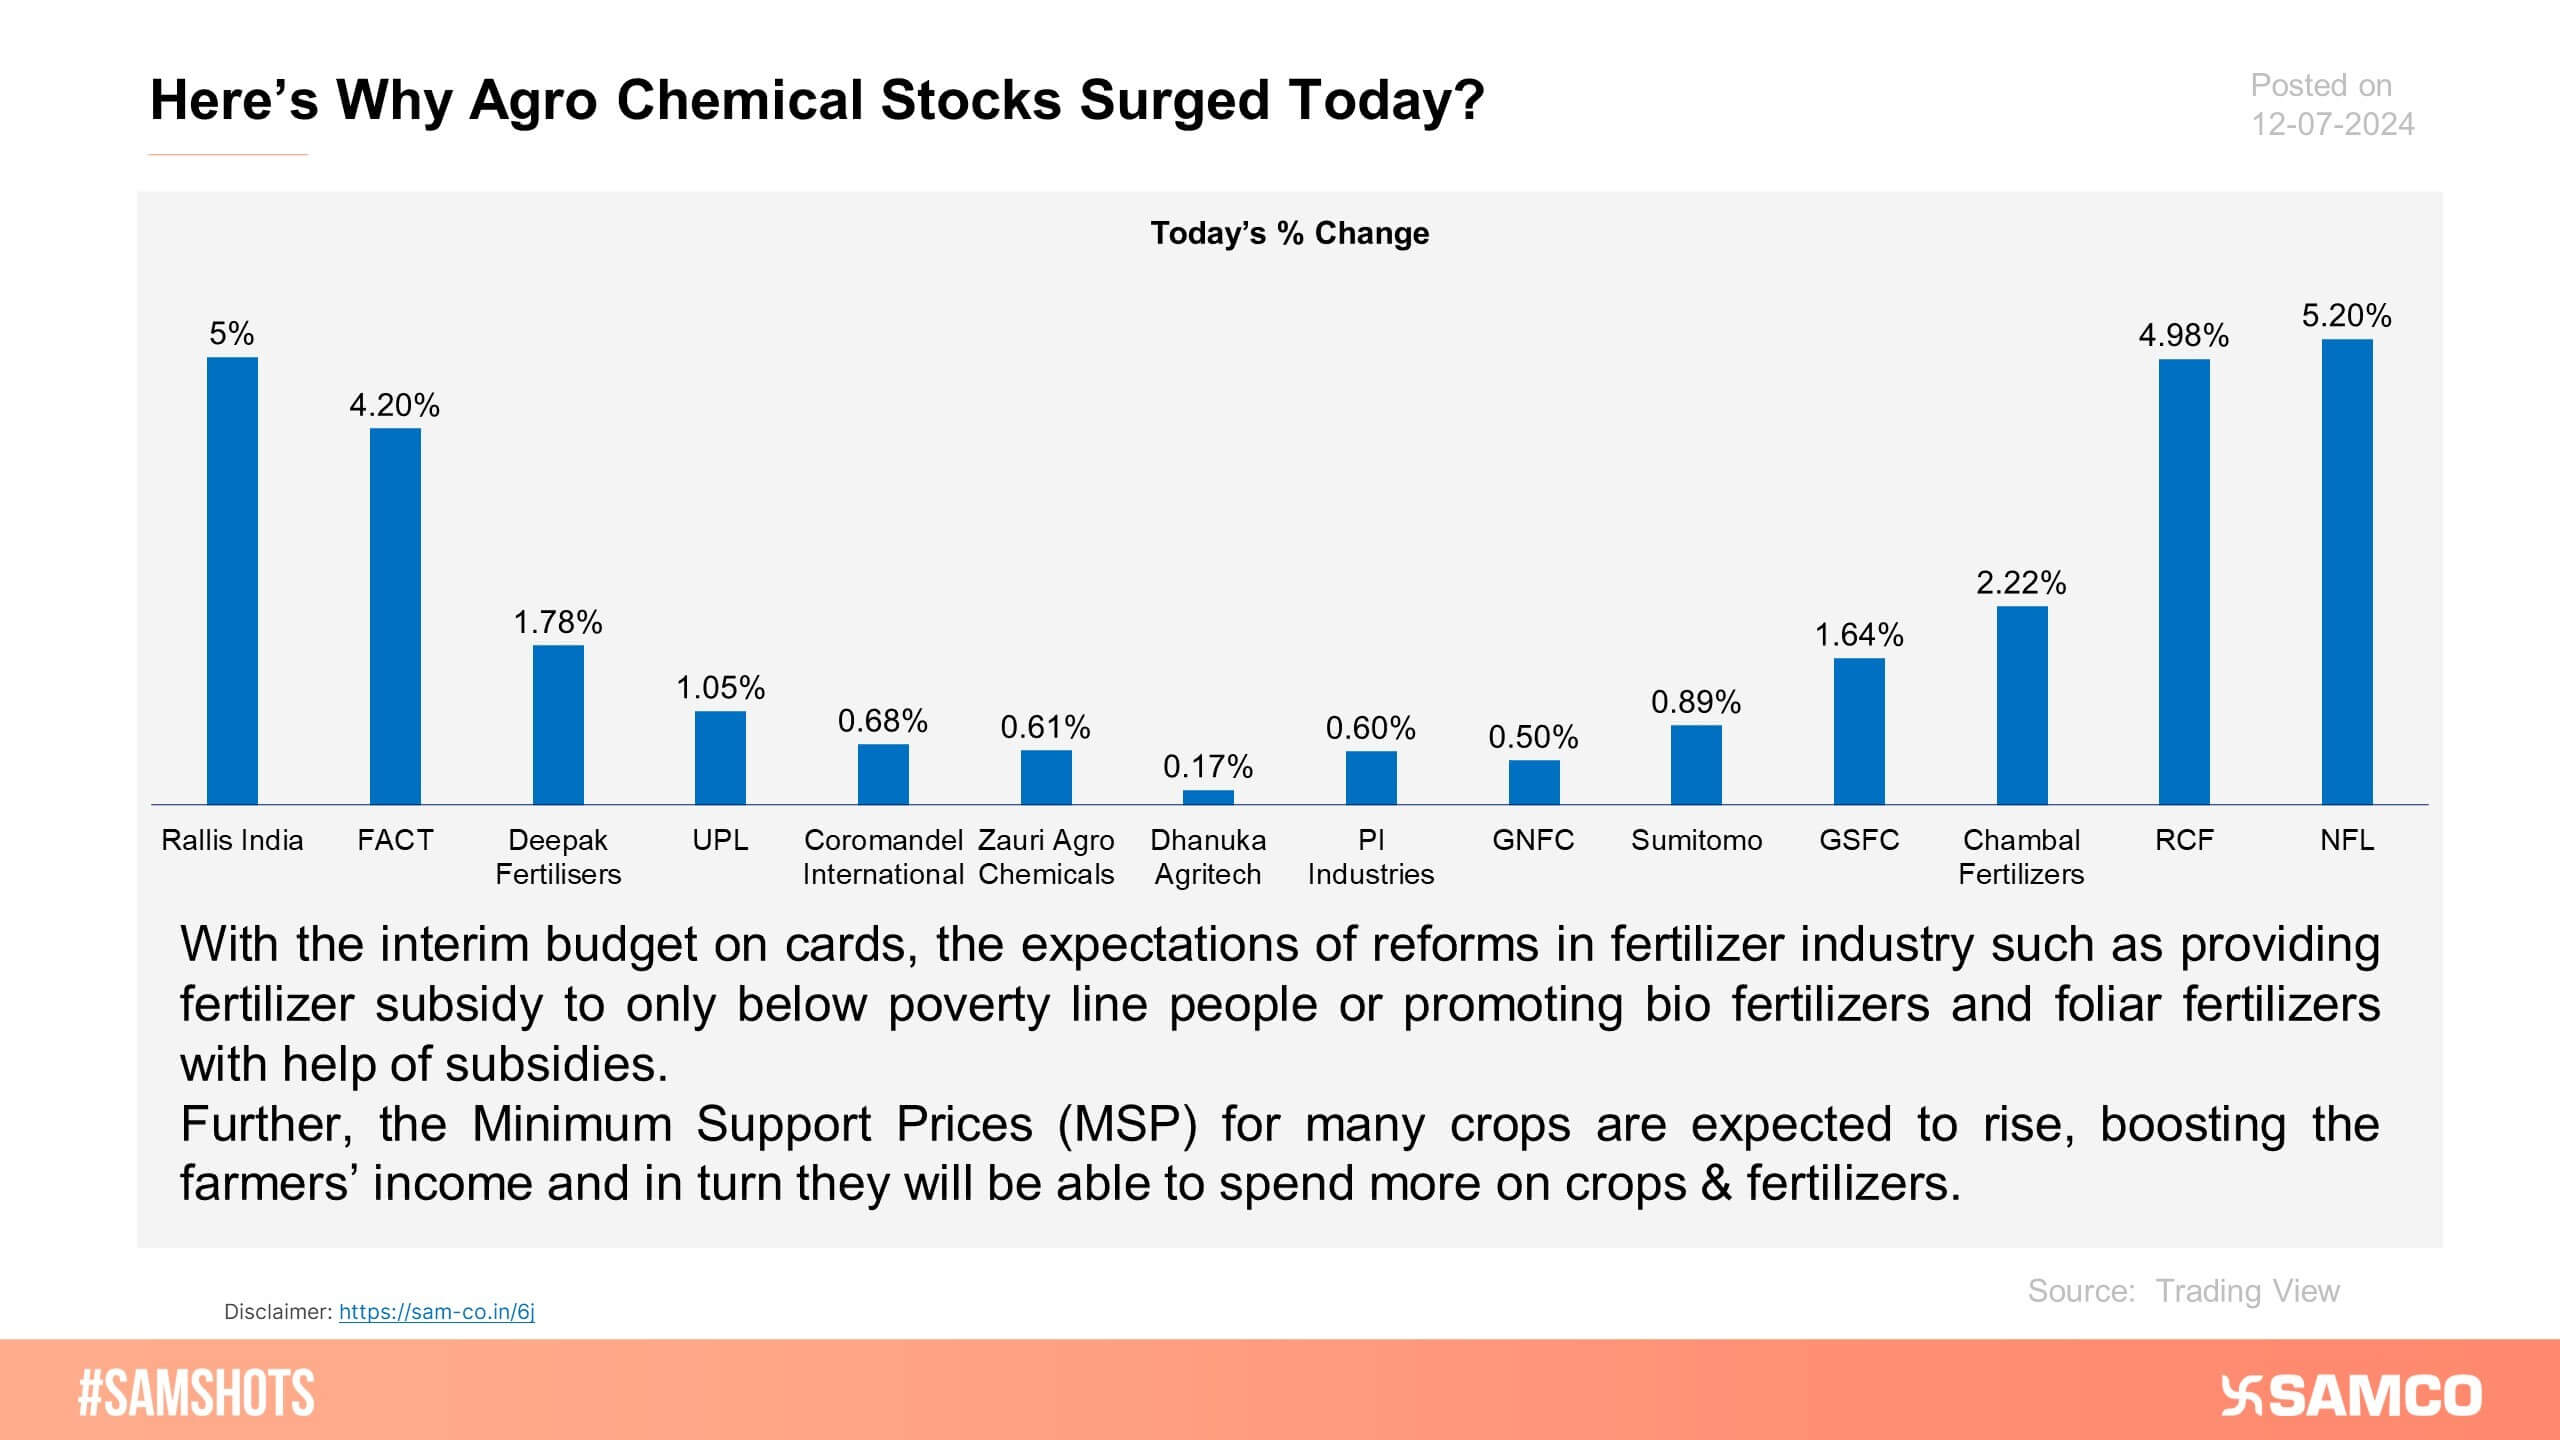
Here’s why agrochemical stocks witnessed a surge in share price on Friday!
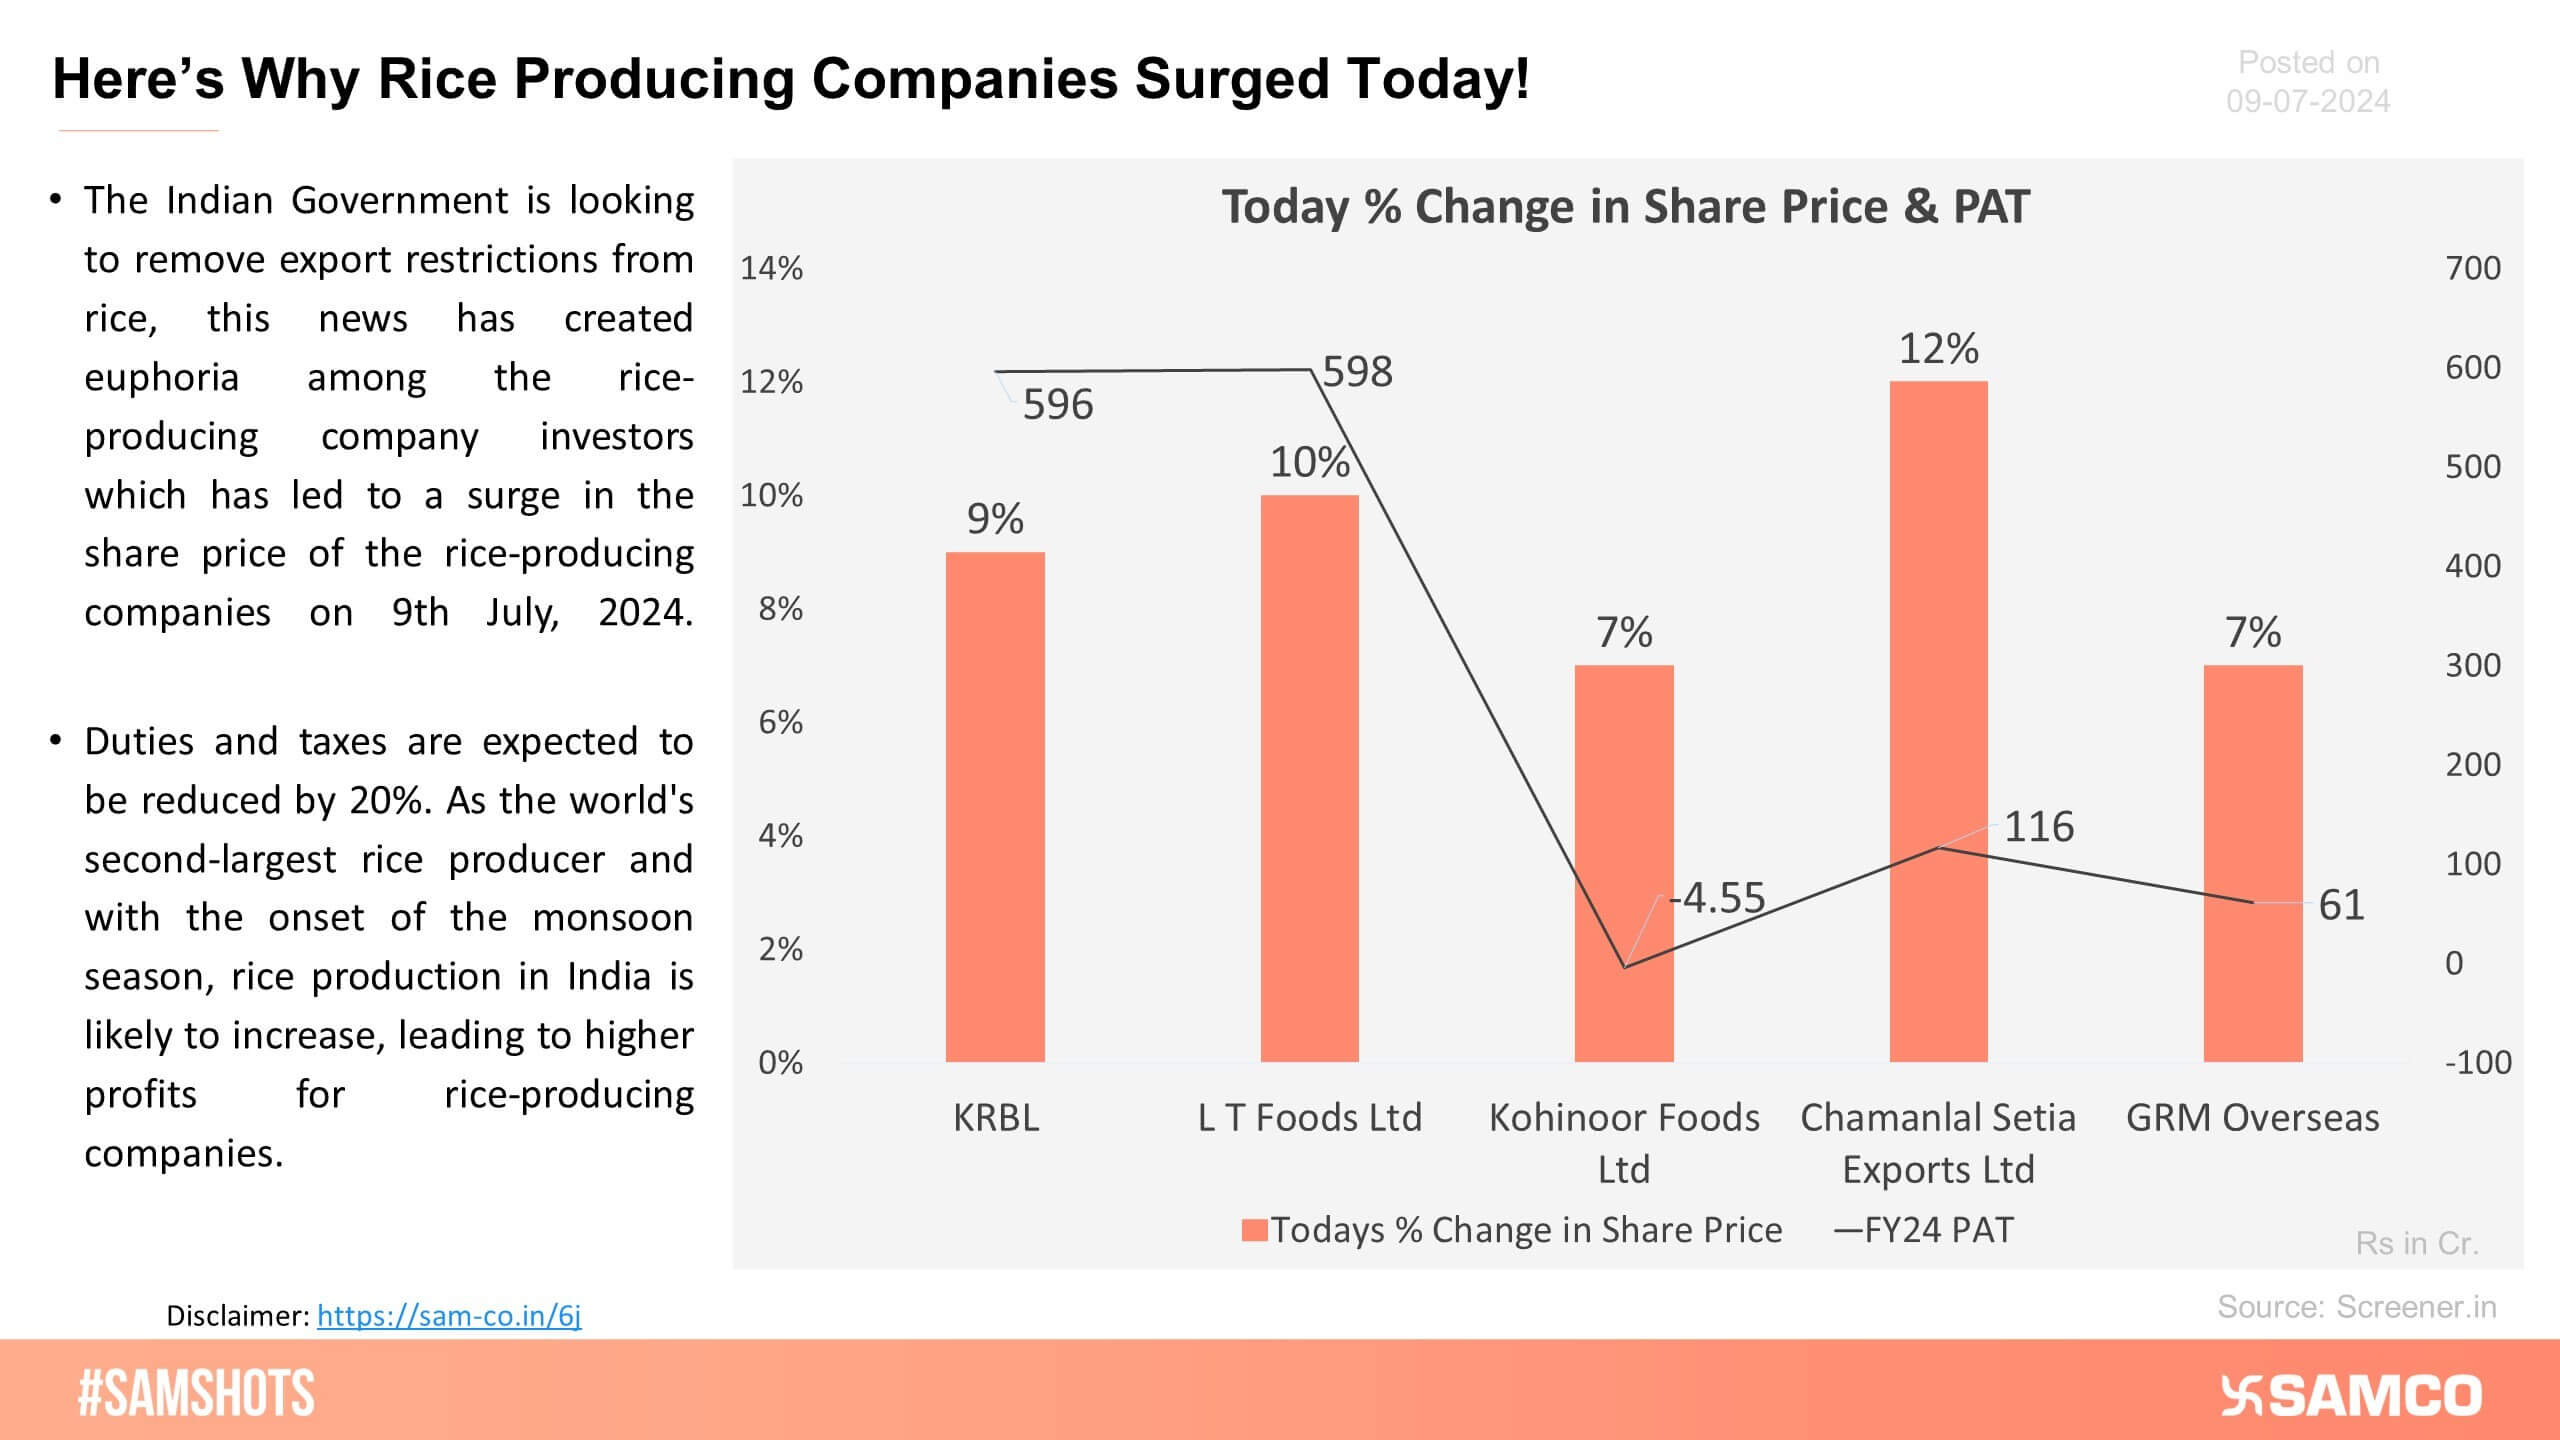
Shares of rice-producing companies attracted investors as the government plans to remove export restrictions on rice.
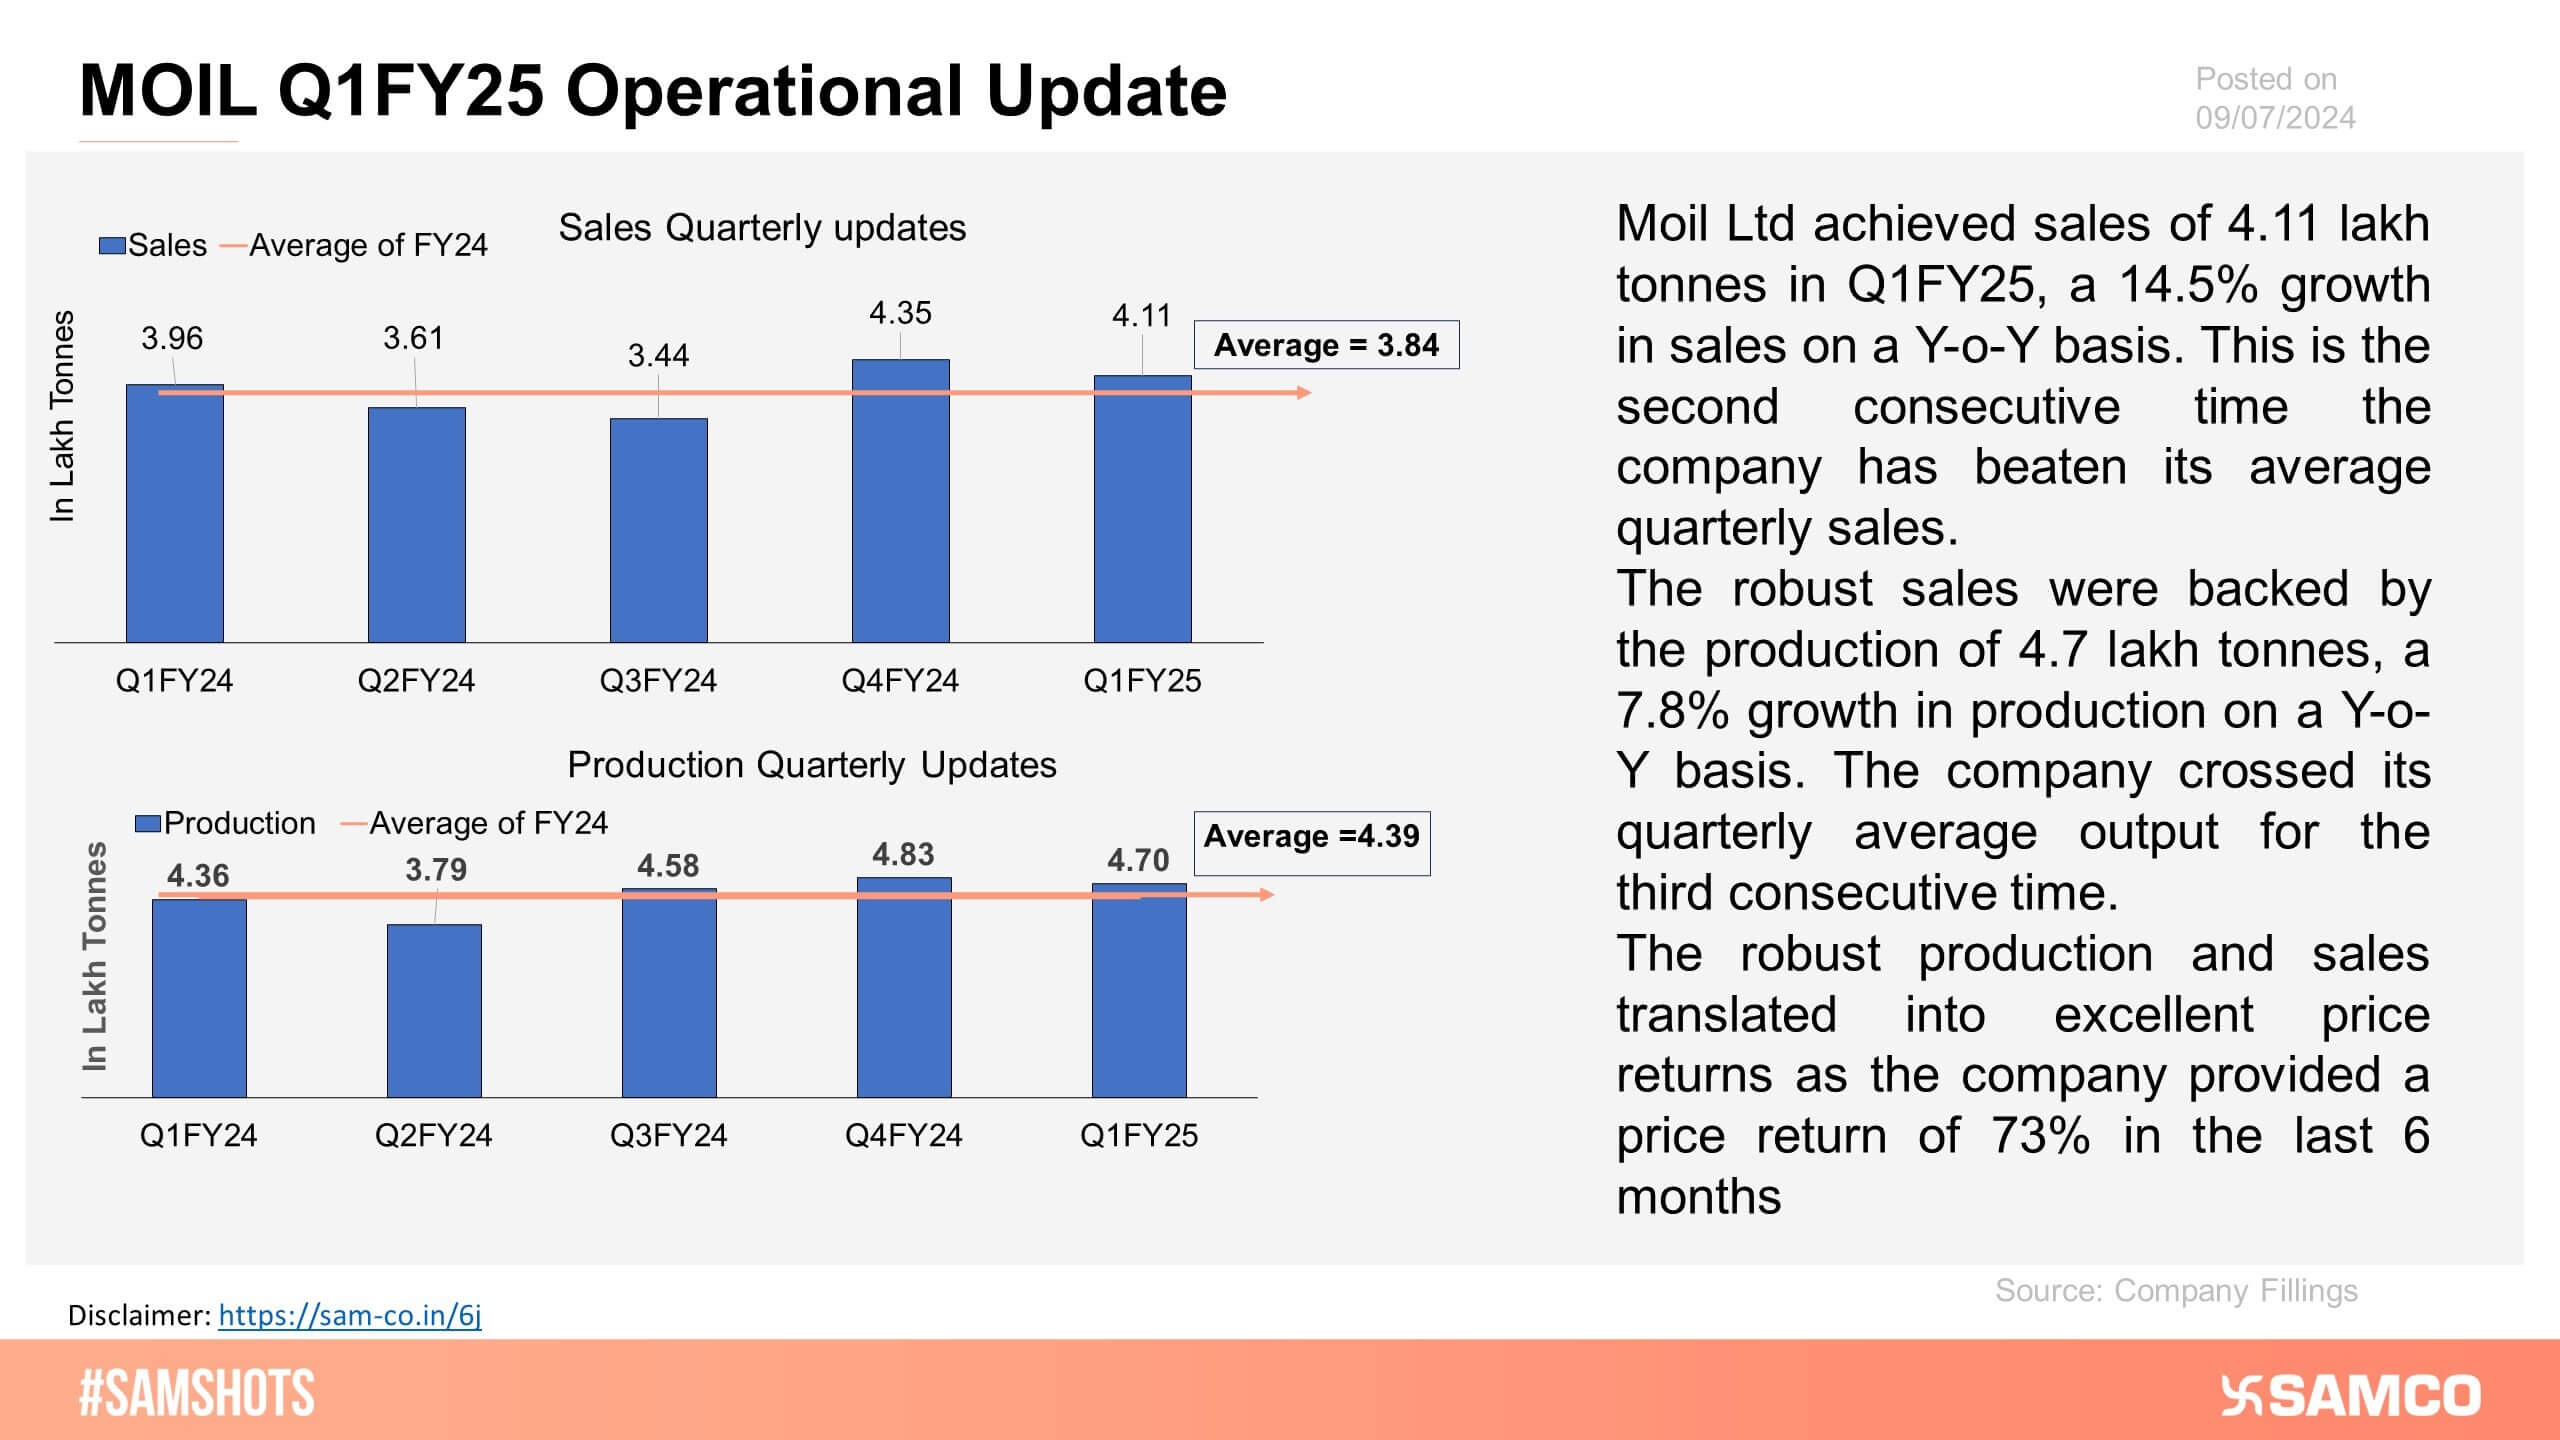
Here’s the production and sales volume update for MOIL for Q1FY25!
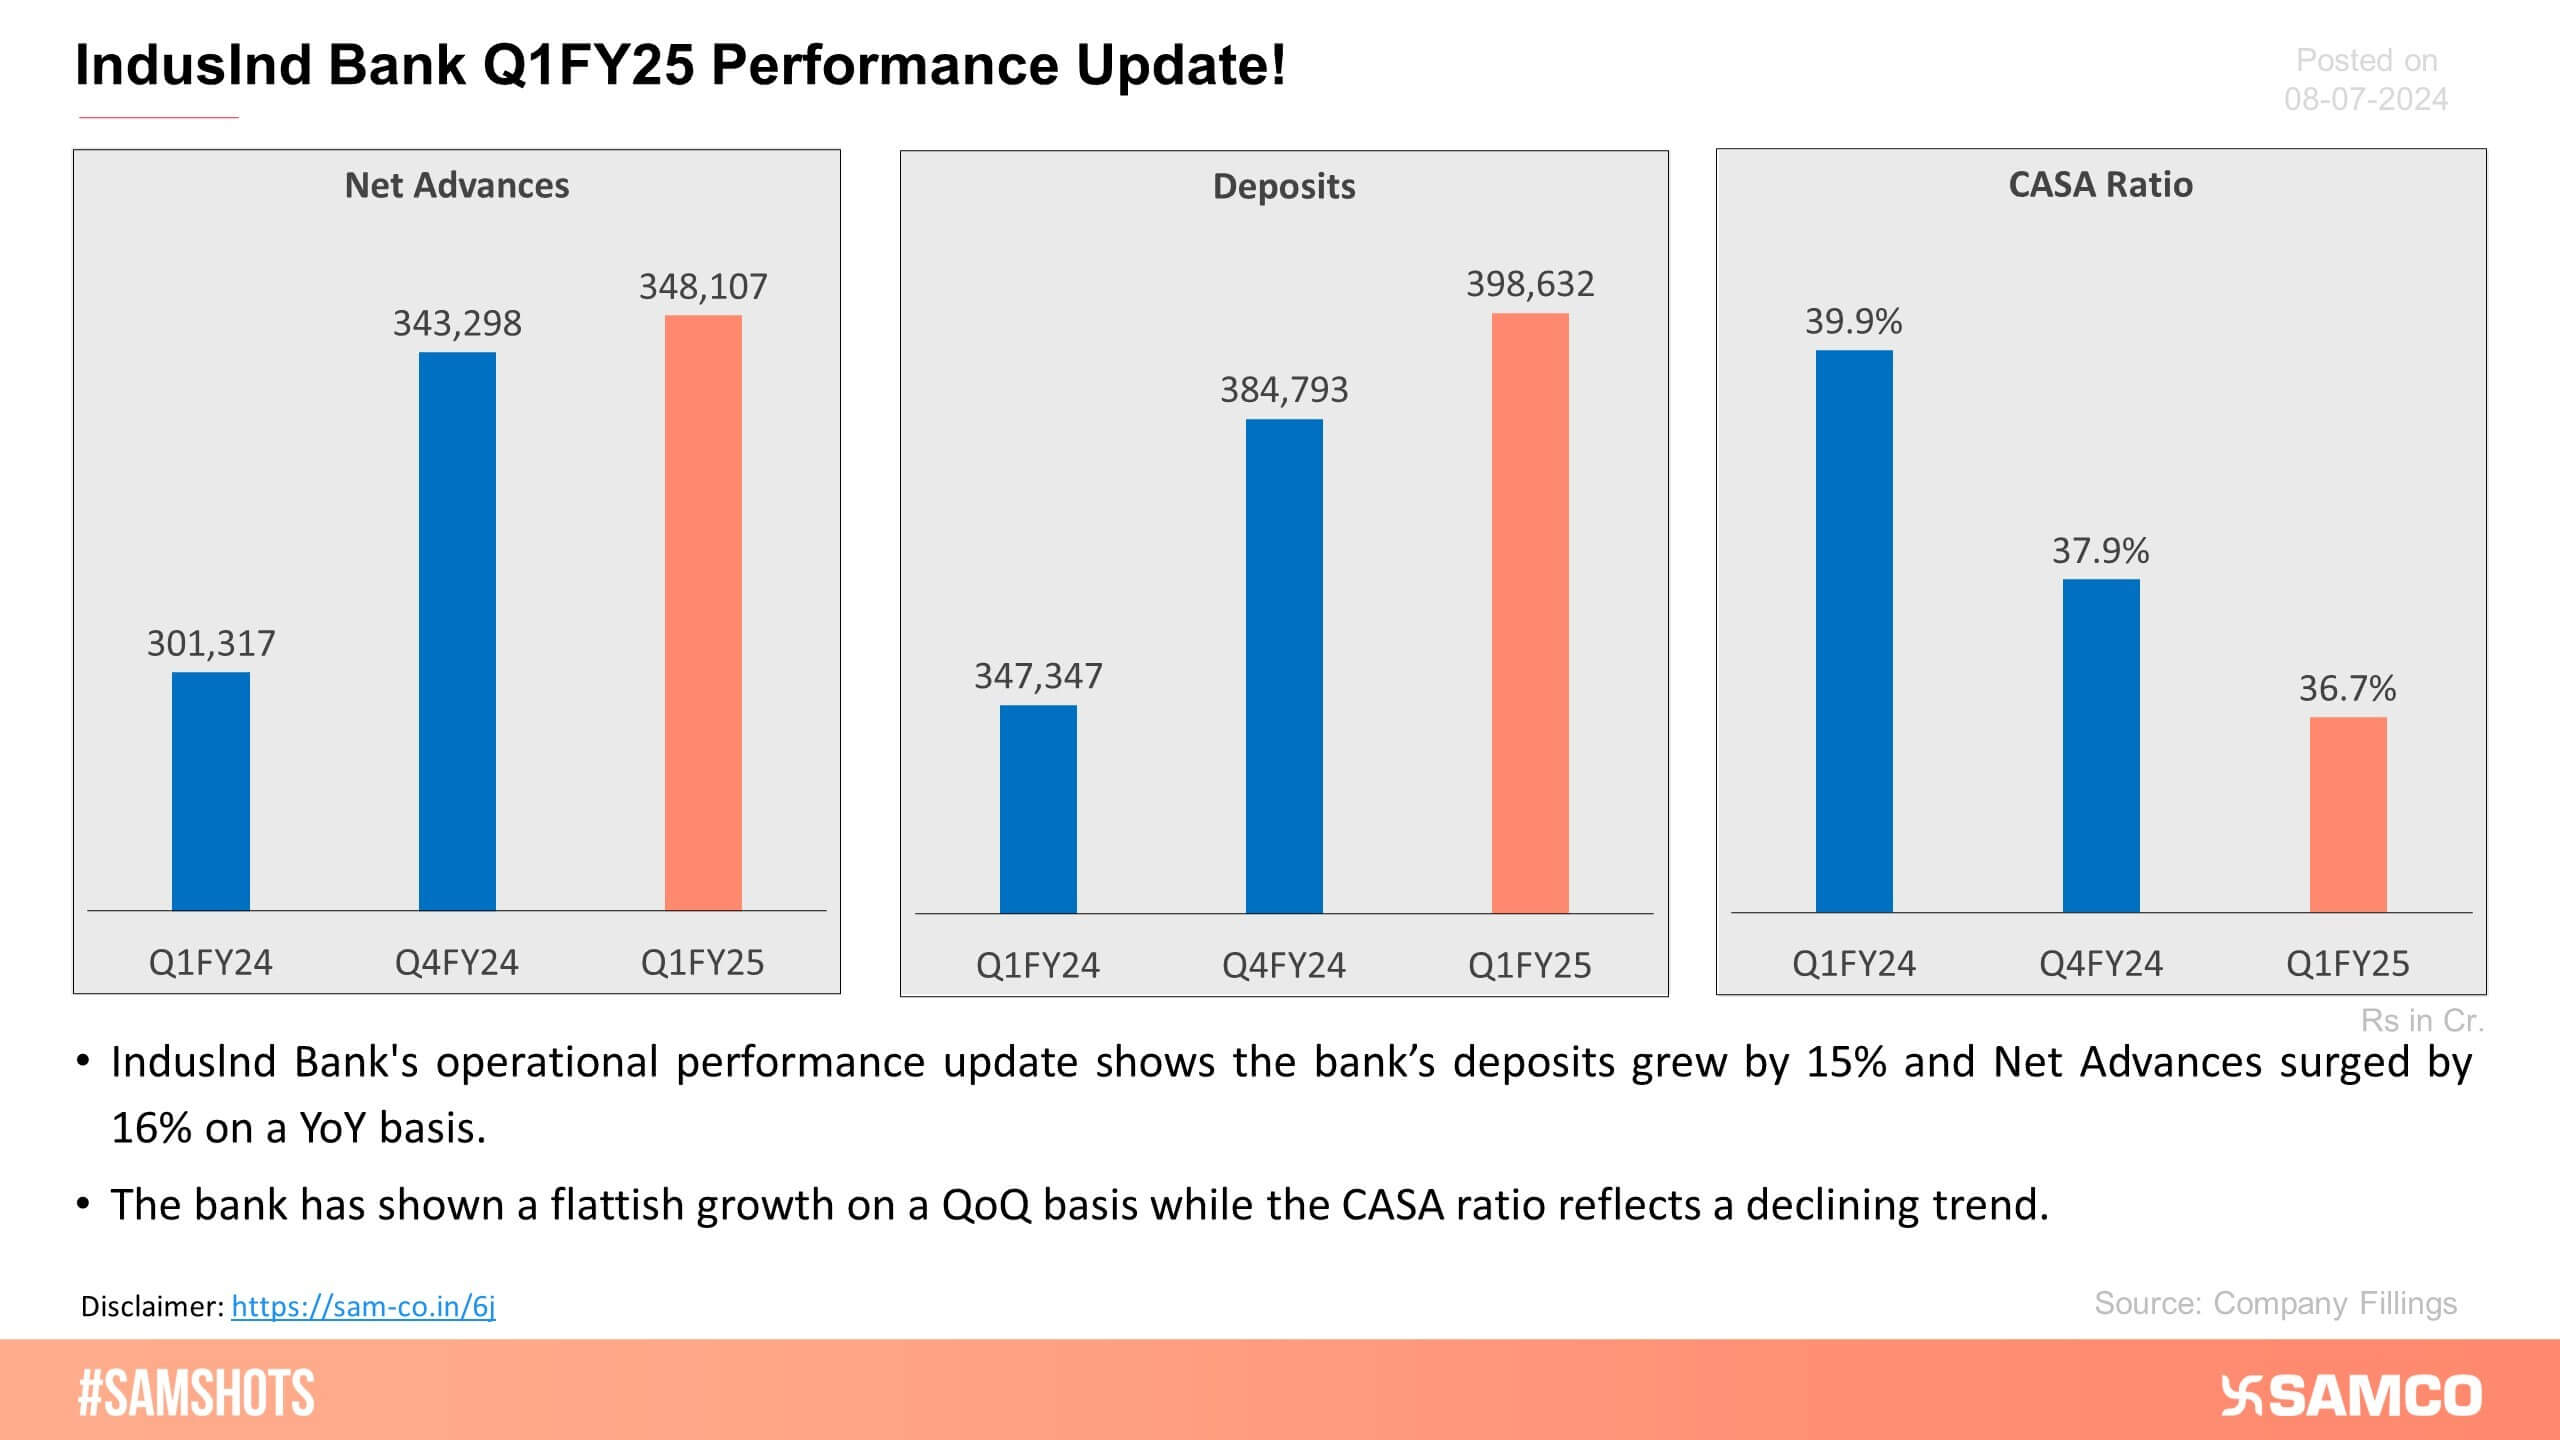
Here’s IndusInd Bank\'s performance update for Q1FY25!
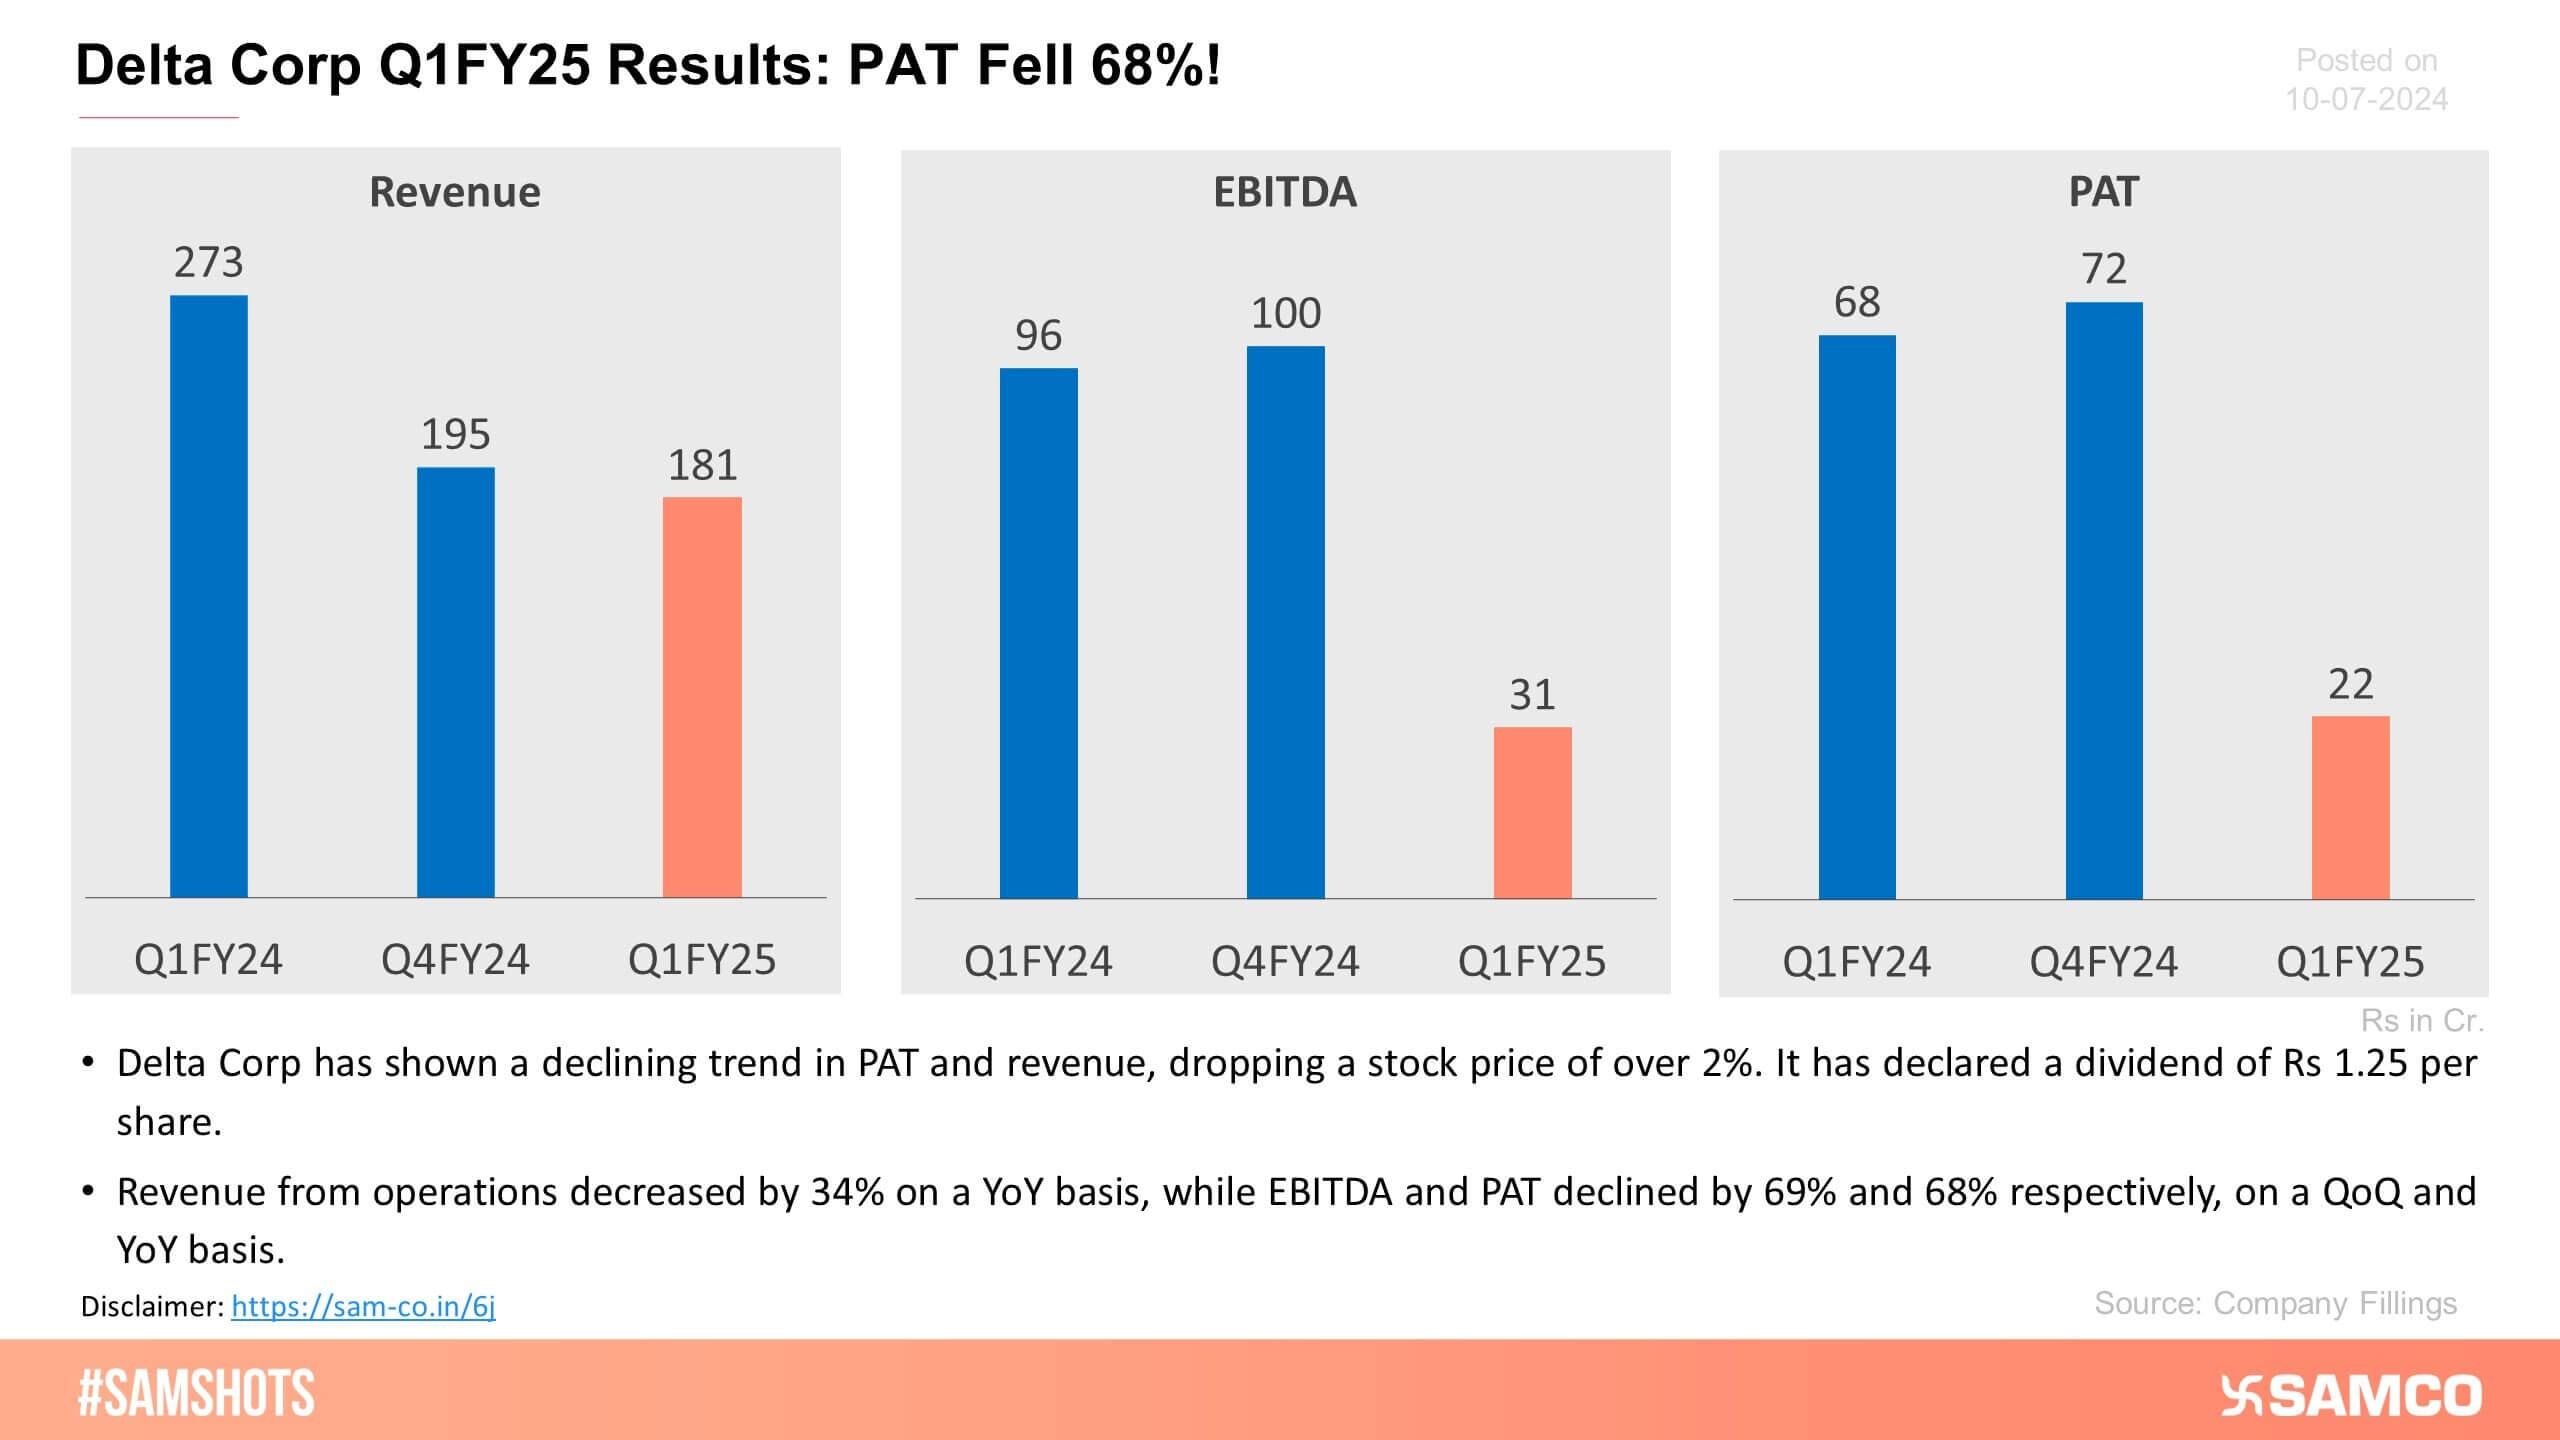
Delta Corp Ltd disappointed its stakeholders with negative growth in its Q1 FY25 performance.
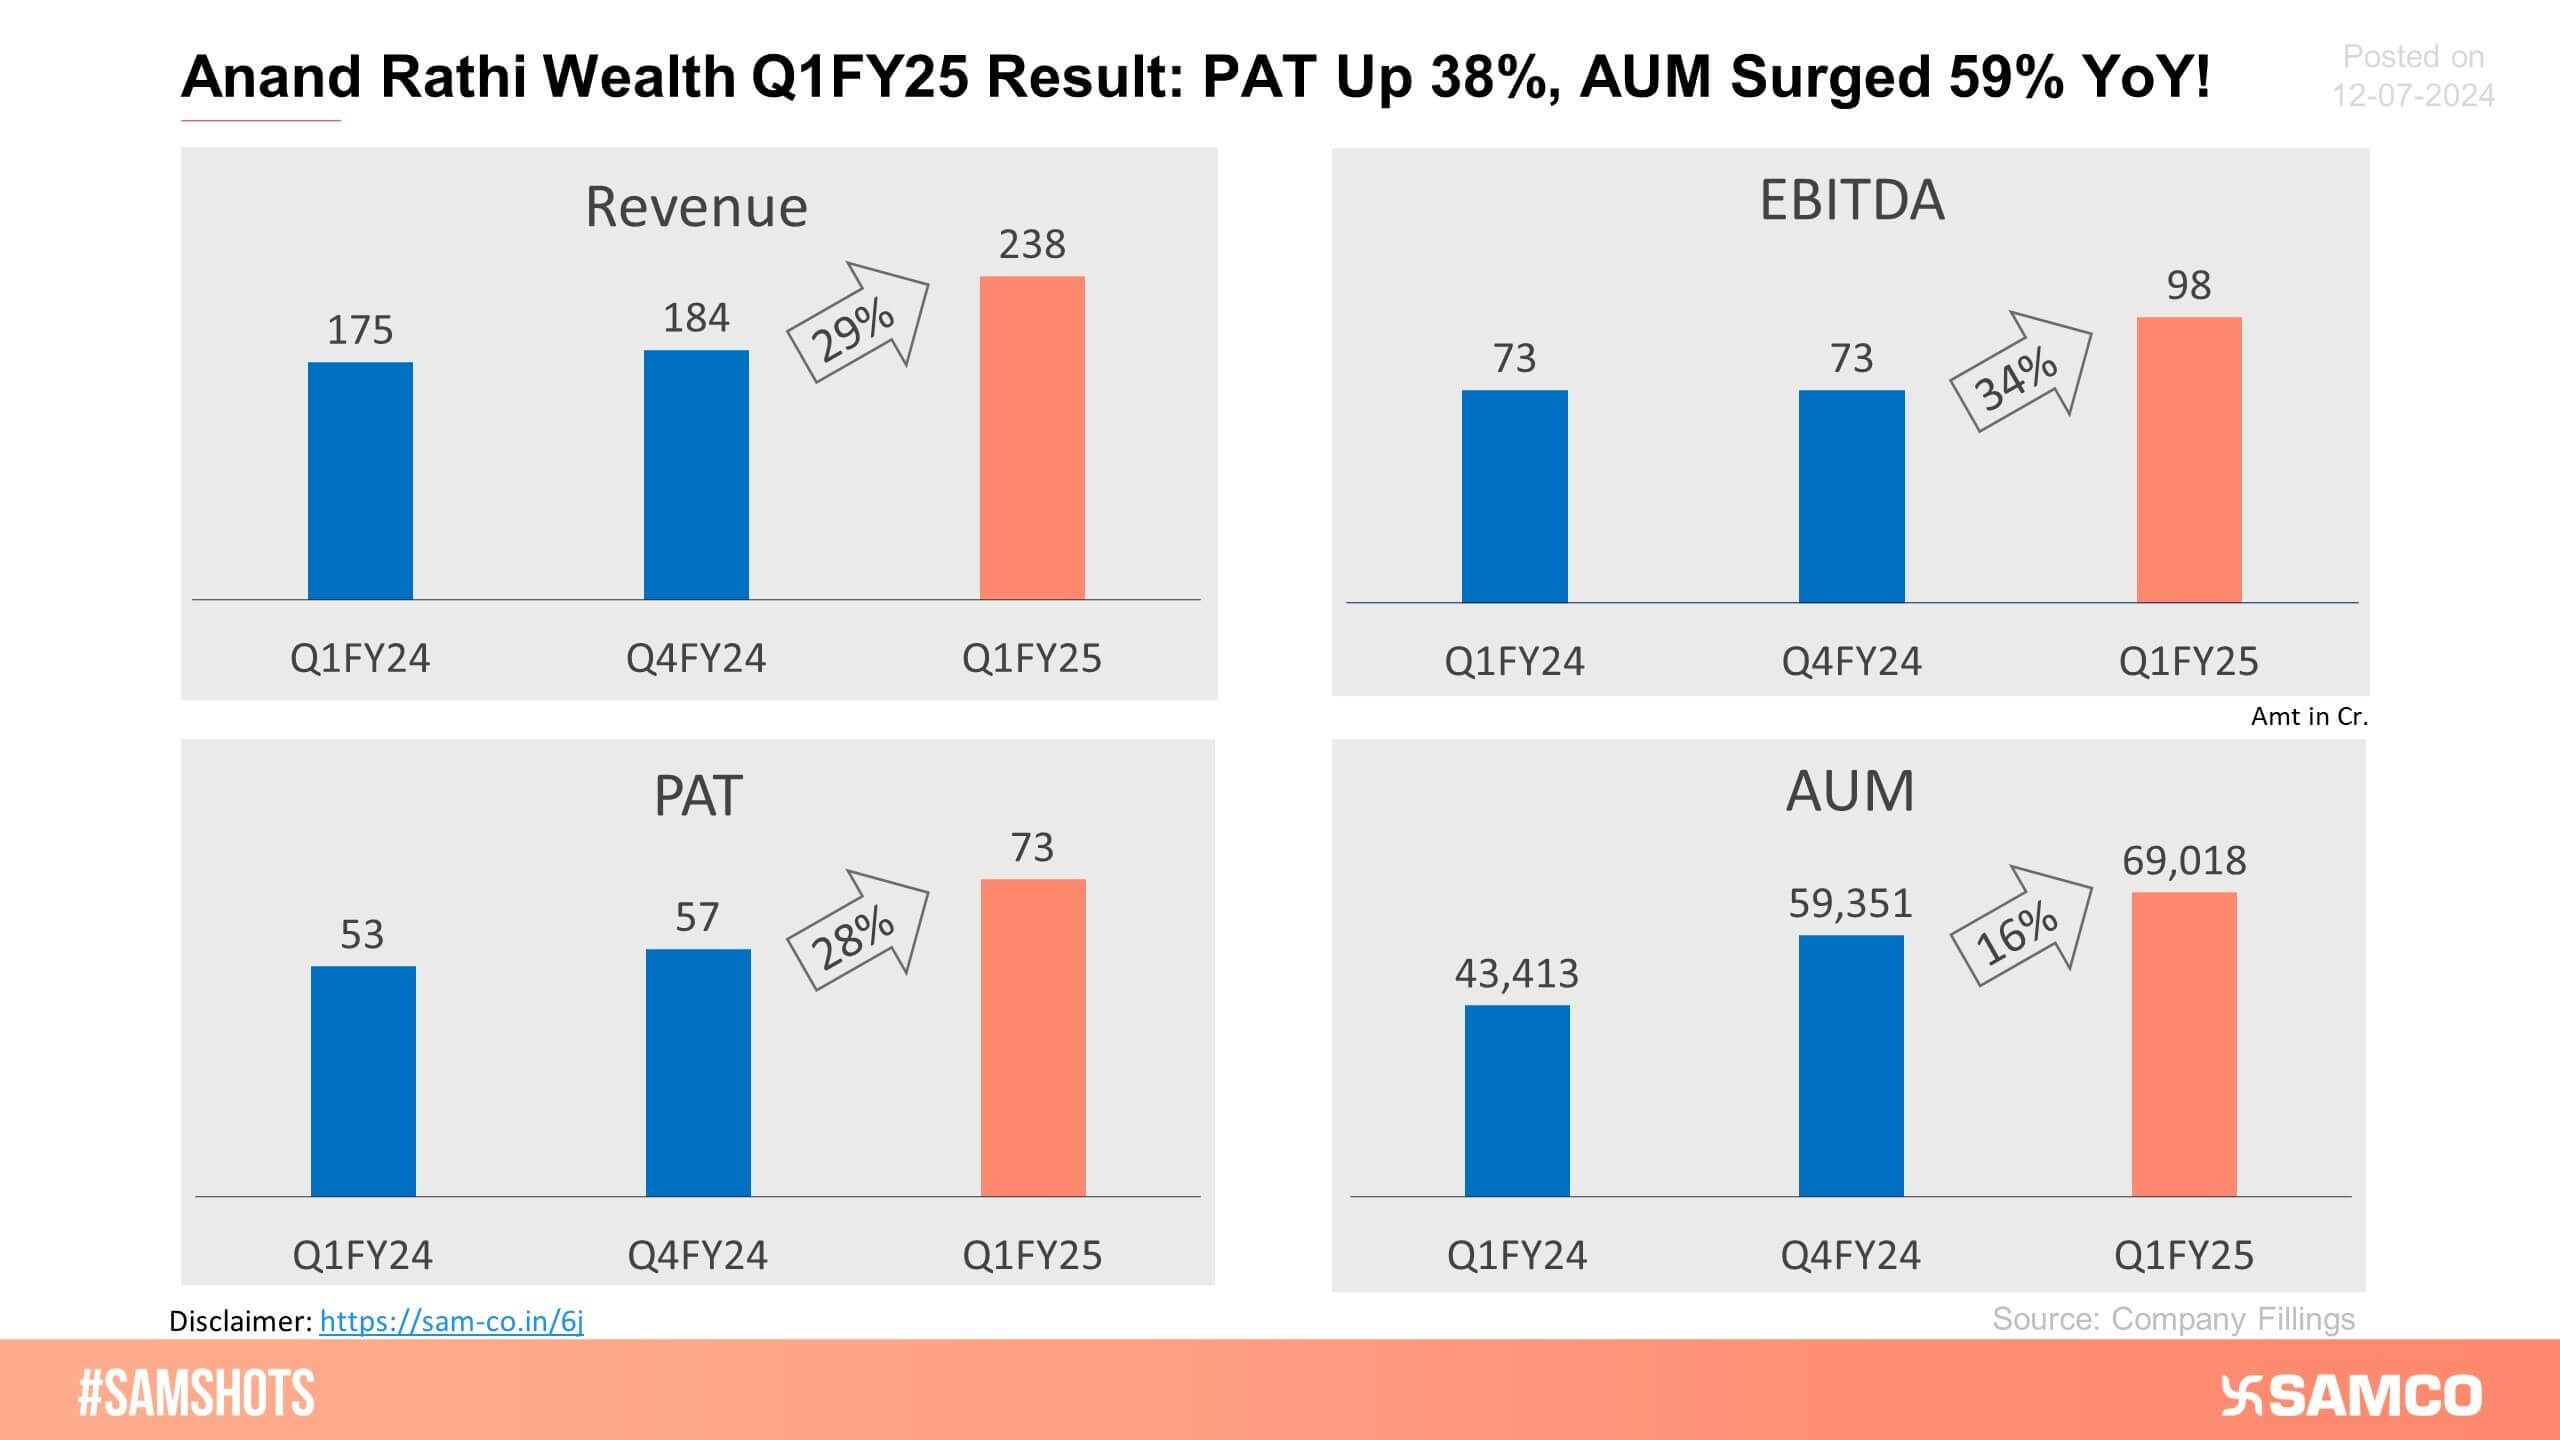
The chart below presents the Q1 FY25 performance of Anand Rathi Wealth Ltd.
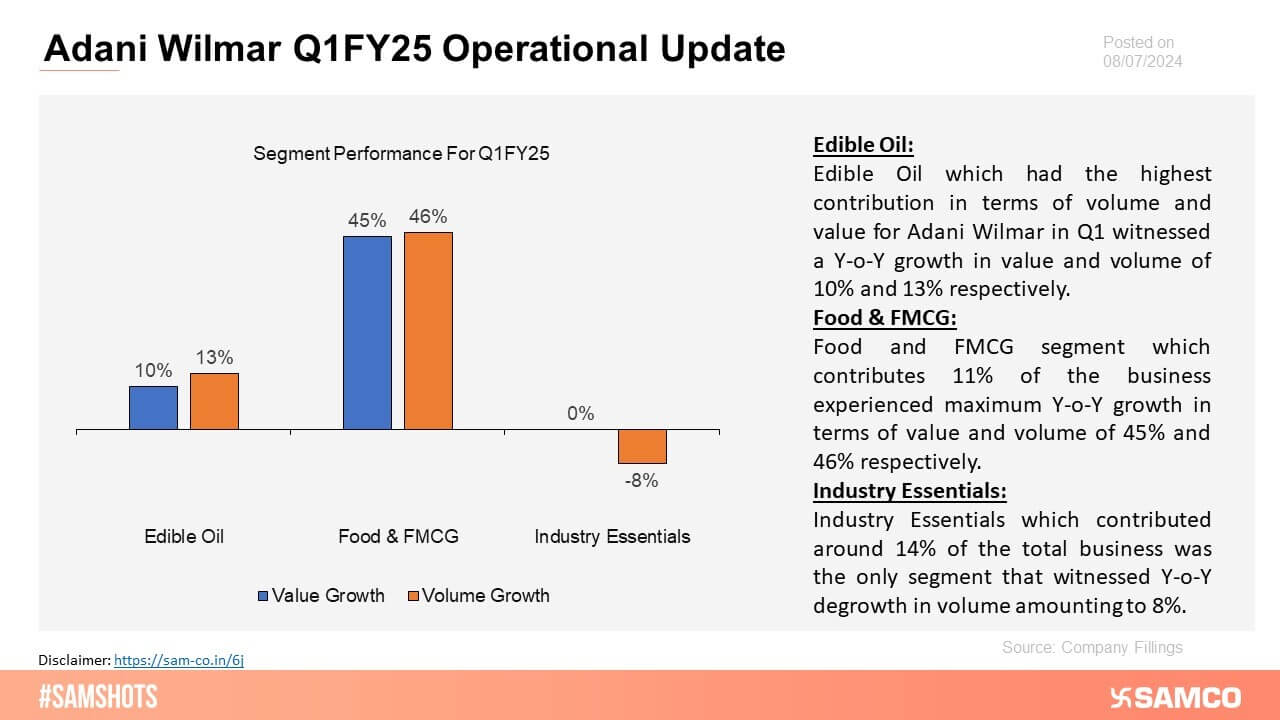
The chart displays the growth in both volume and value of Adani Wilmar’s segments in Q1FY25.
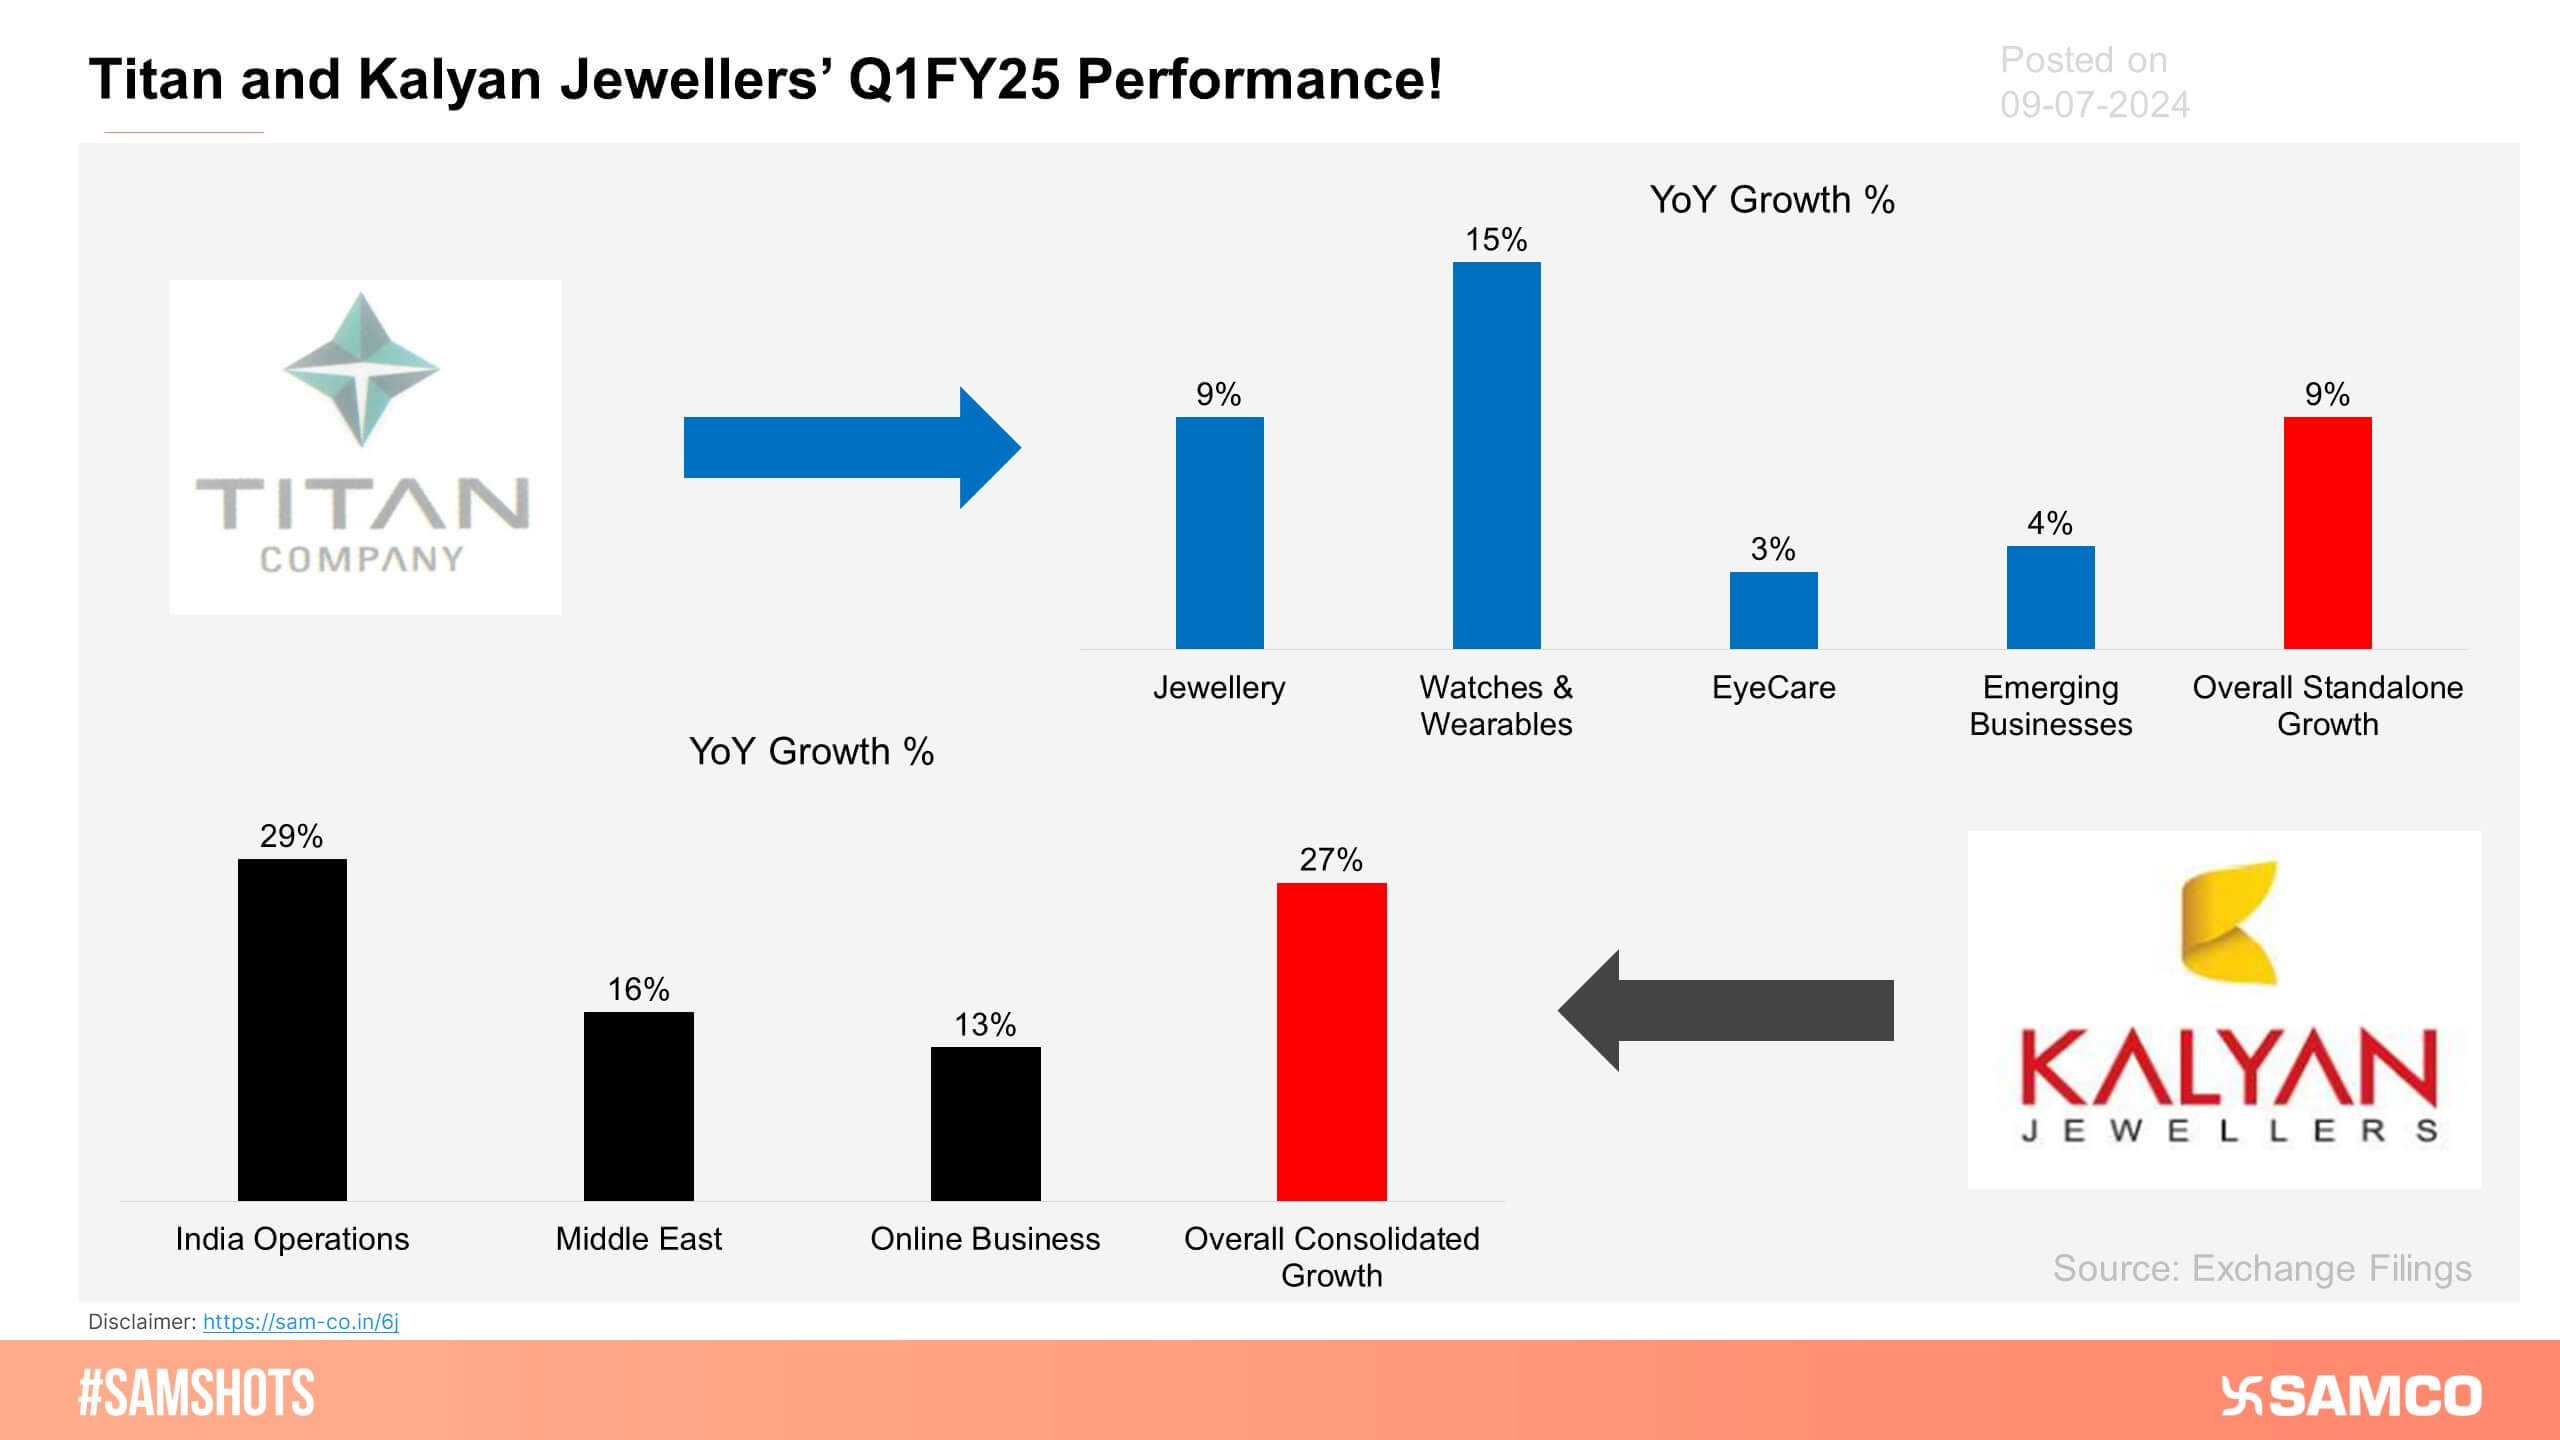
Kalyan Jewellers reported solid performance while Titan experienced muted overall sentiments in Q1FY25.
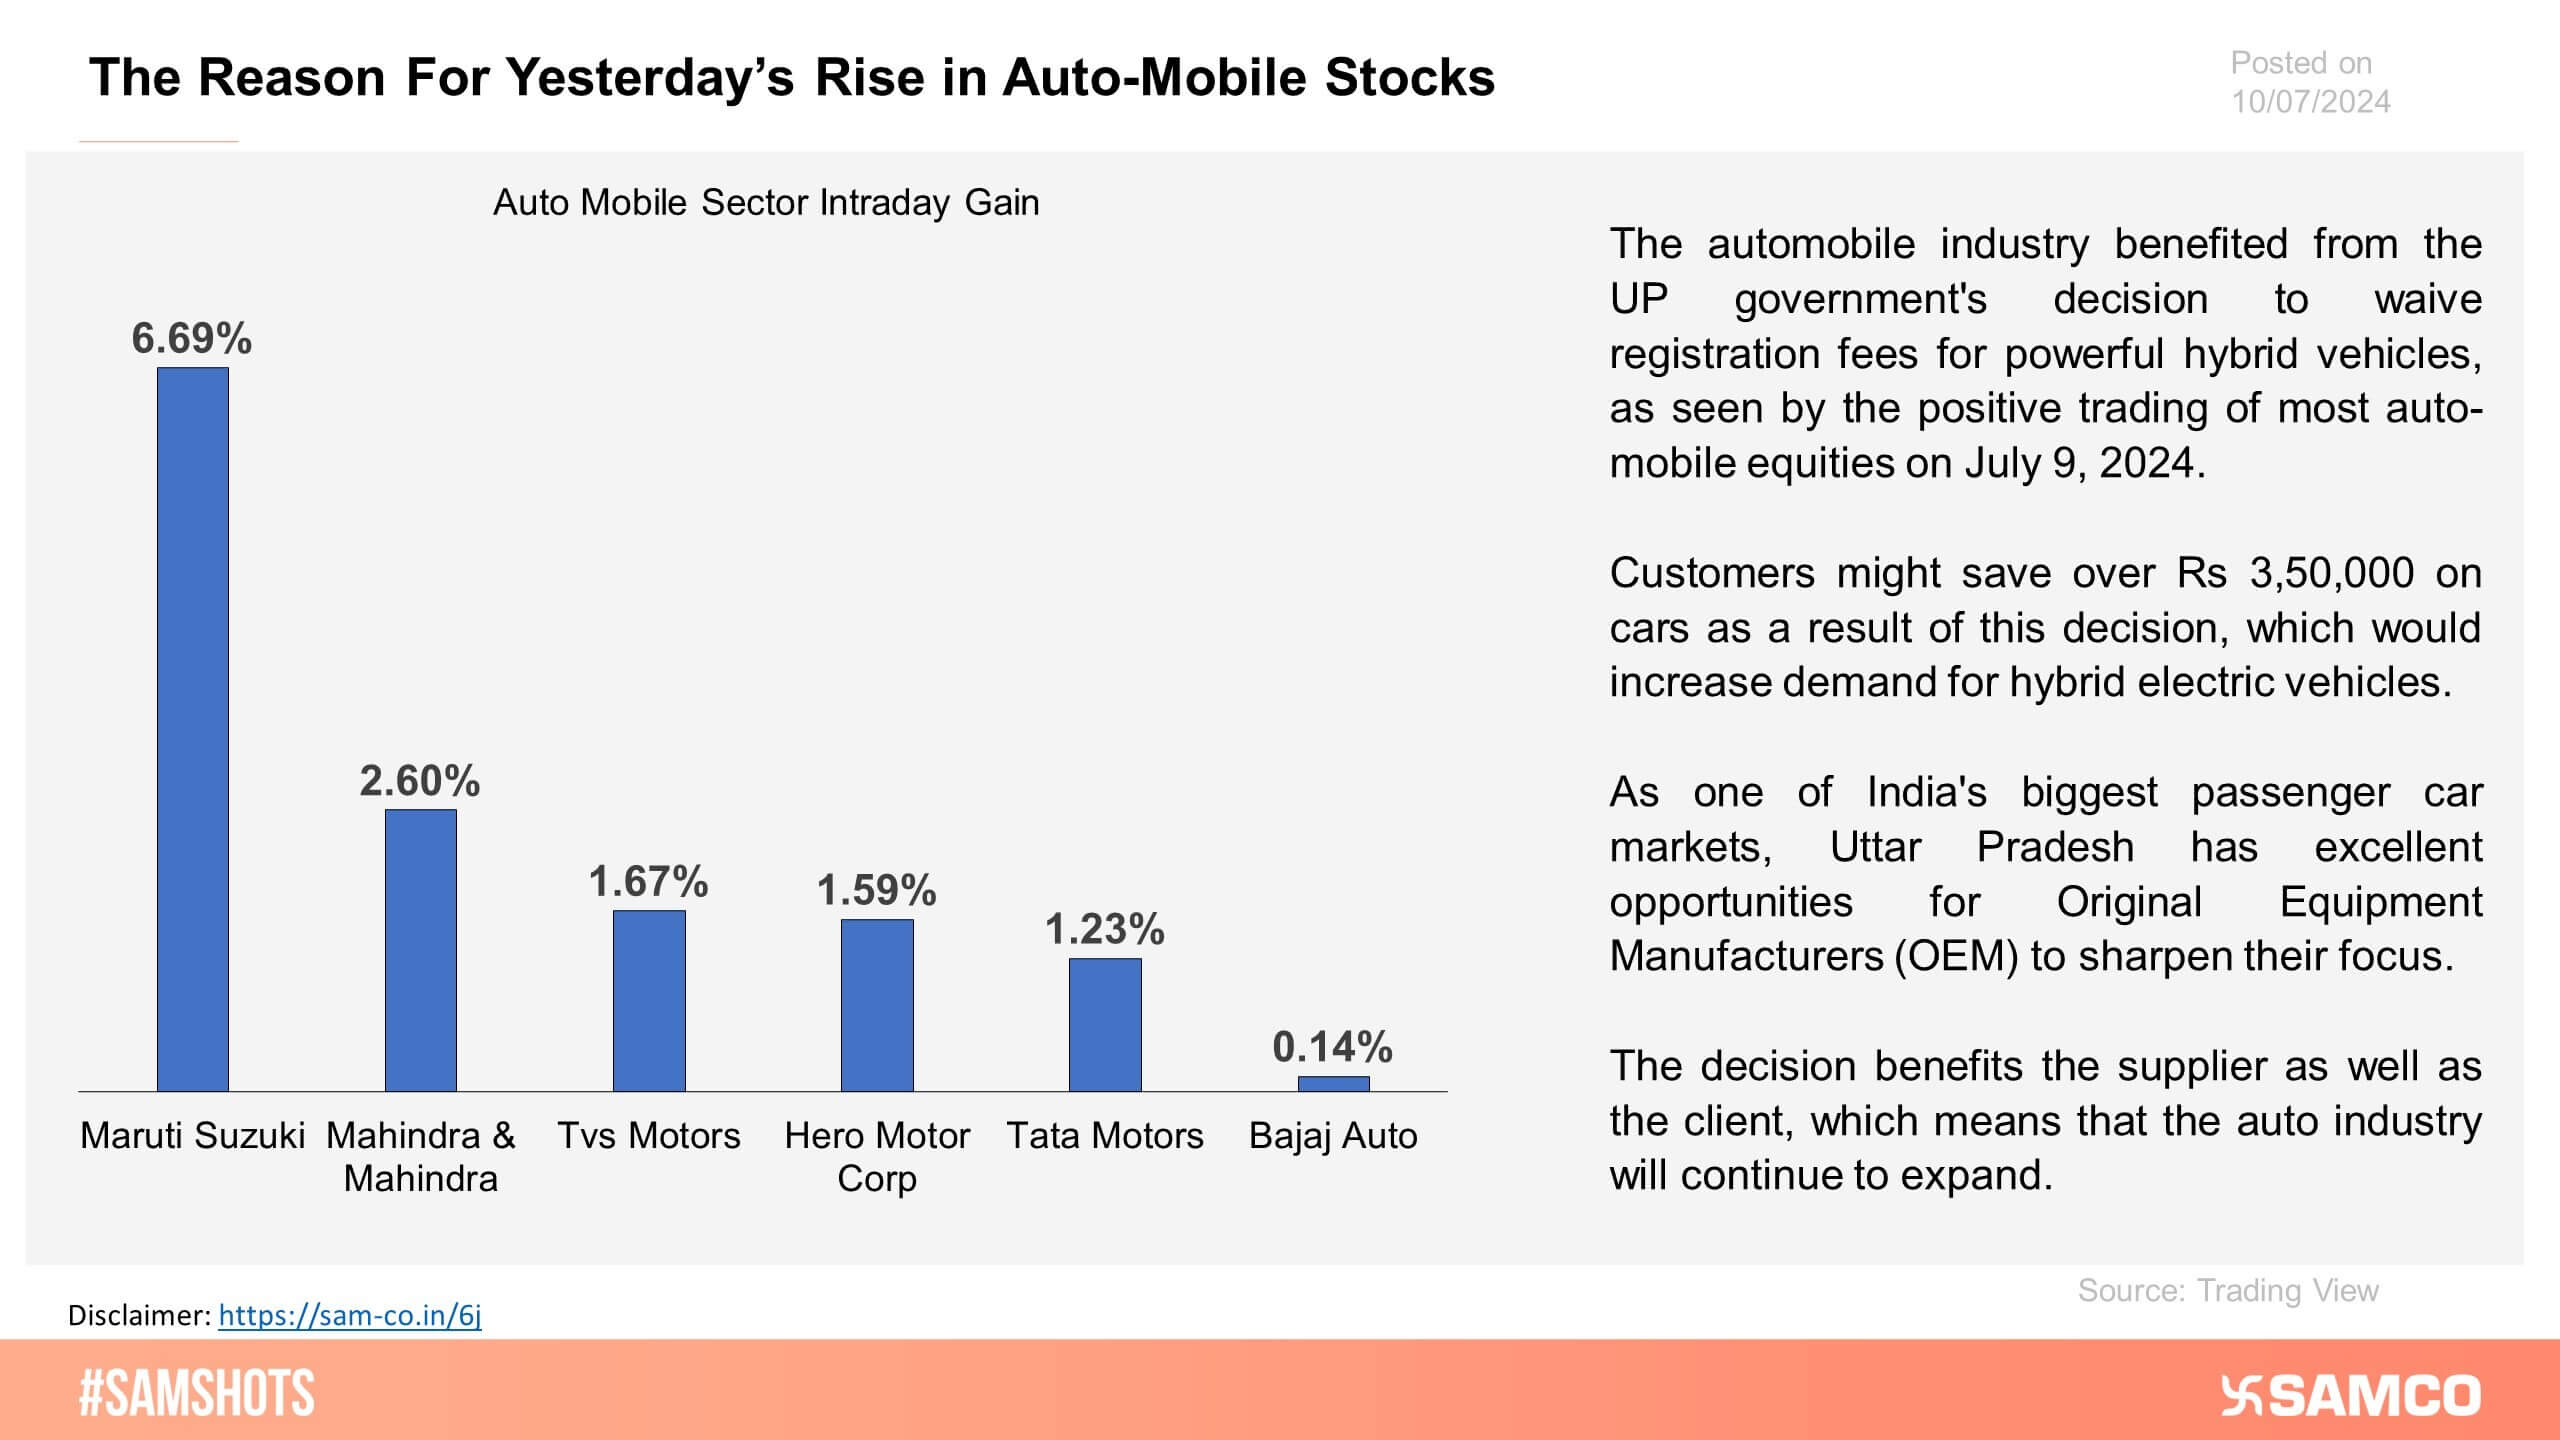
The chart displays the impact of the Uttar Pradesh government’s decision on automobile stocks.
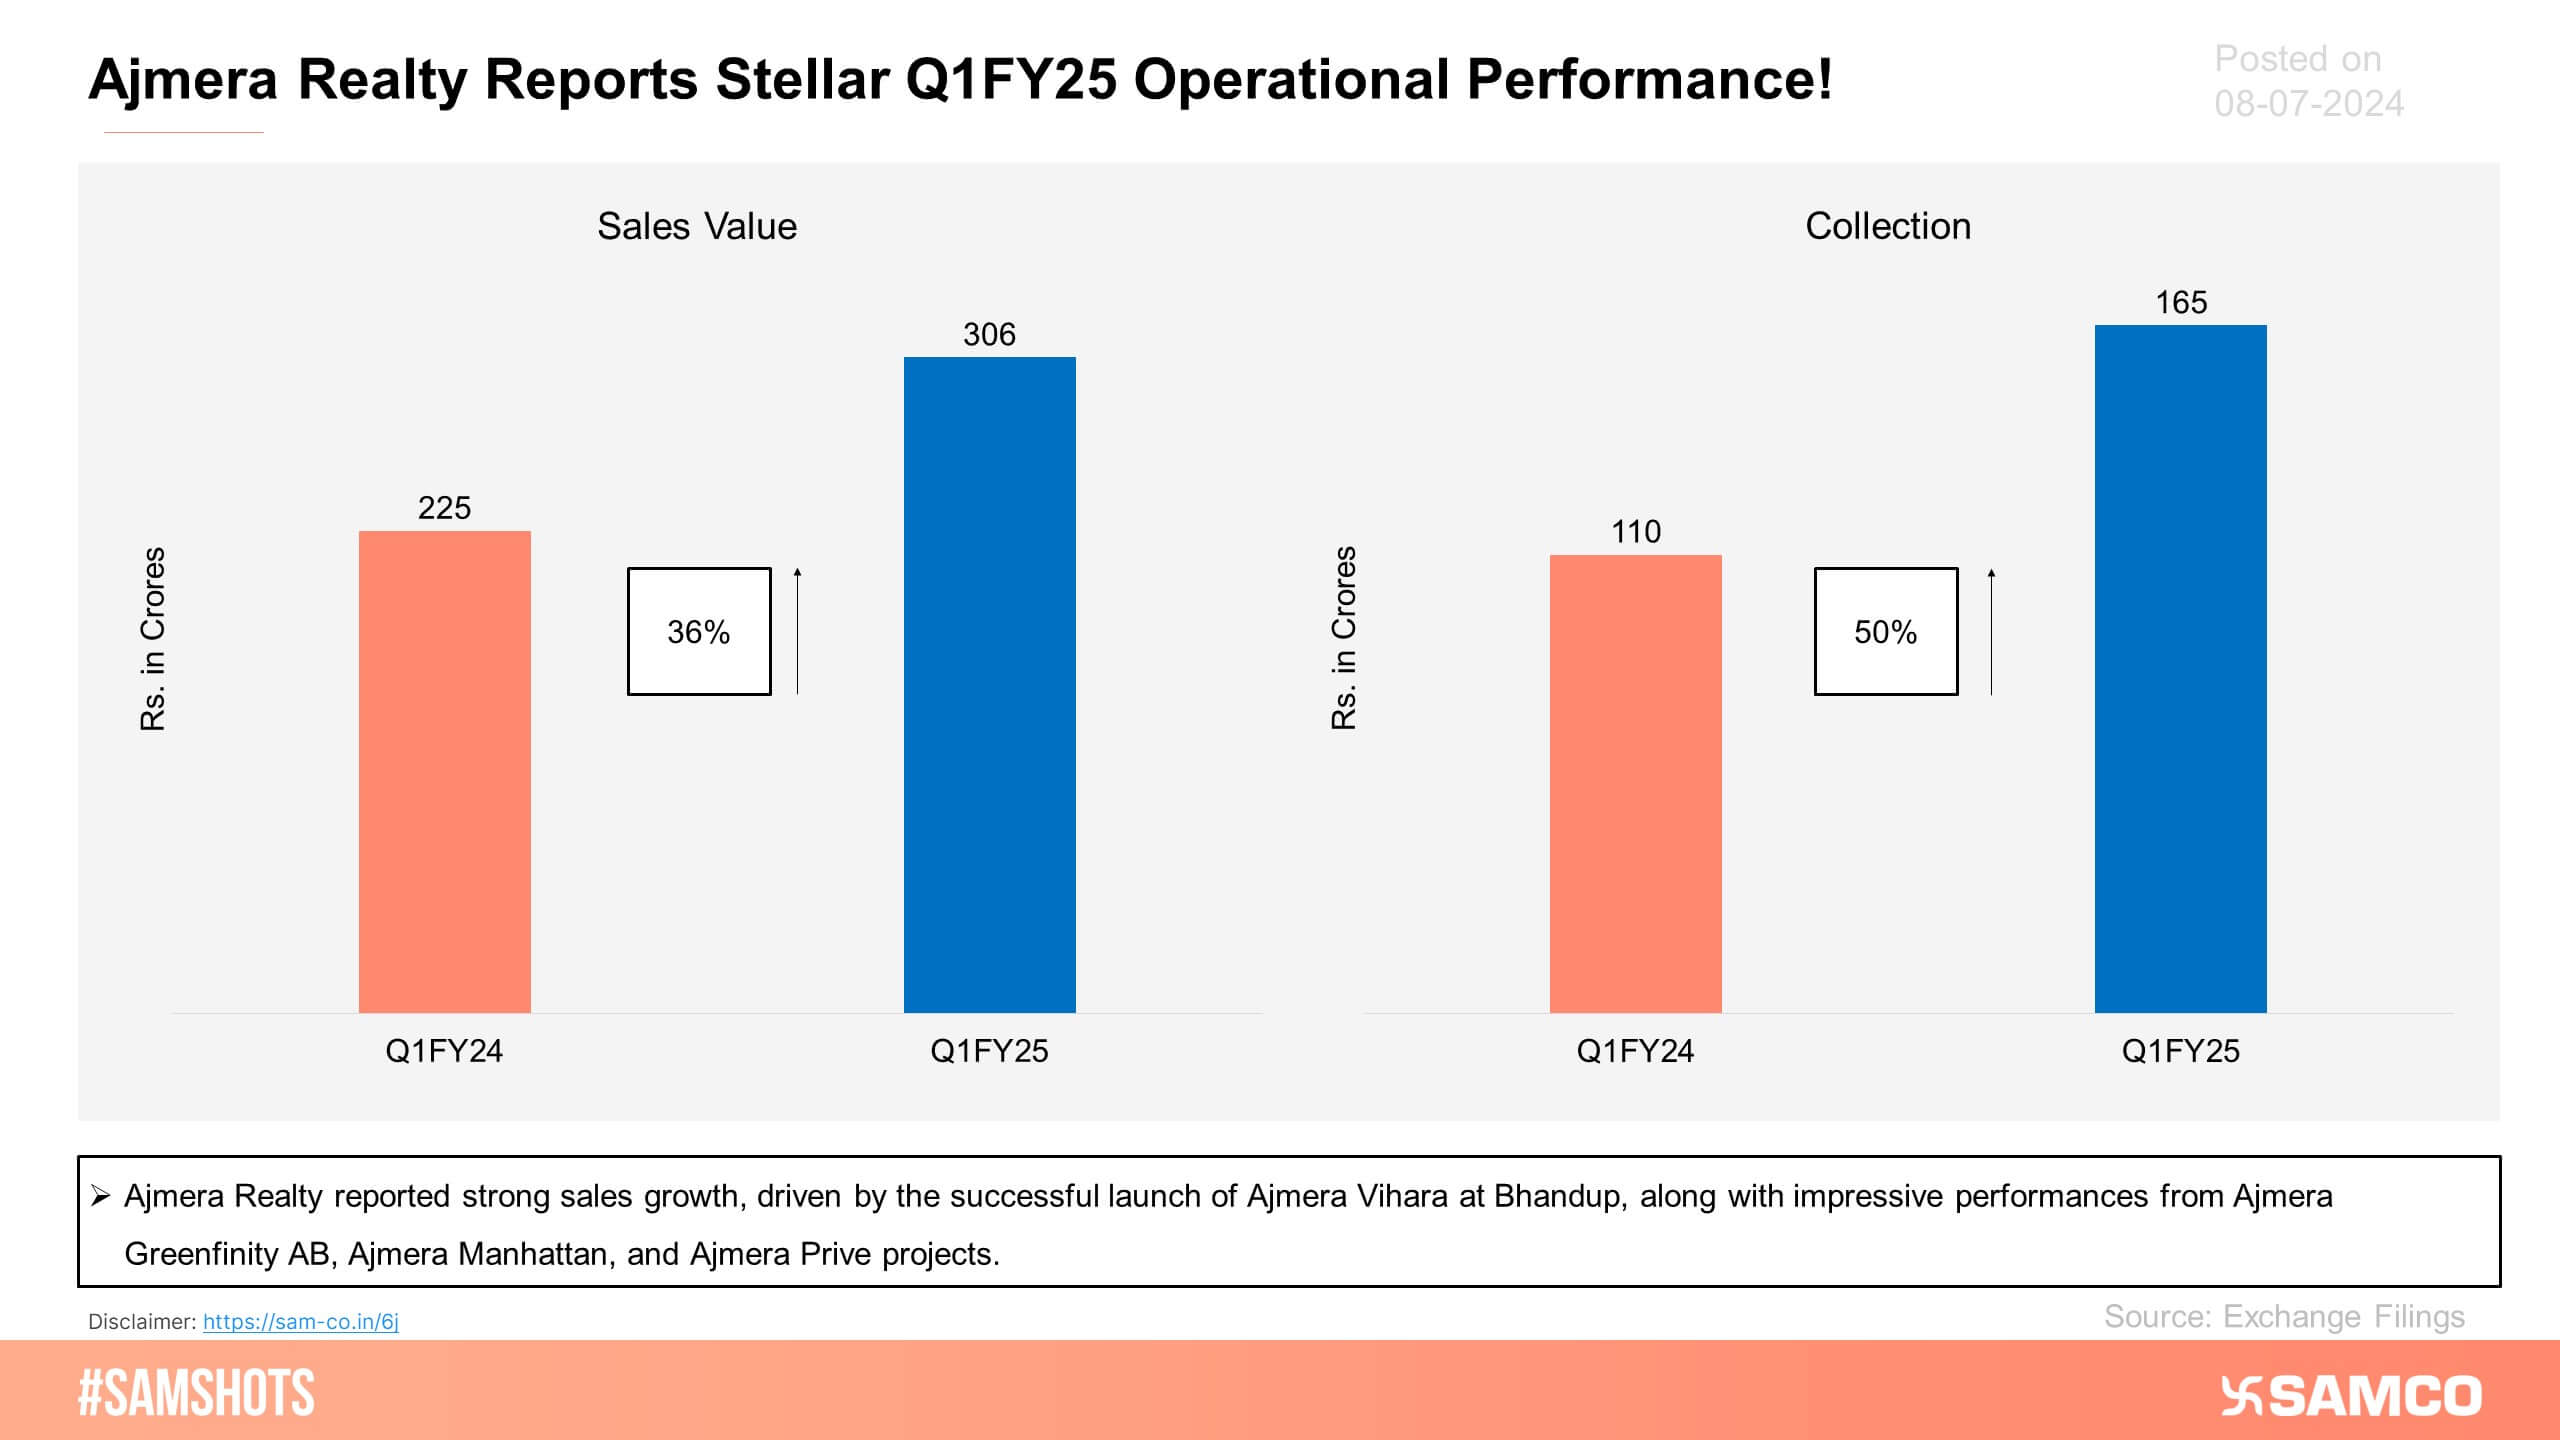
The above chart displays the Q1FY25 operational performance of Ajmera Realty Limited.
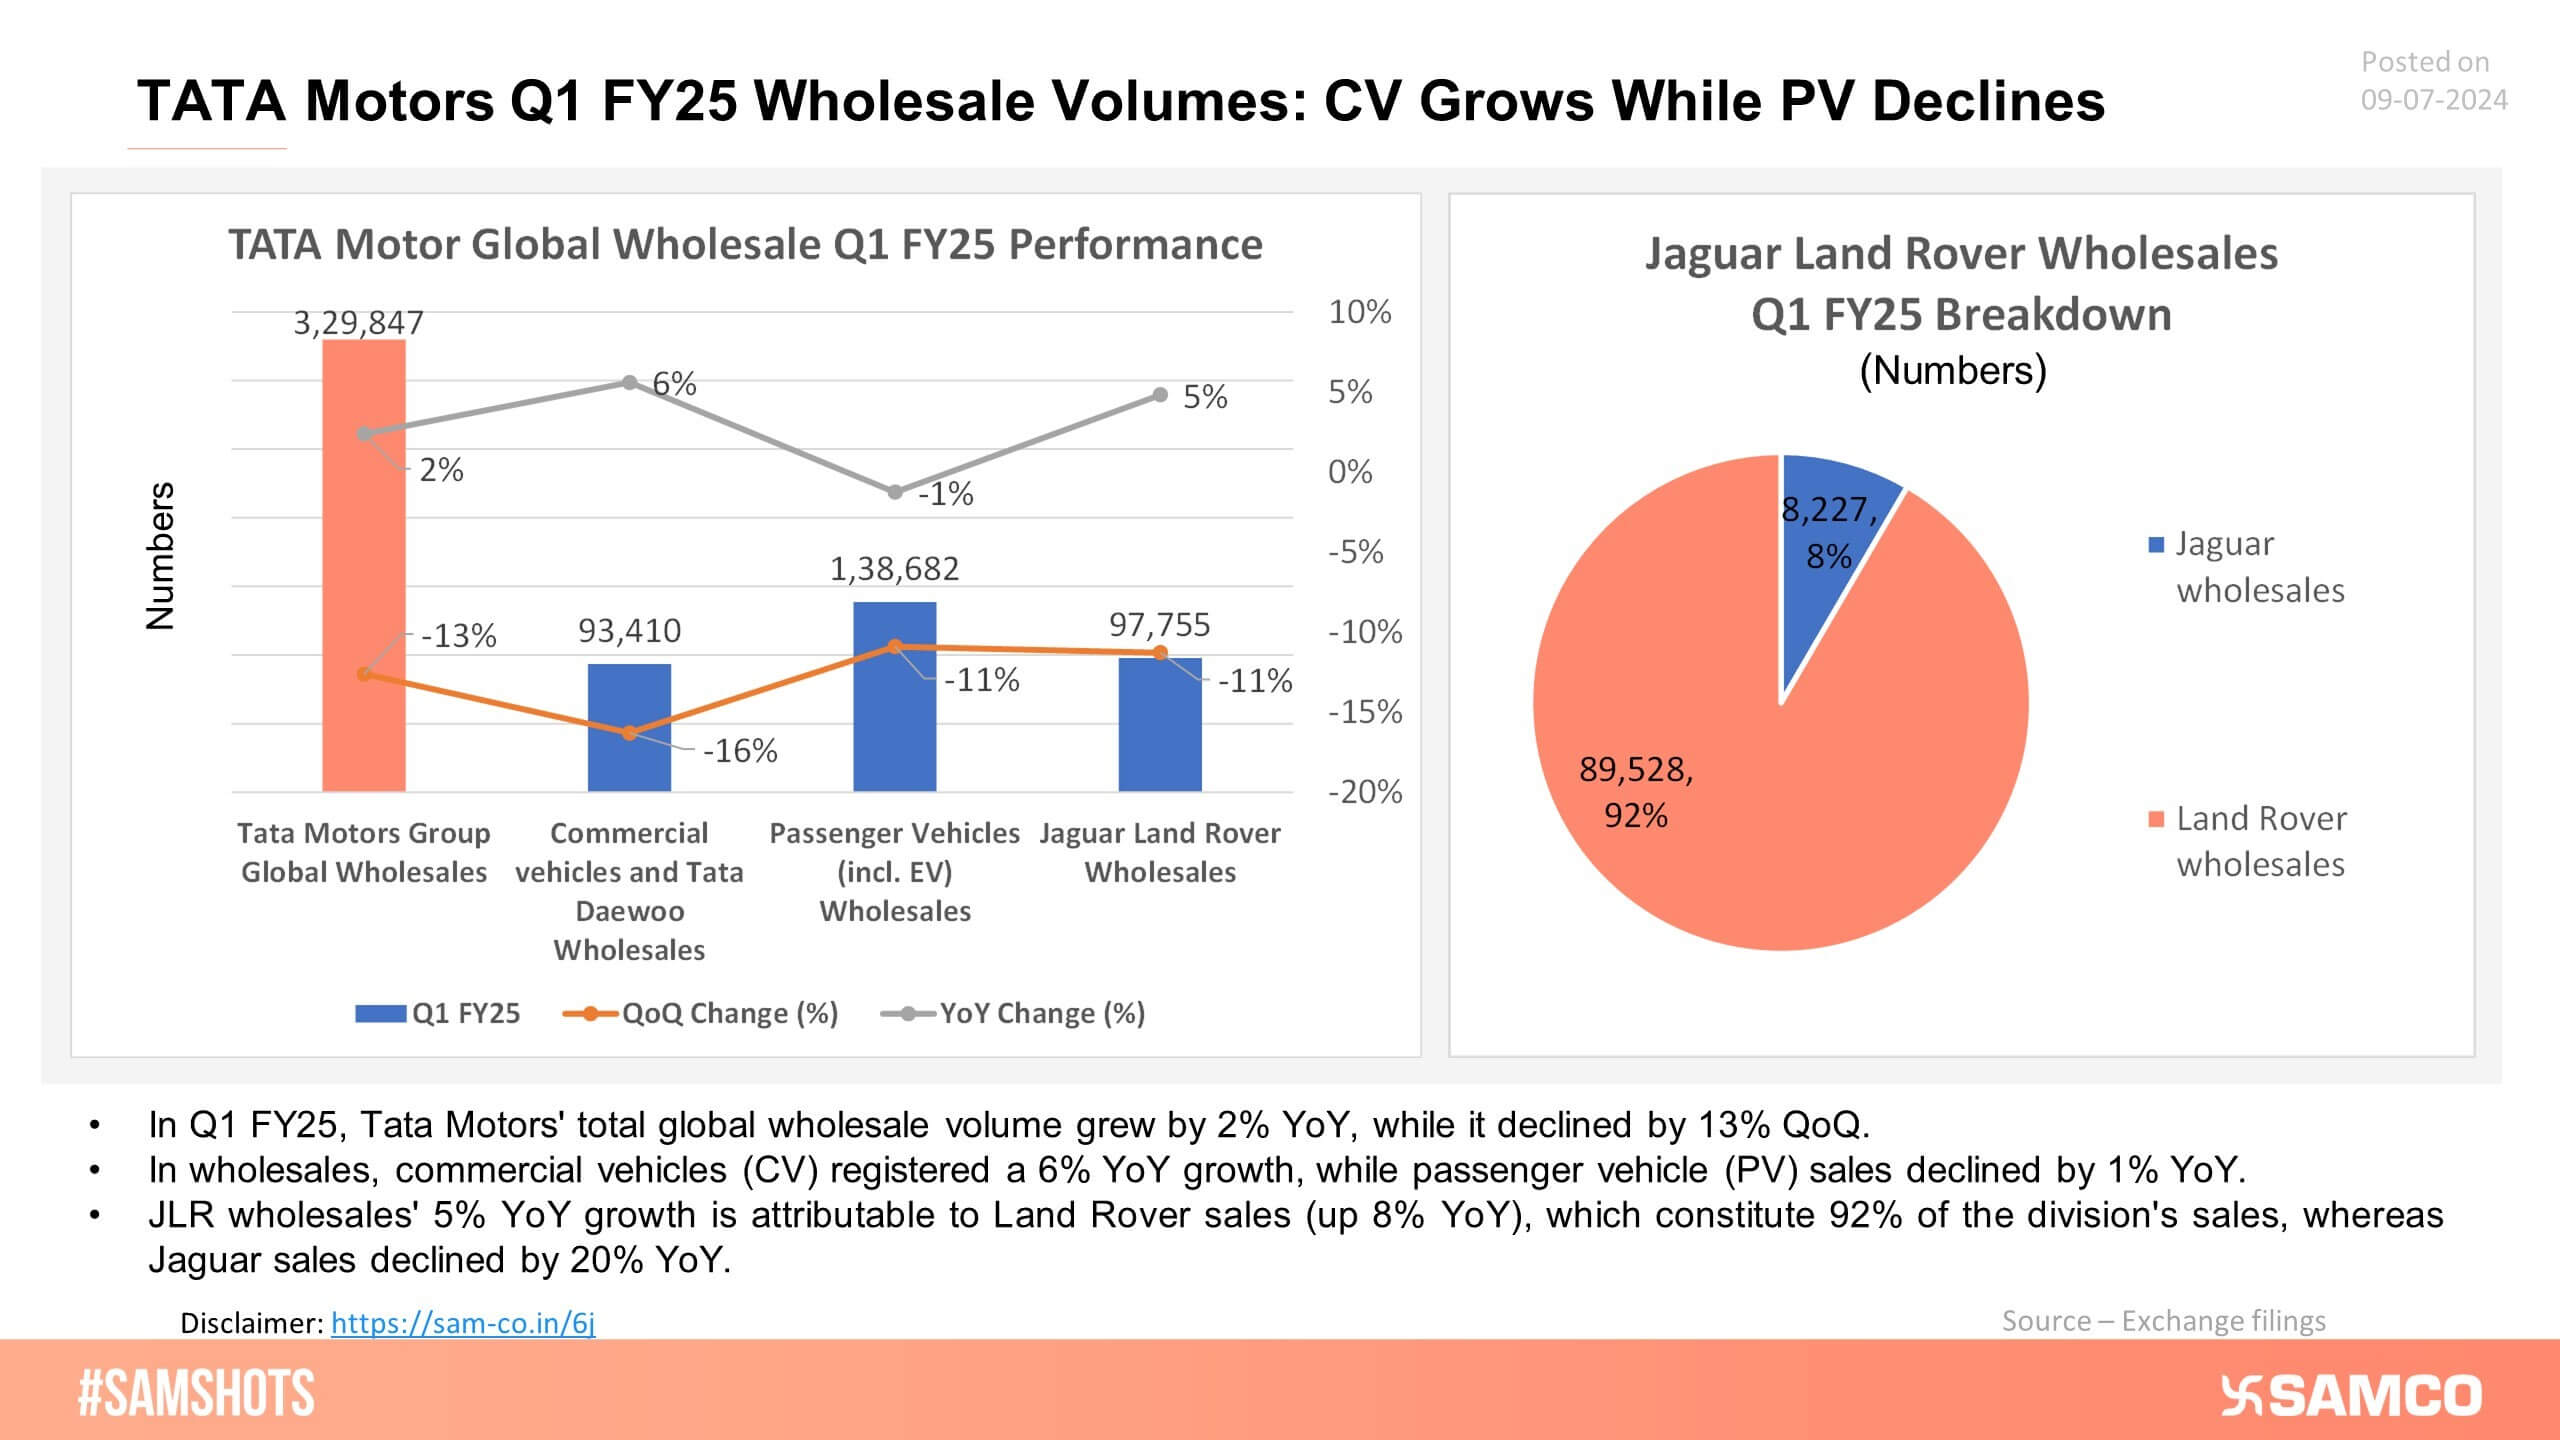
The performance of Tata Motors’ wholesale segment in Q1 FY25 is presented below.
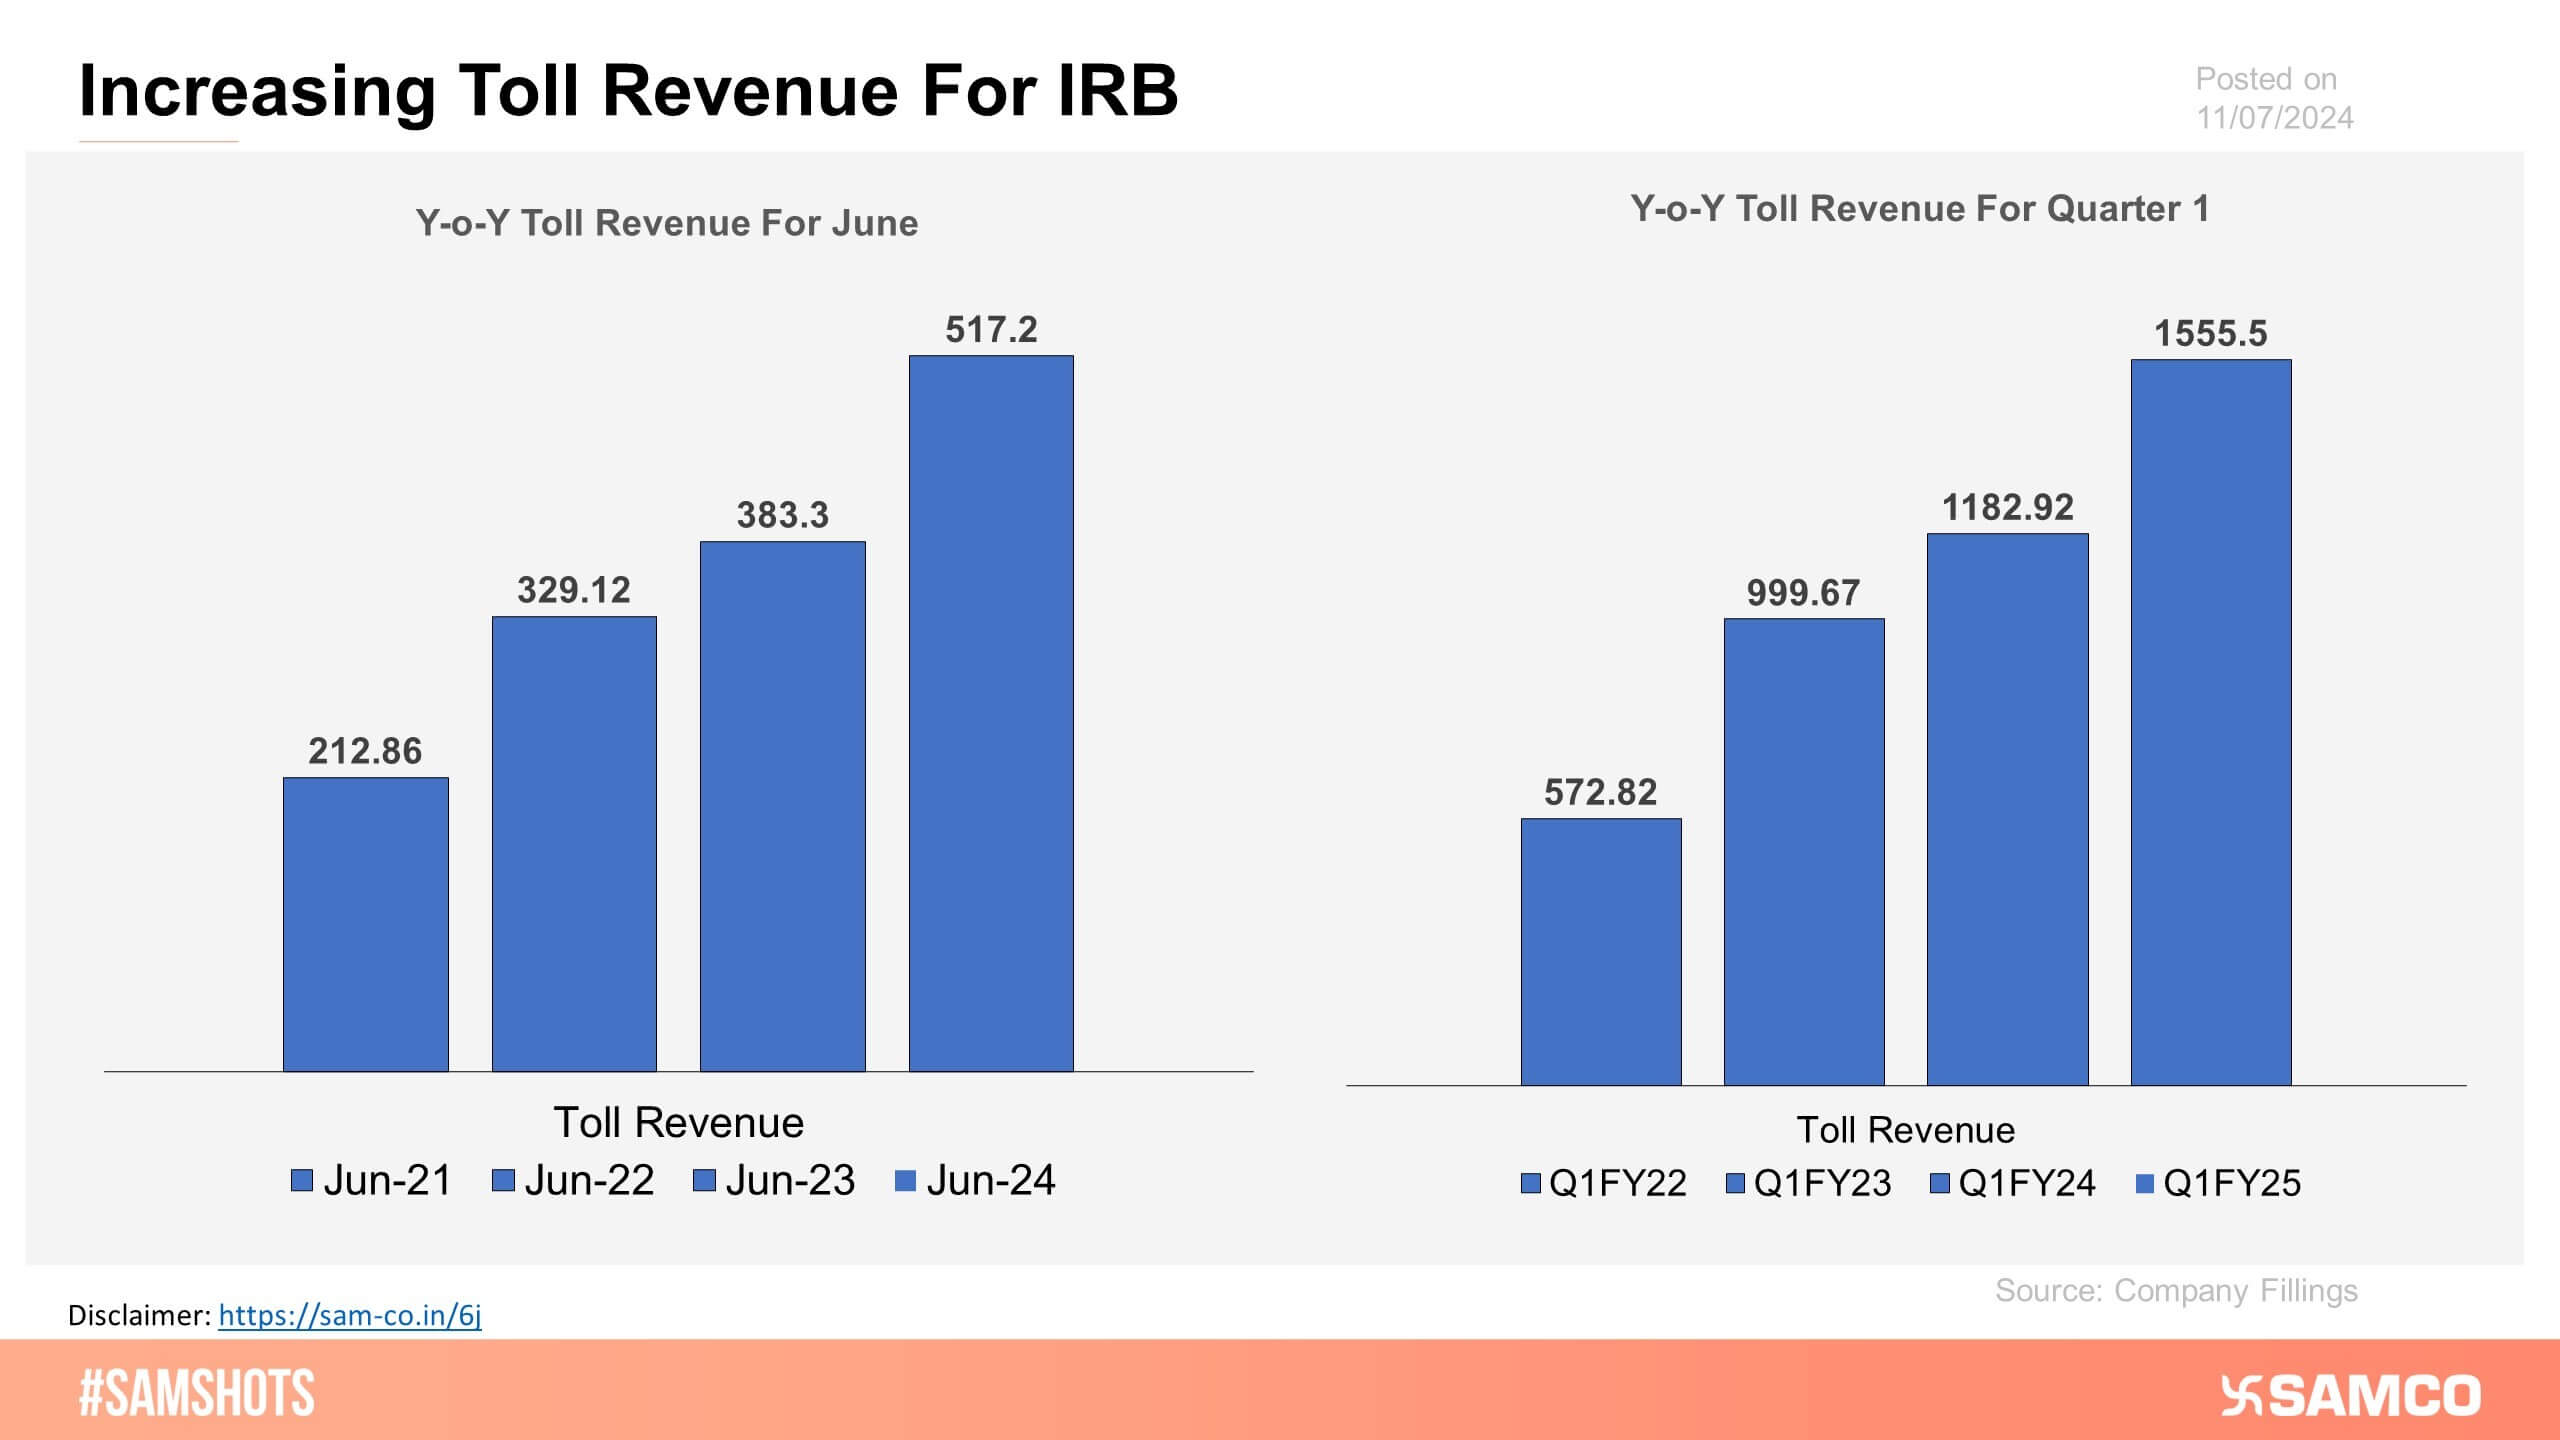
The graph depicts the incremental growth in toll collection for IRB.
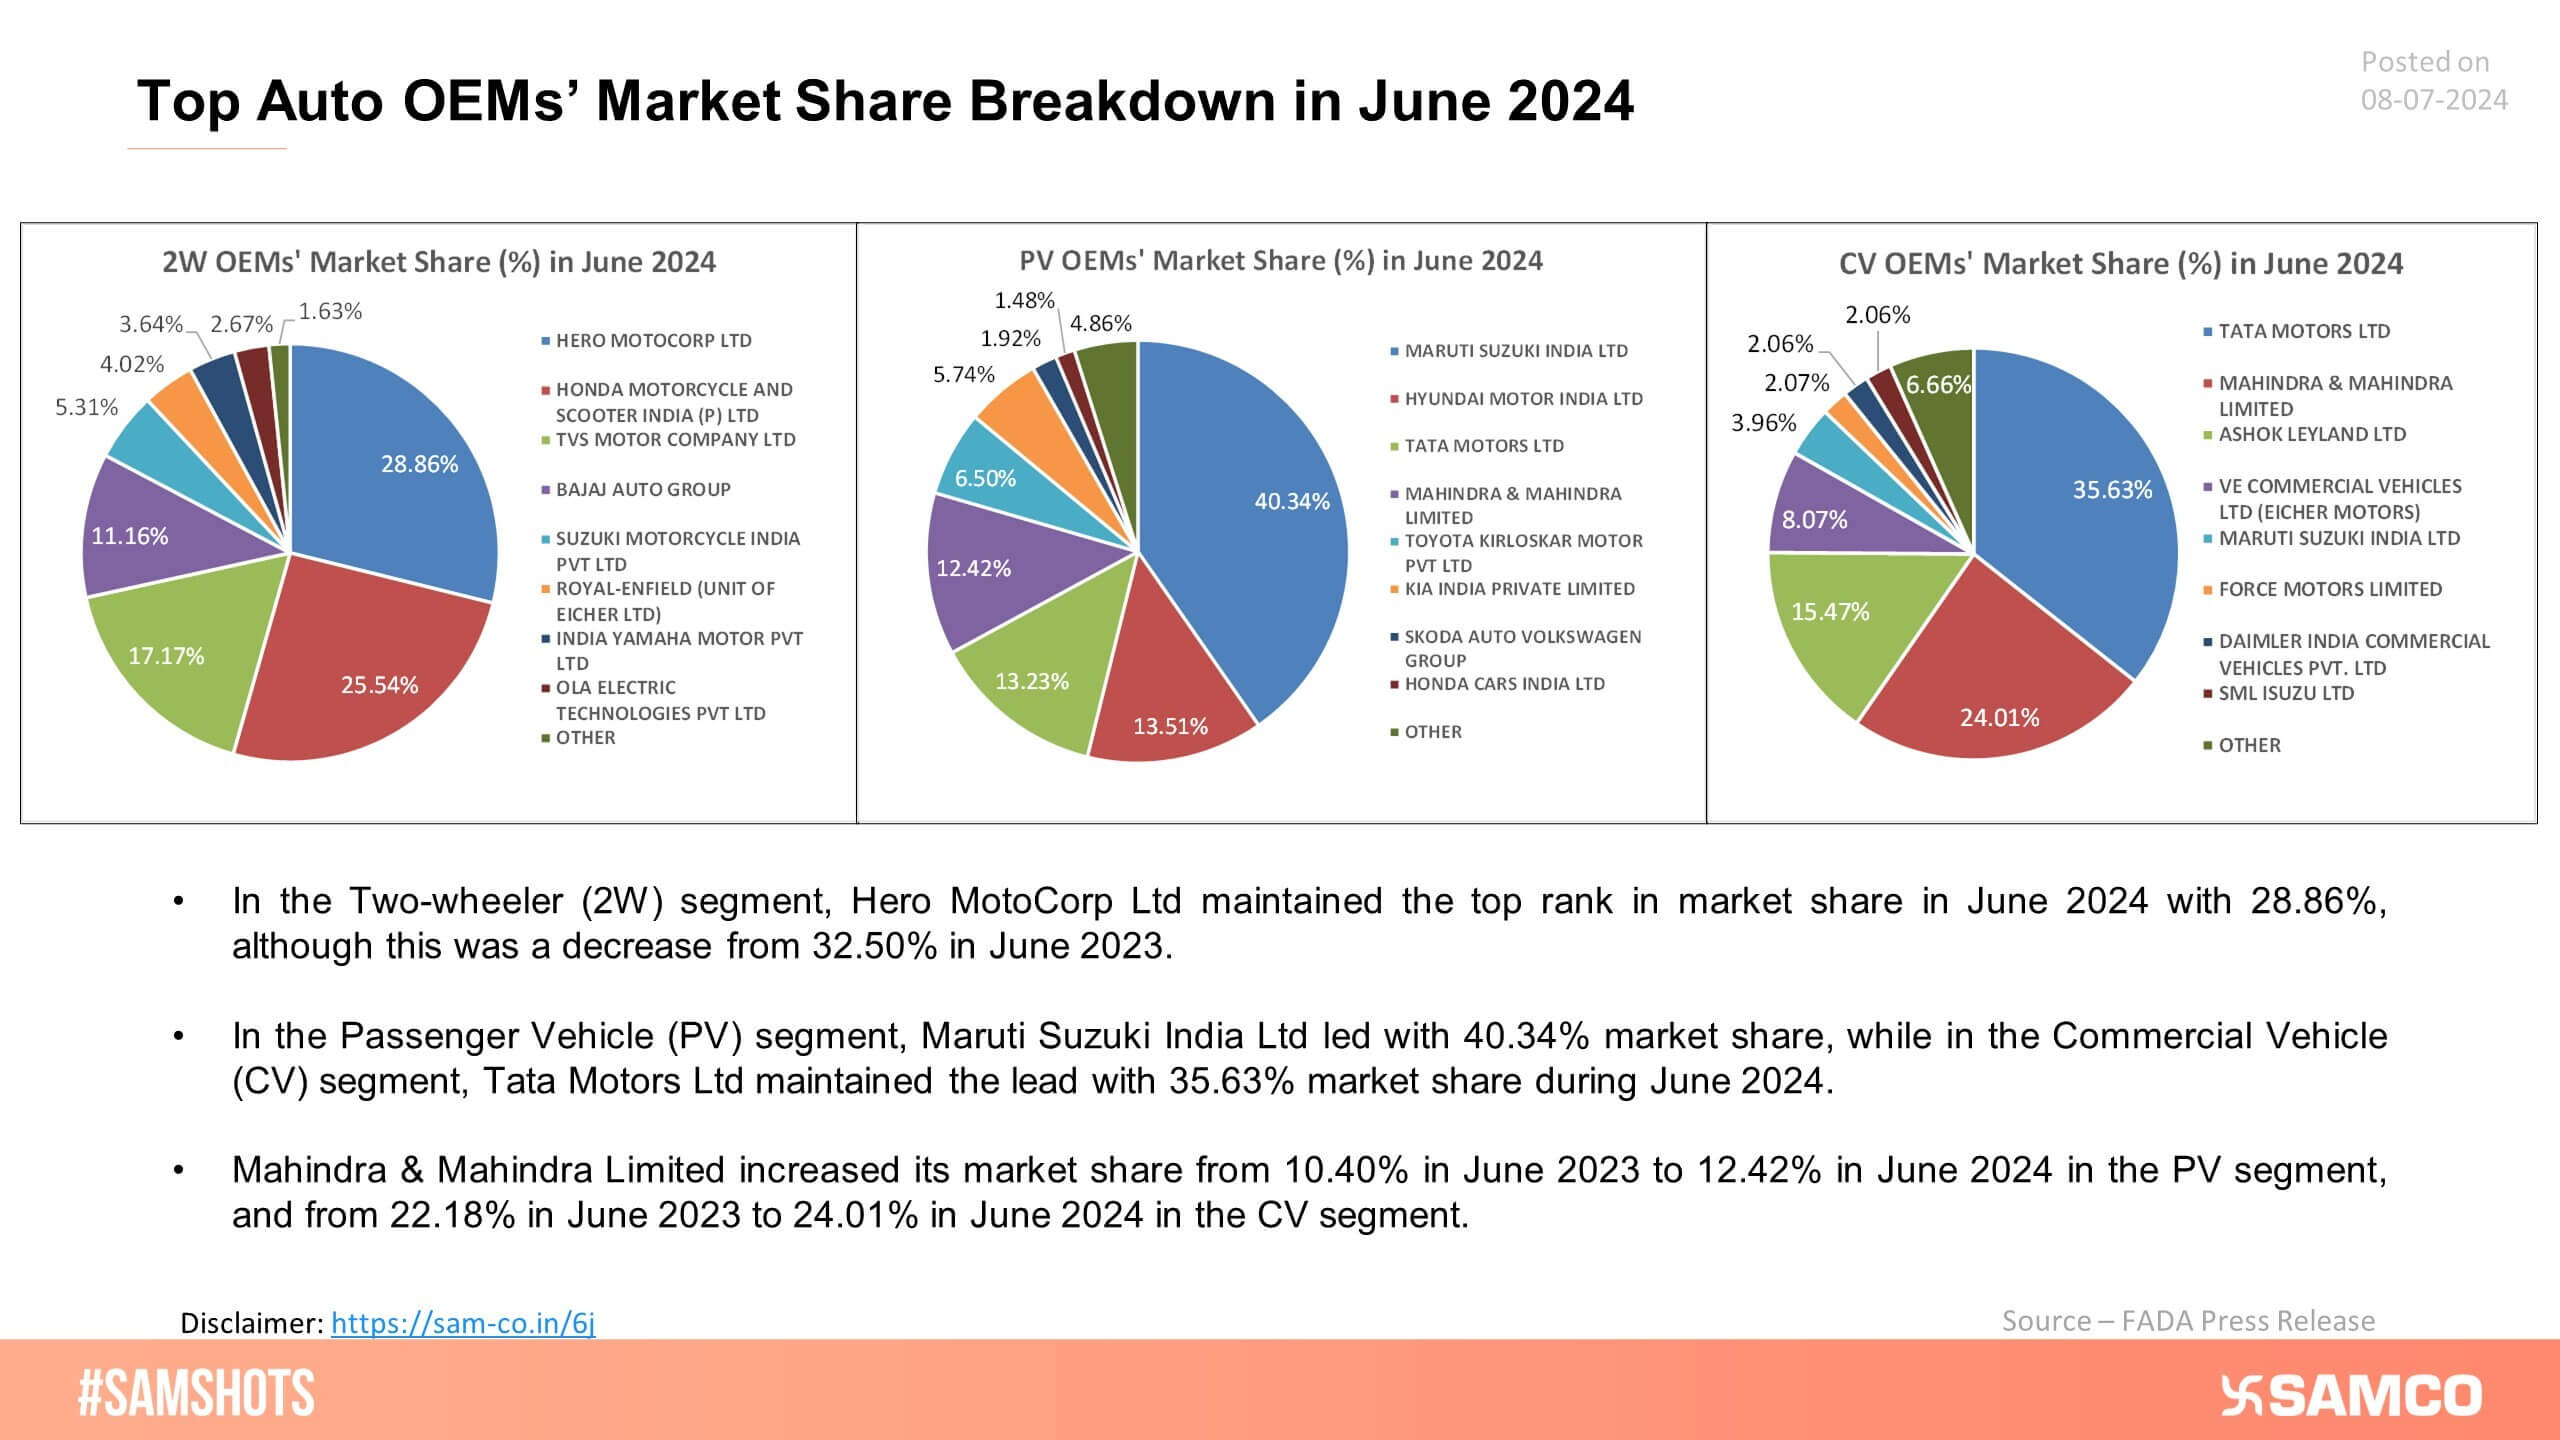
The market shares of 2-wheeler, passenger vehicle (PV), and commercial vehicle (CV) OEMs in June 2024 are presented below
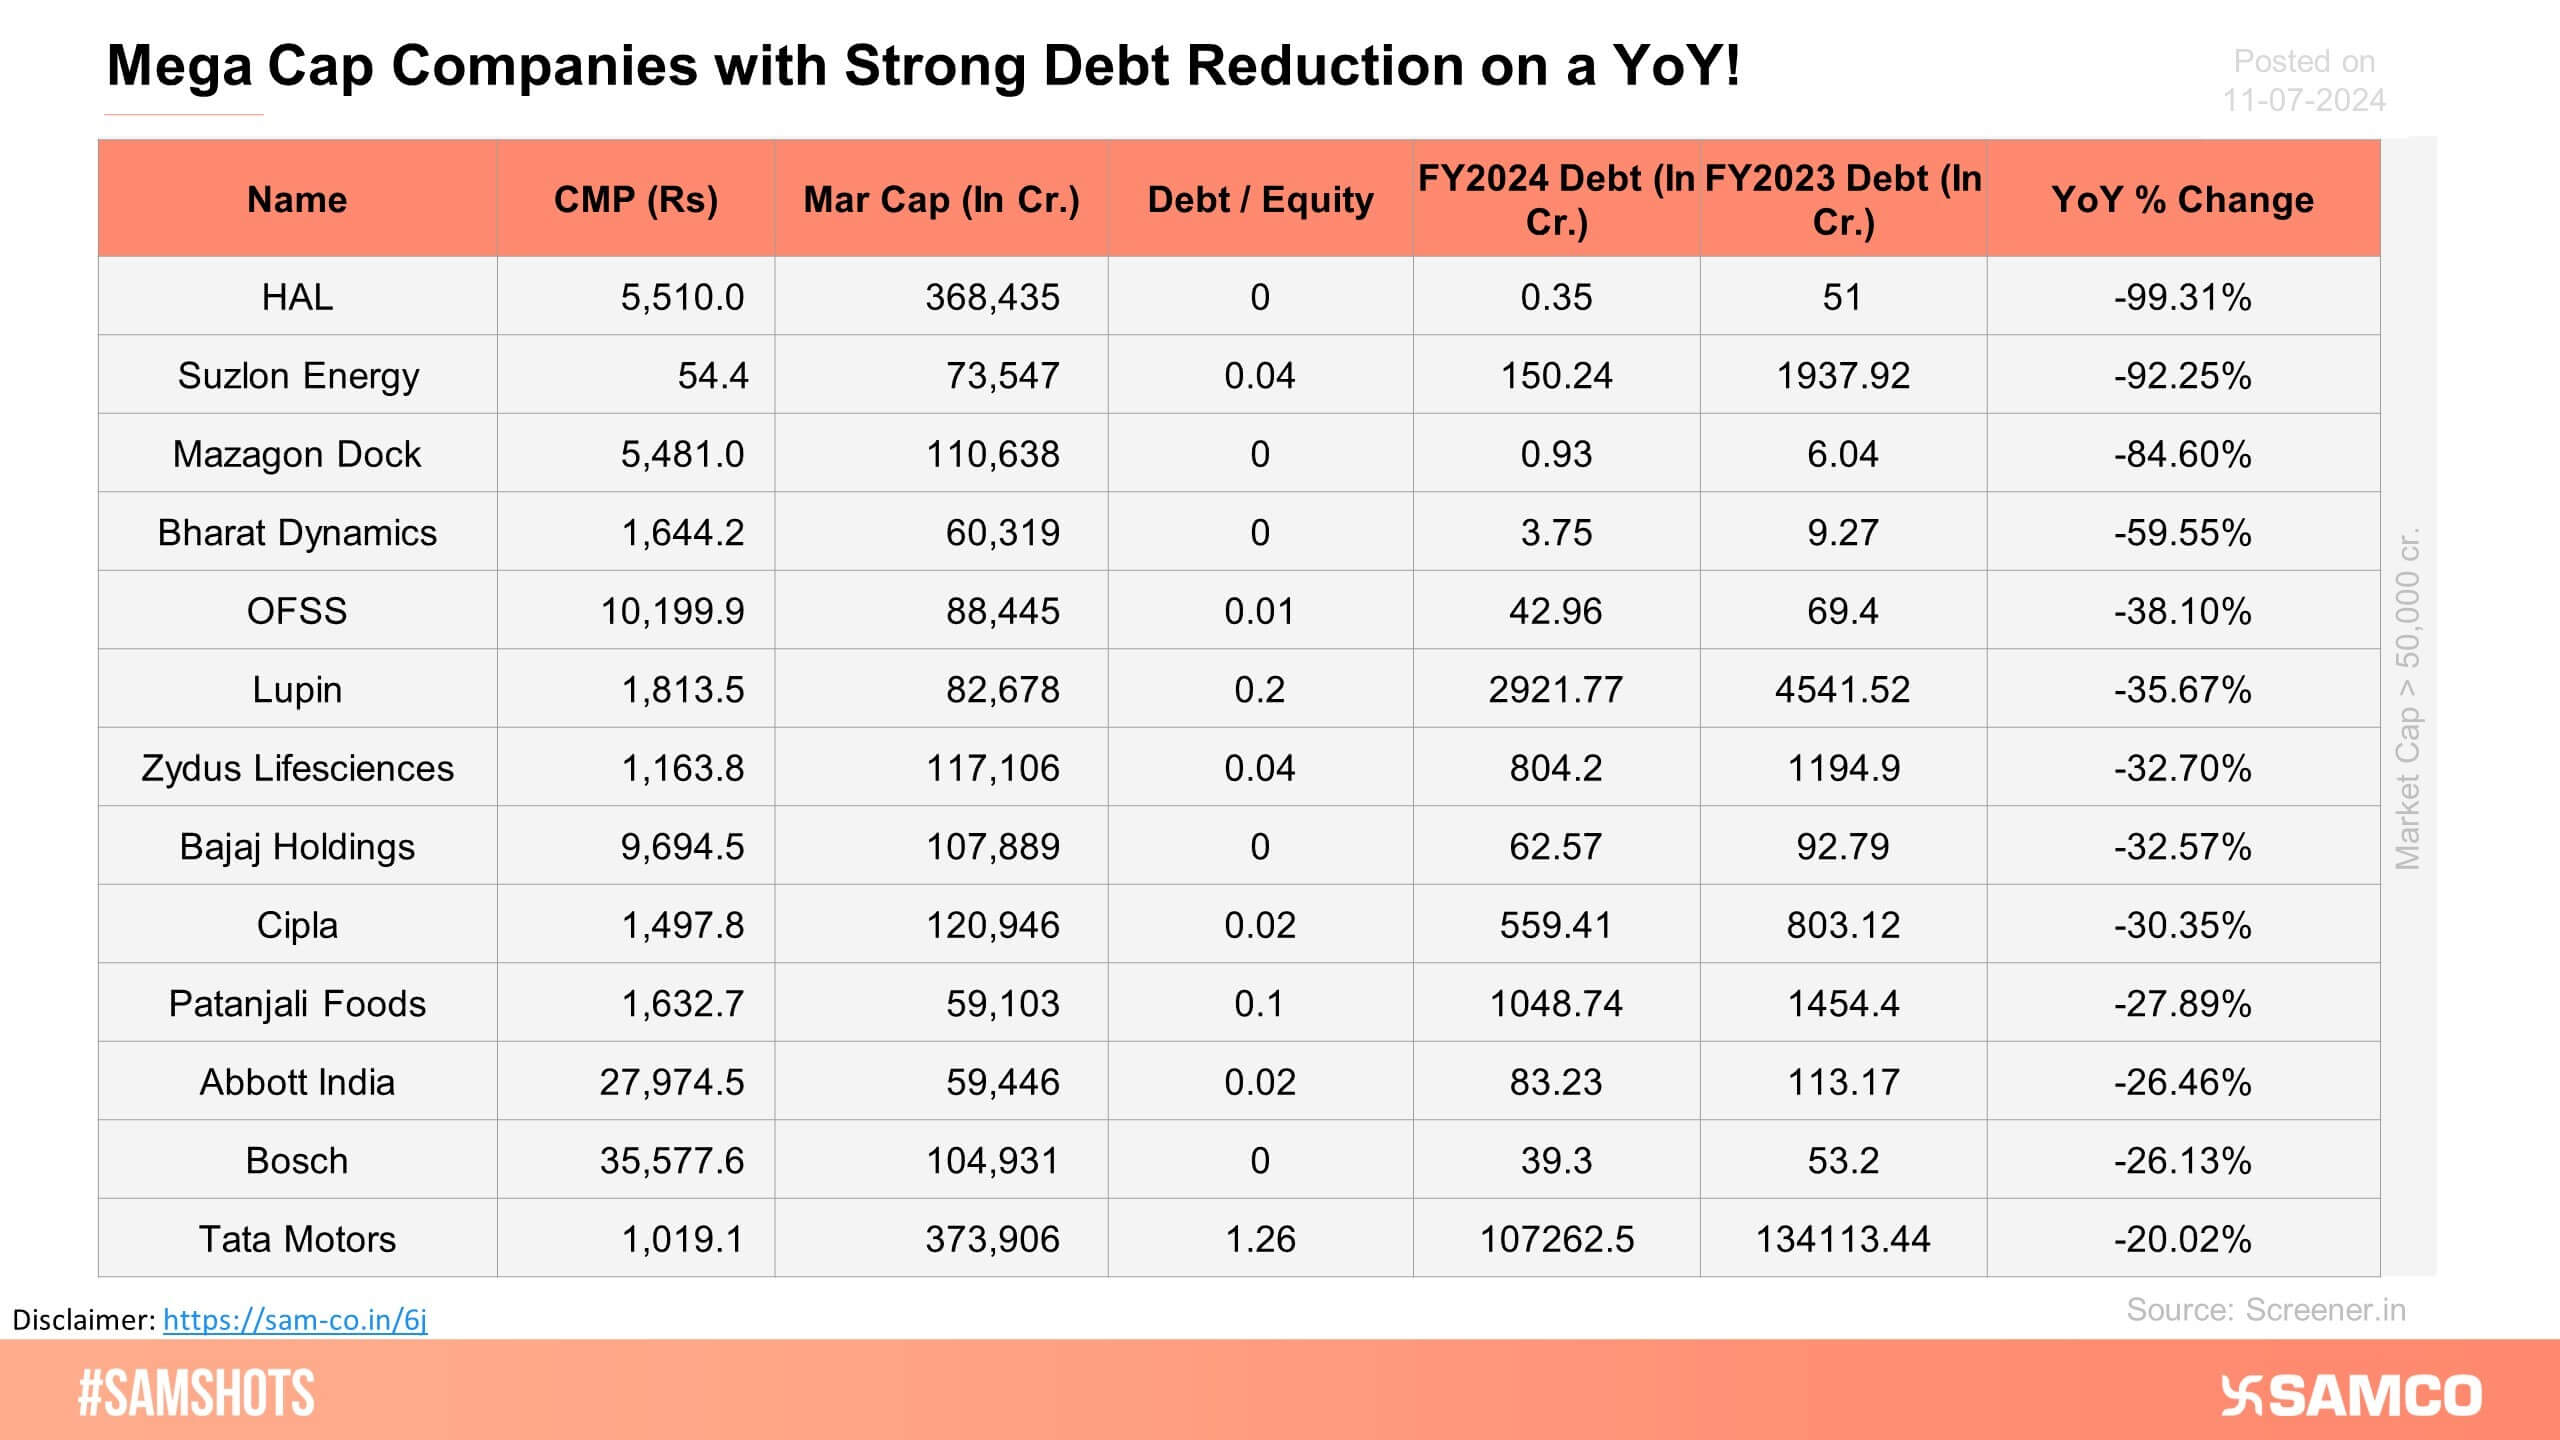
The chart below lists mega-cap companies reducing their debt on a year-over-year basis.
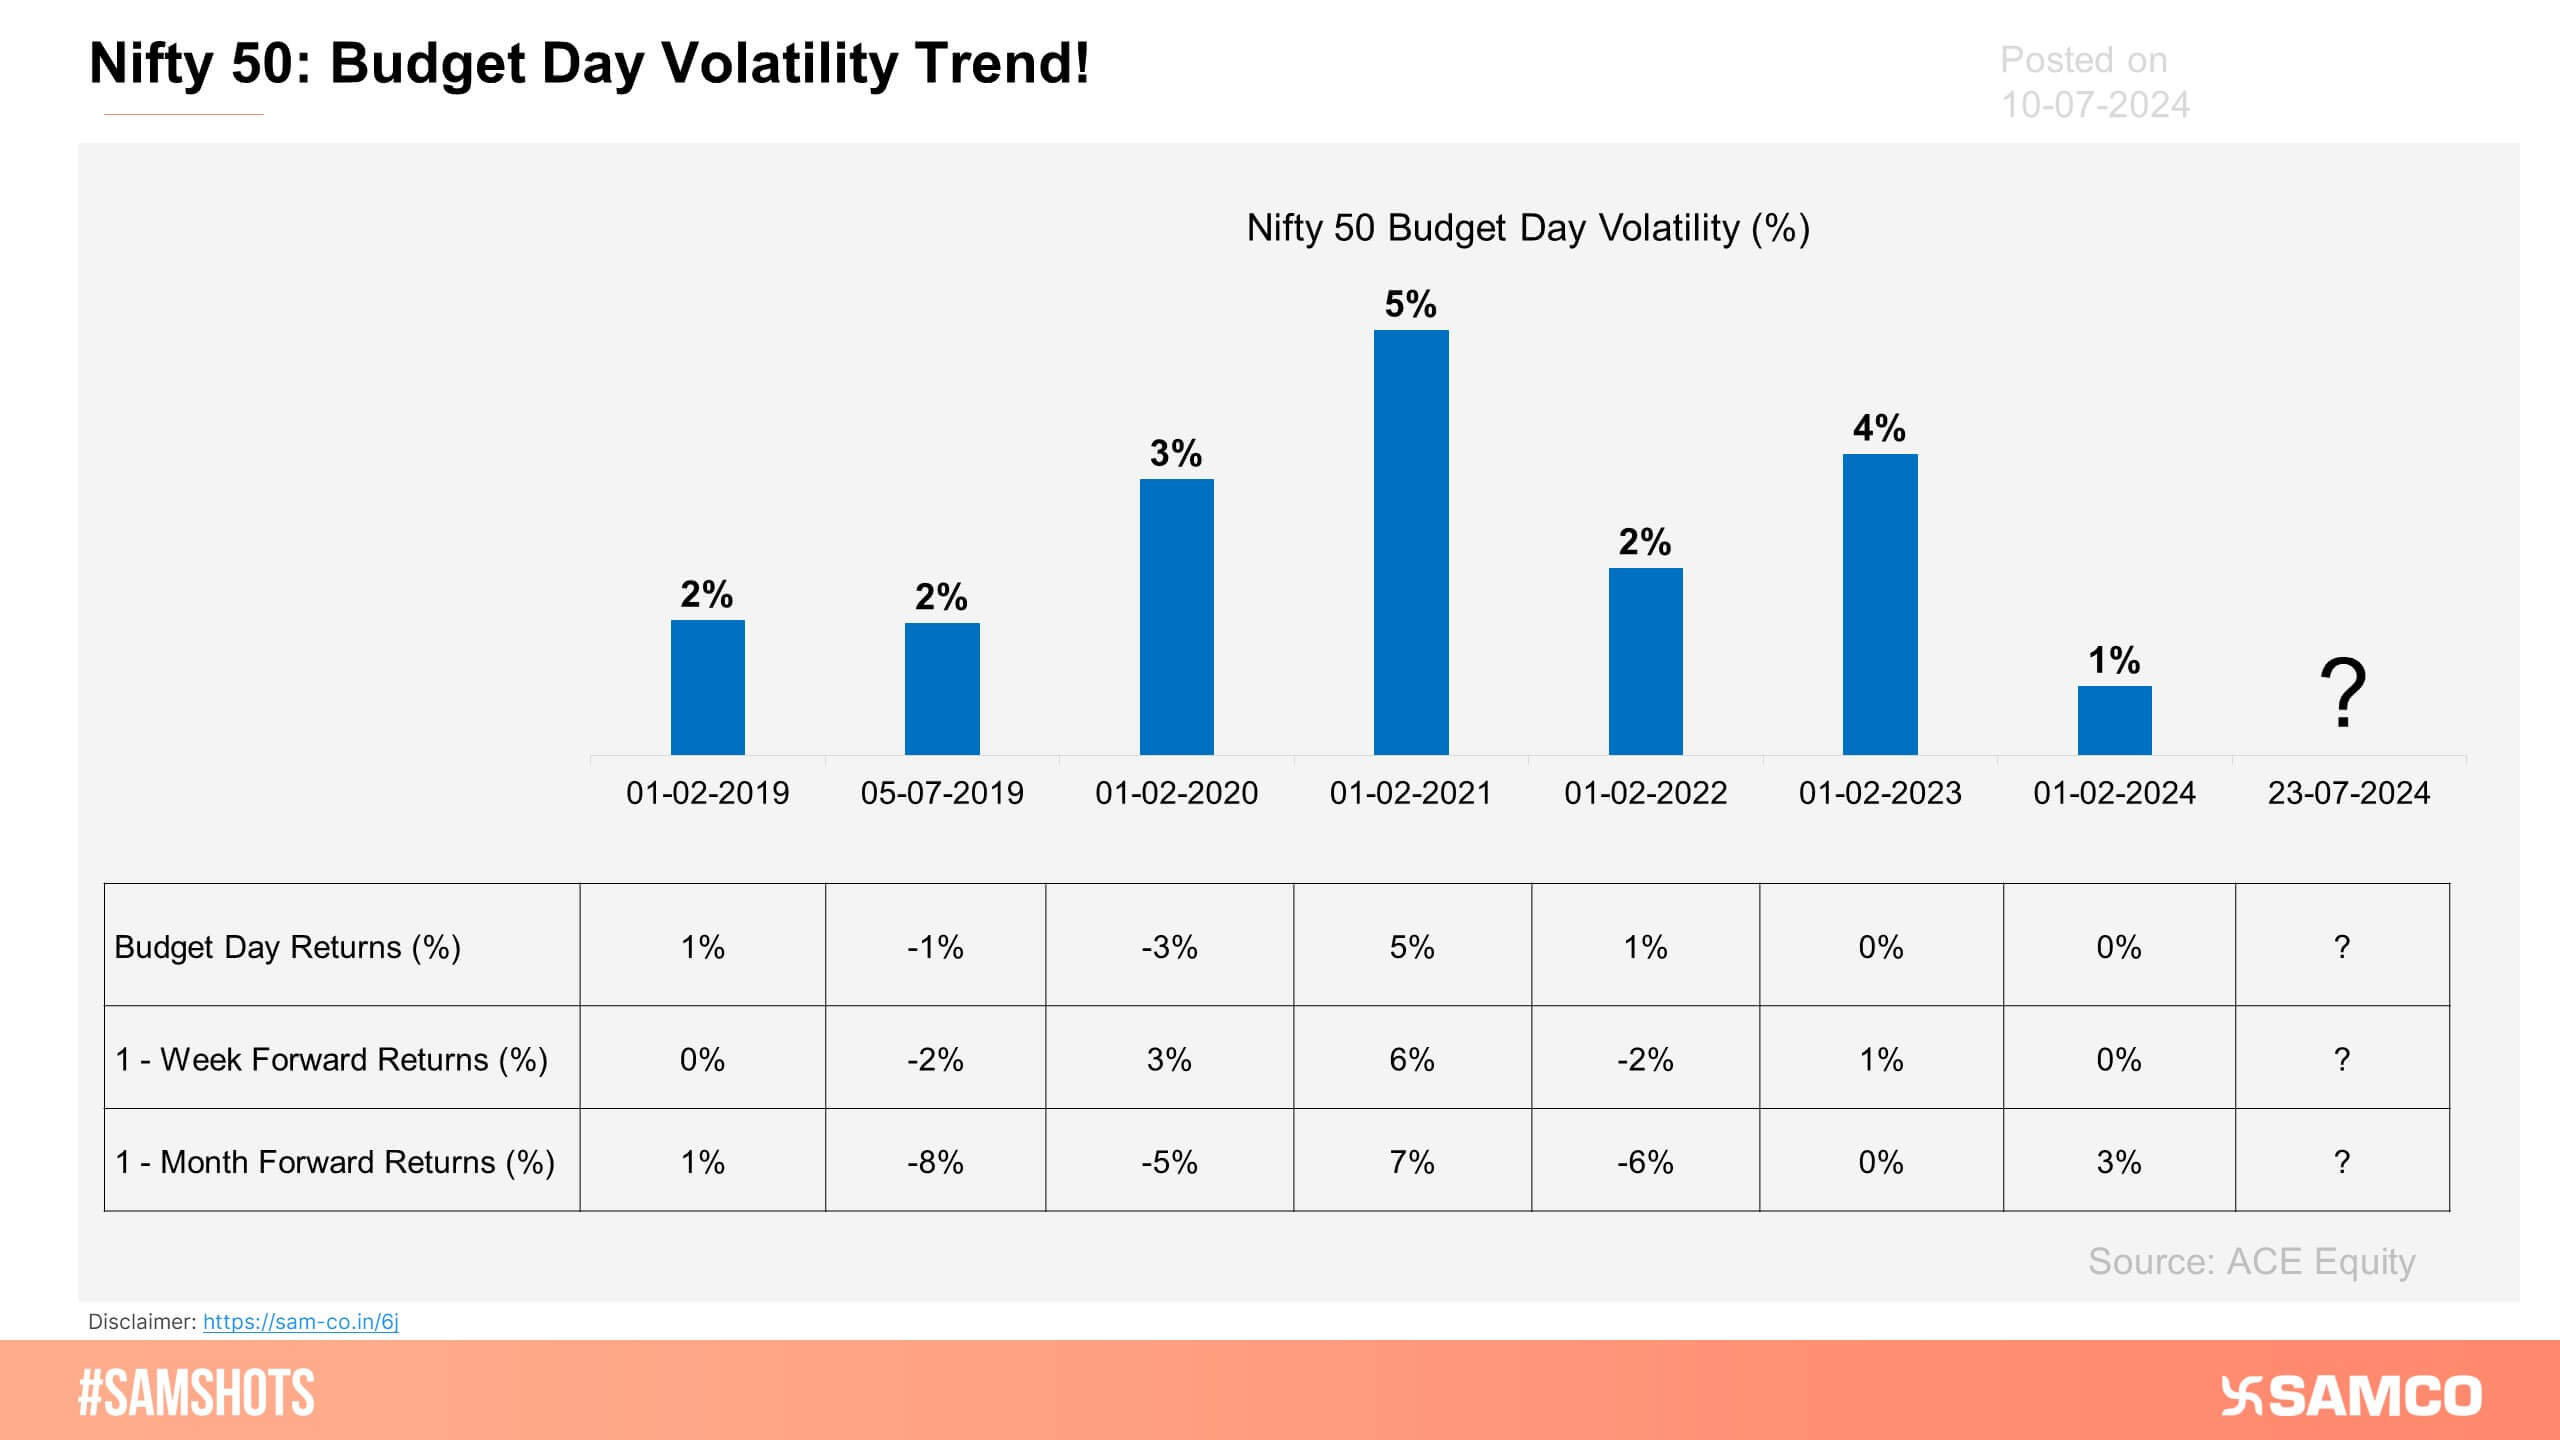
Nifty 50’s volatility generally fluctuated between 2% and 5% on budget days, except for 1% in 2024. The average volatility of Nifty 50 on the budget day is 3%. The average 1-week forward return is 1%, while the average 1-month forward return is -1%.
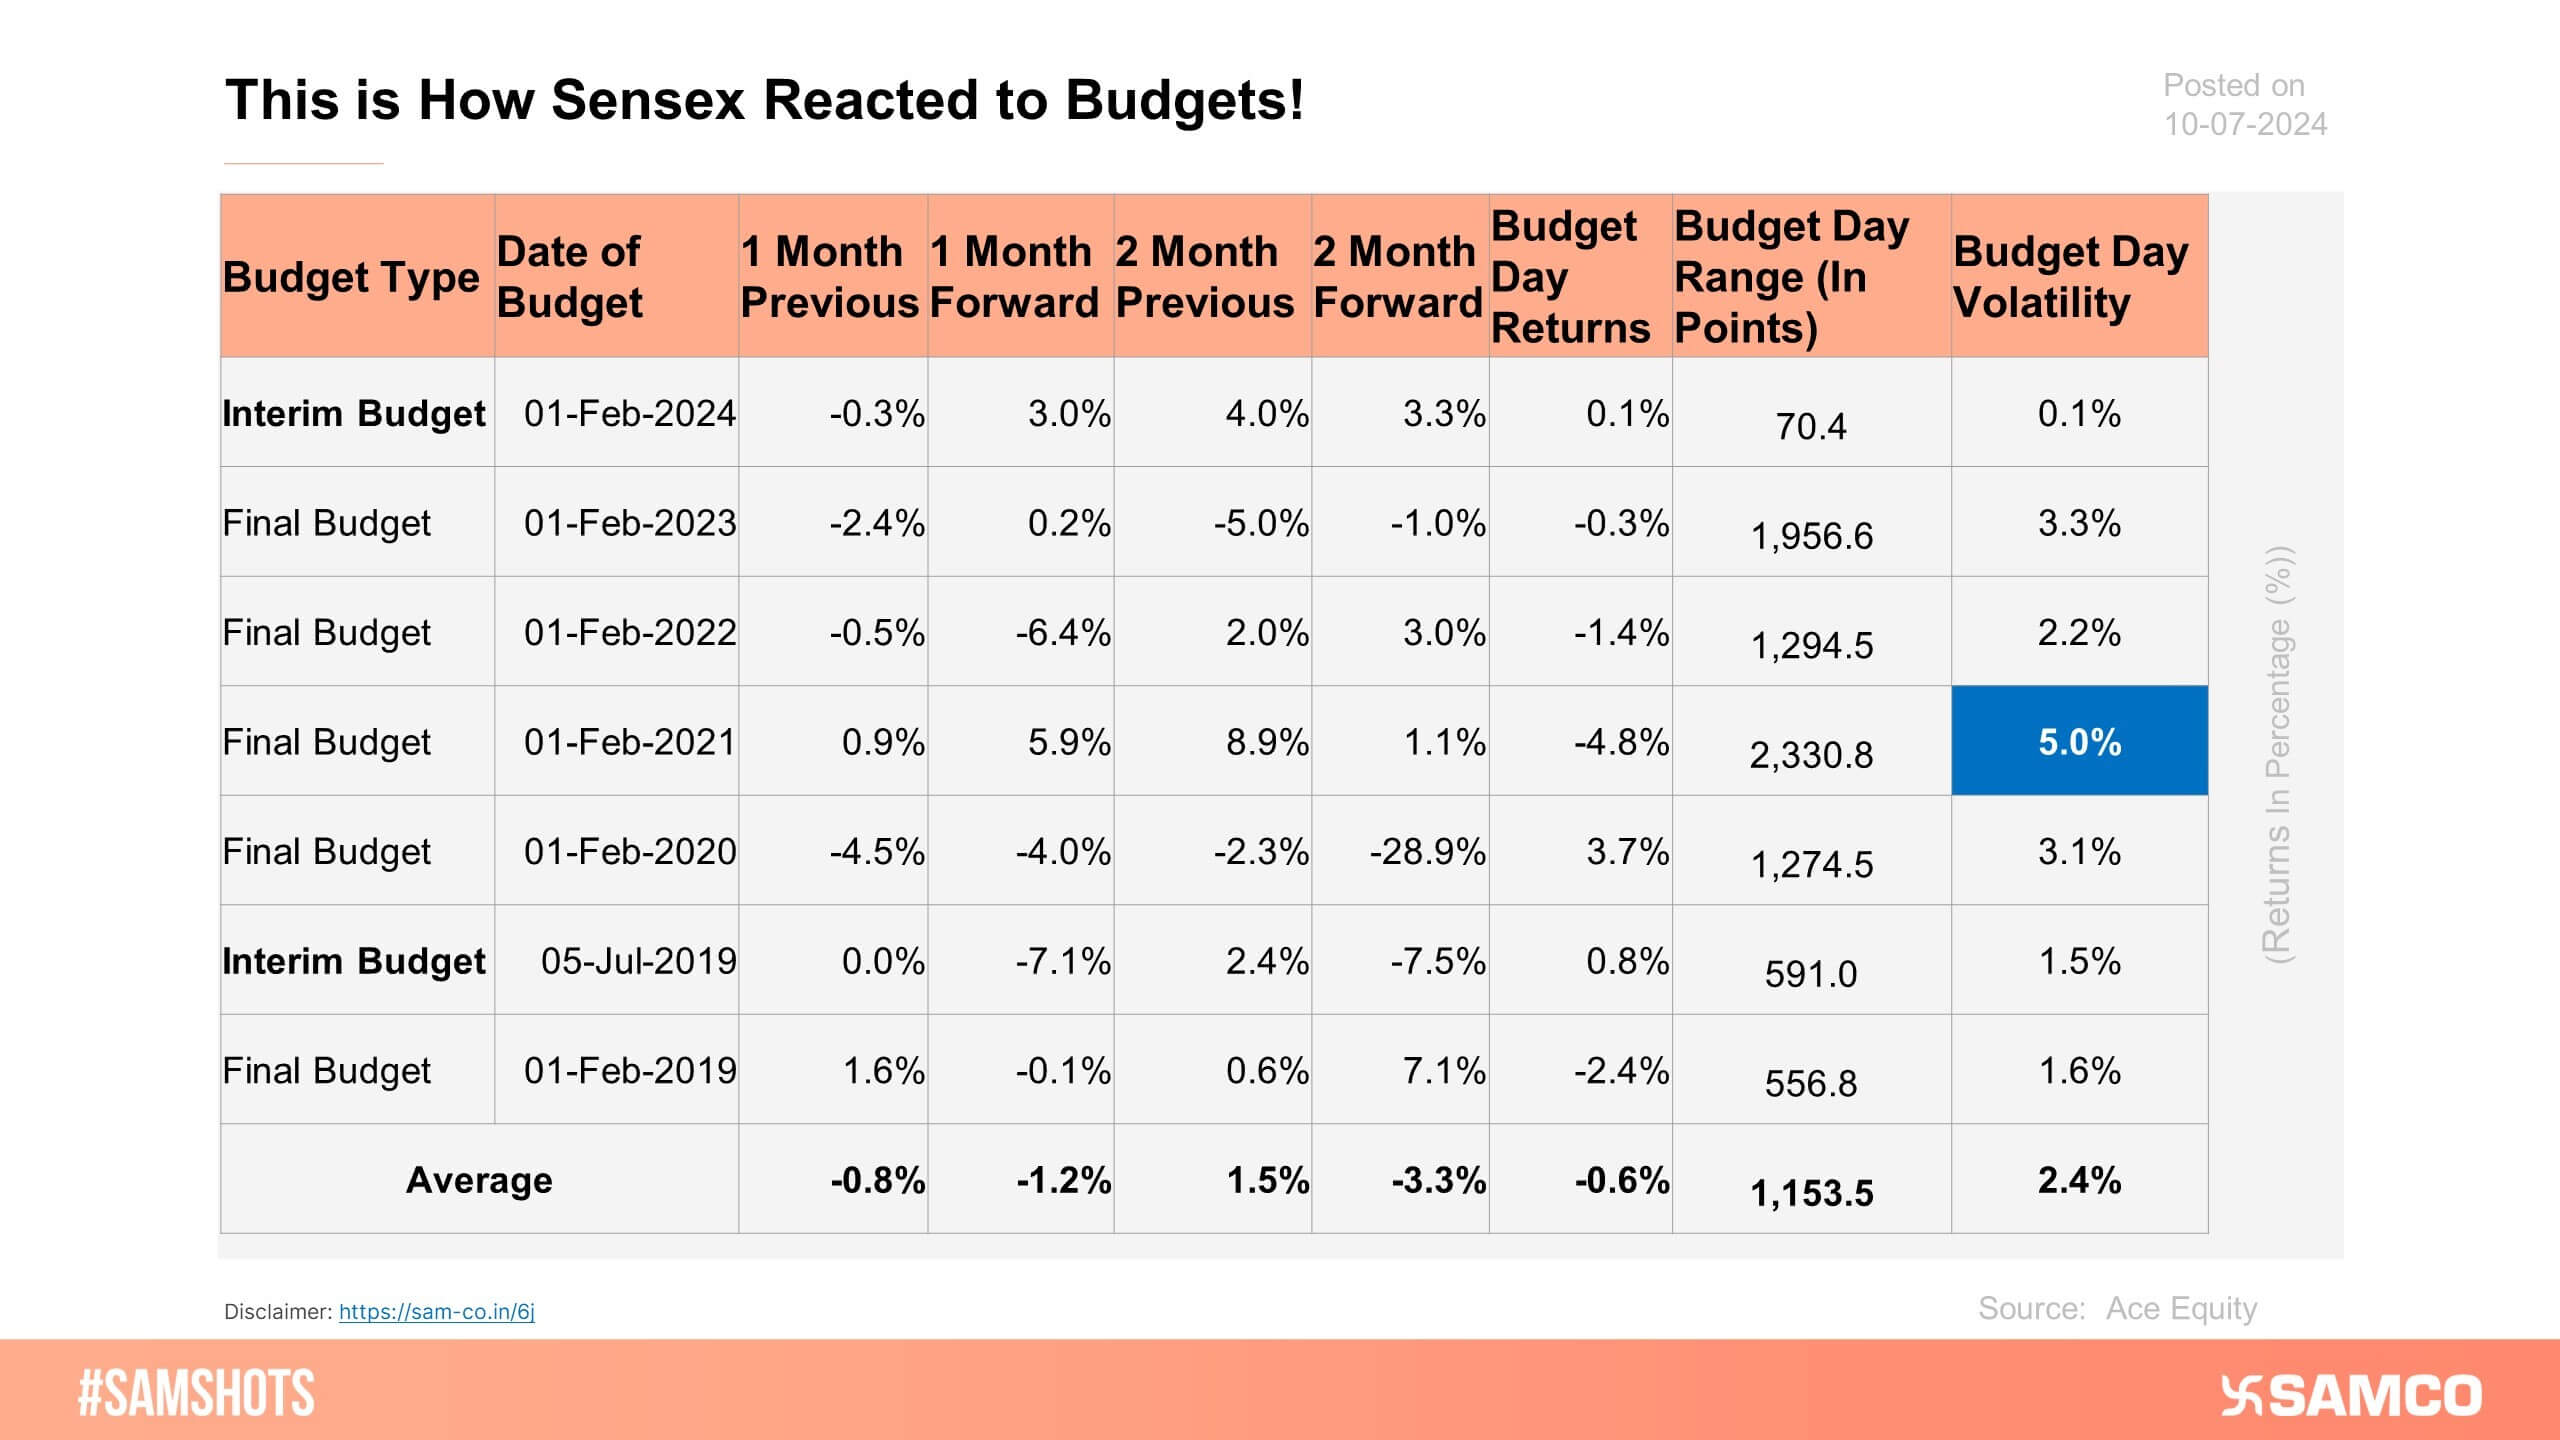
Here’s how Sensex reacts after budget day!
The chart illustrates the historical volatility trend observed in Nifty Pharma on budget day.
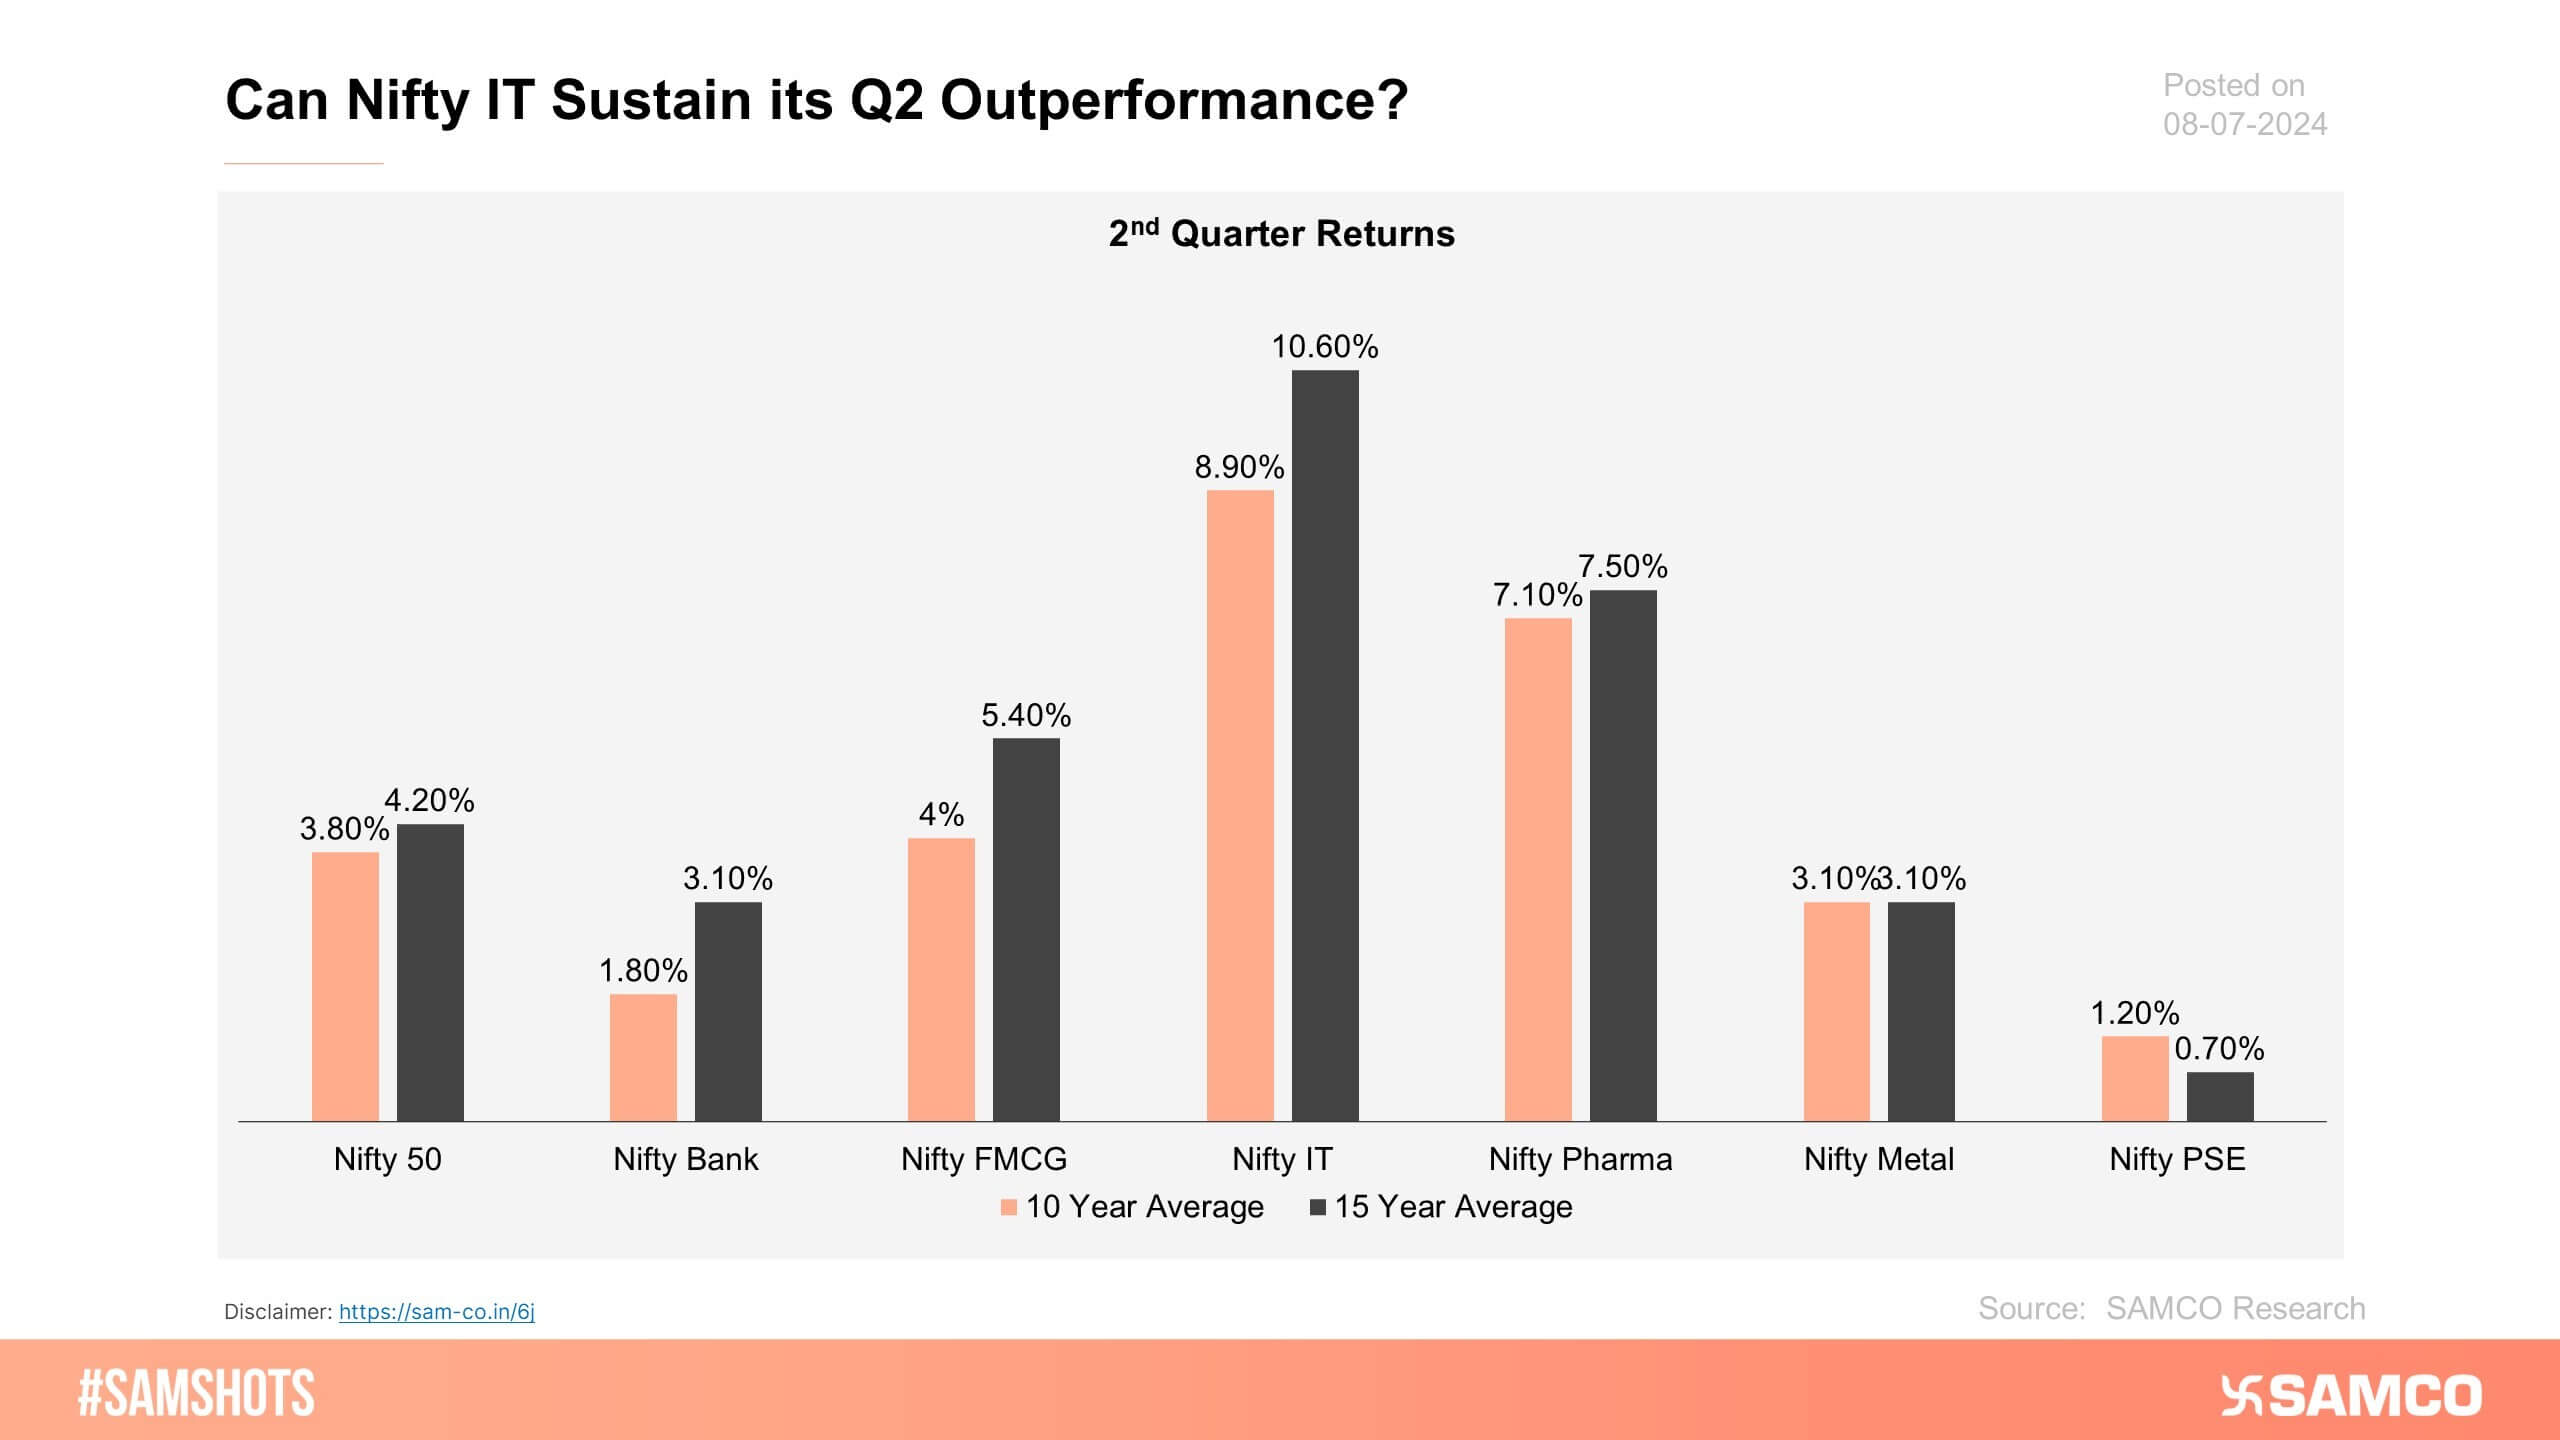
The trend of Nifty IT outperformance in the second quarter of the previous 10 financial years is quite intriguing.
Here\'s the one-week return of sectoral indices!
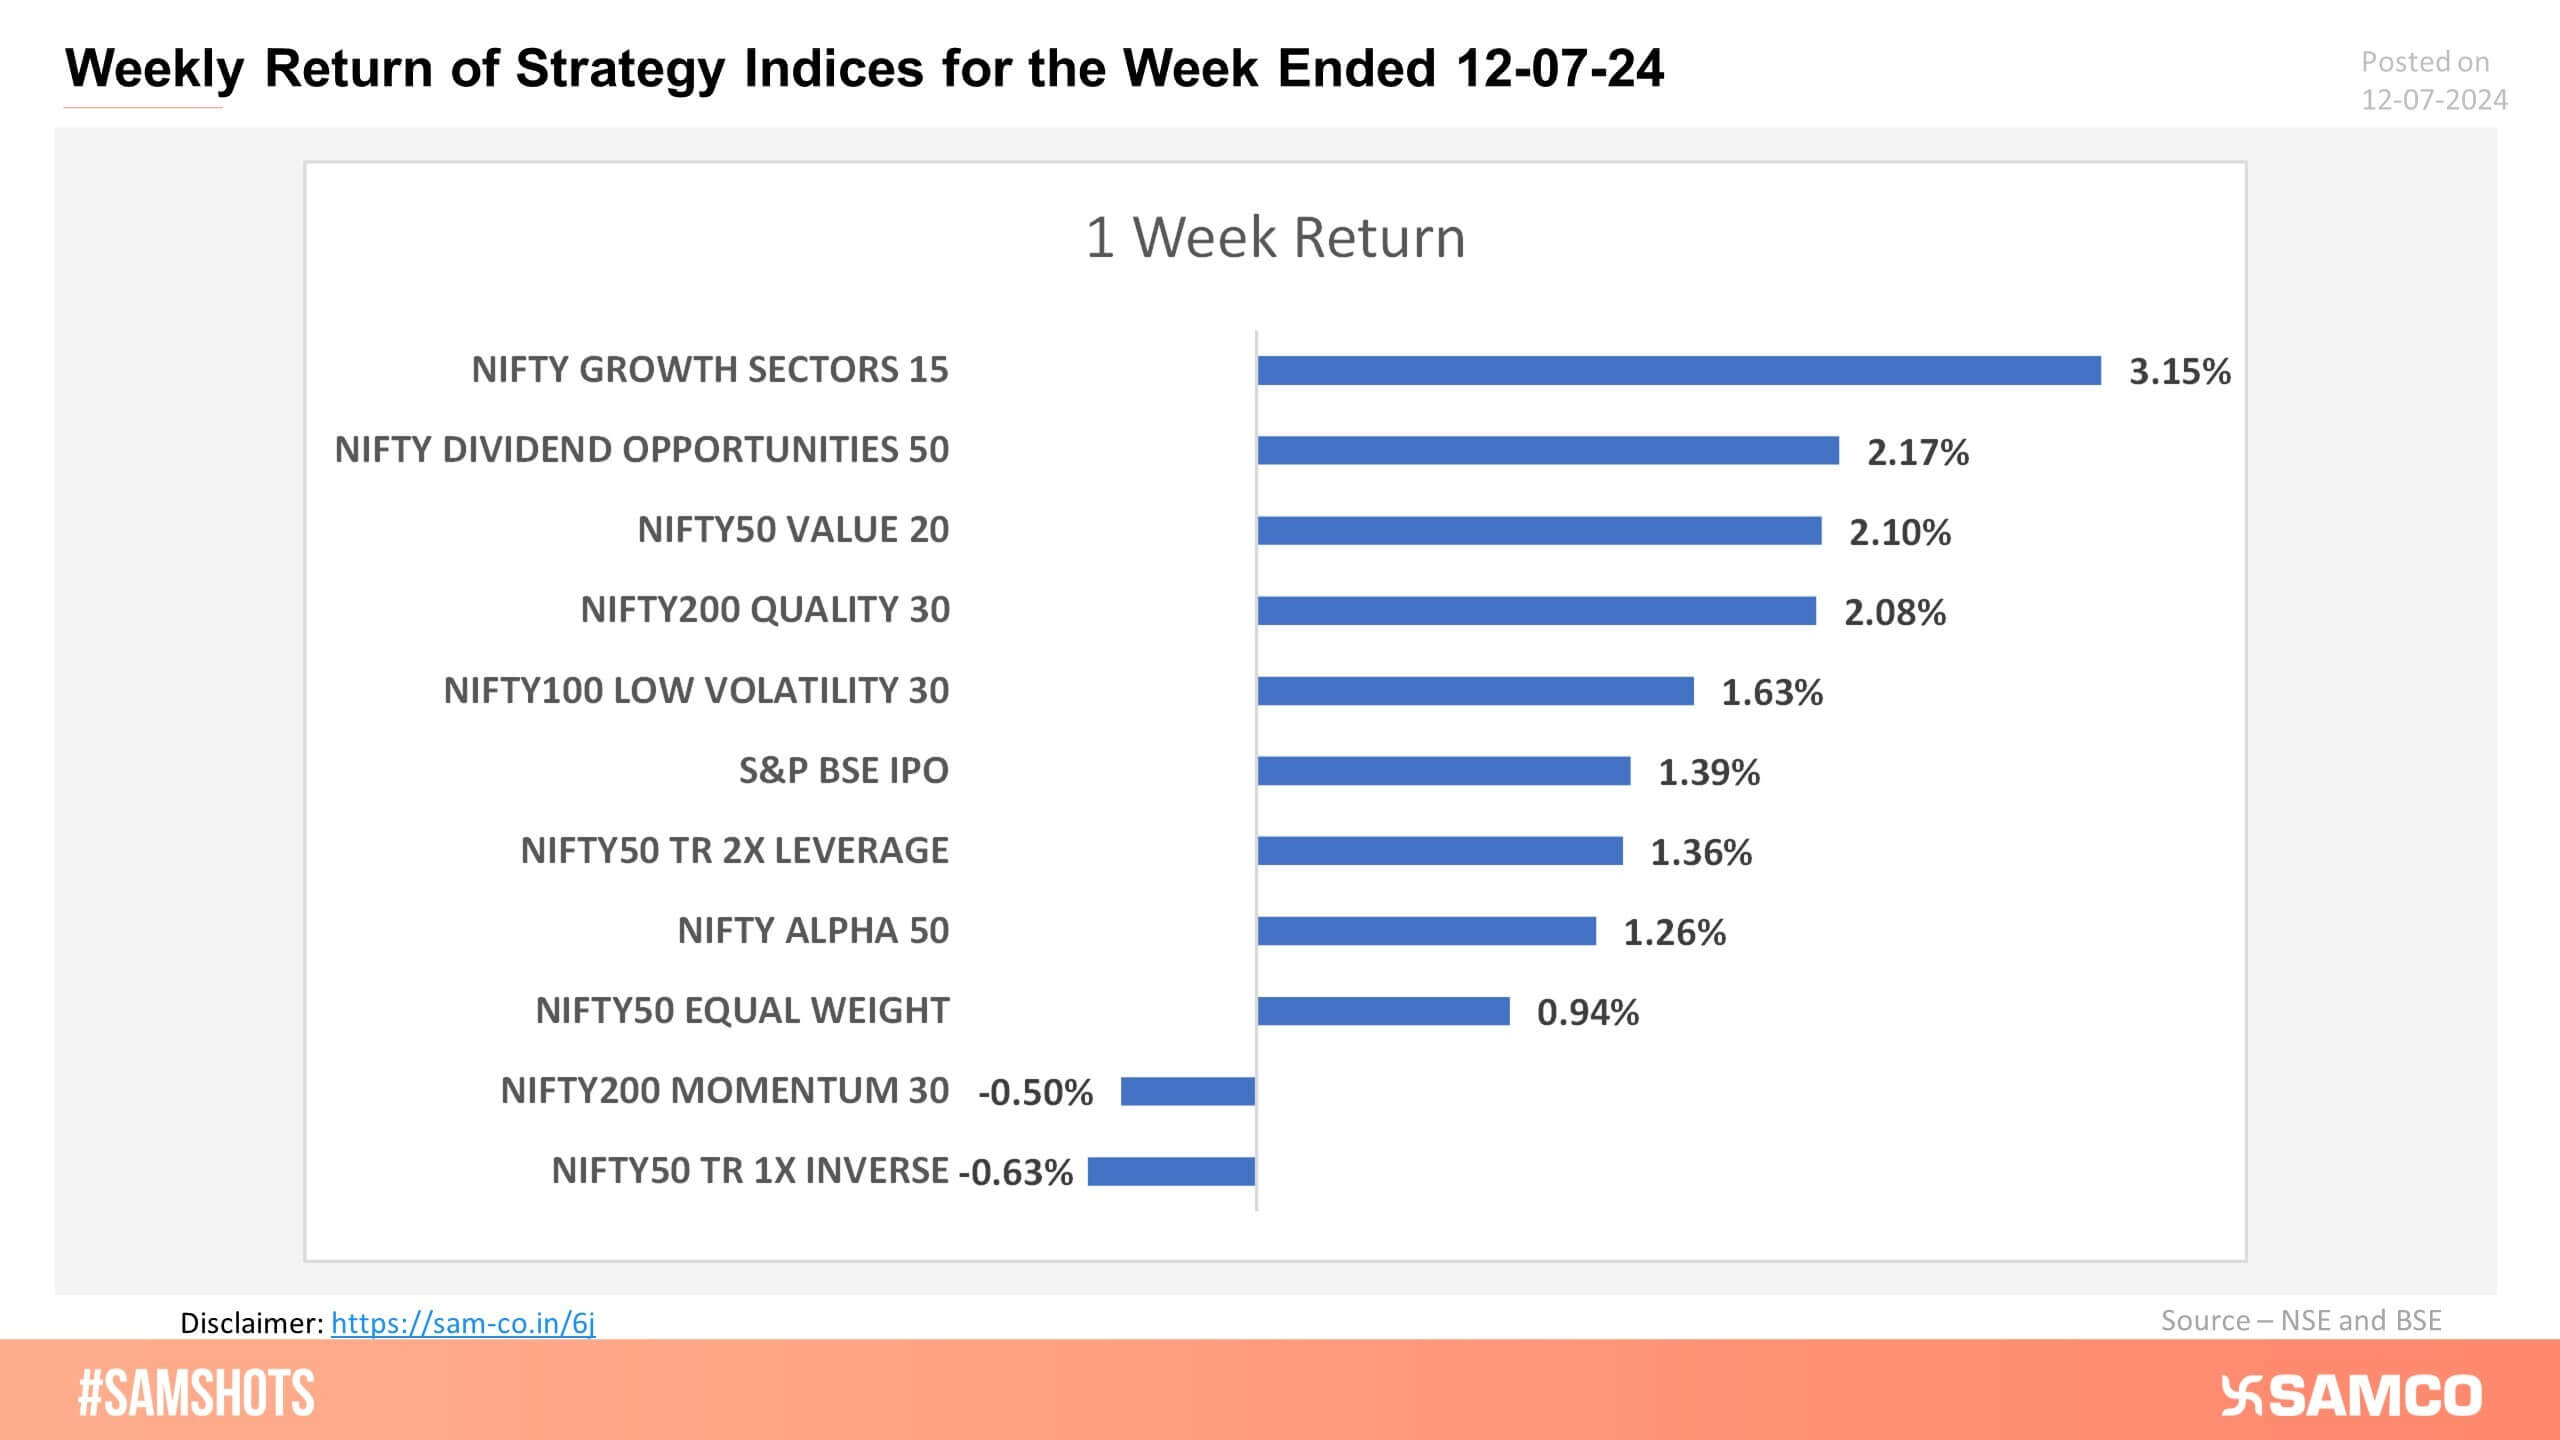
Here\'s the one-week return of strategy indices!
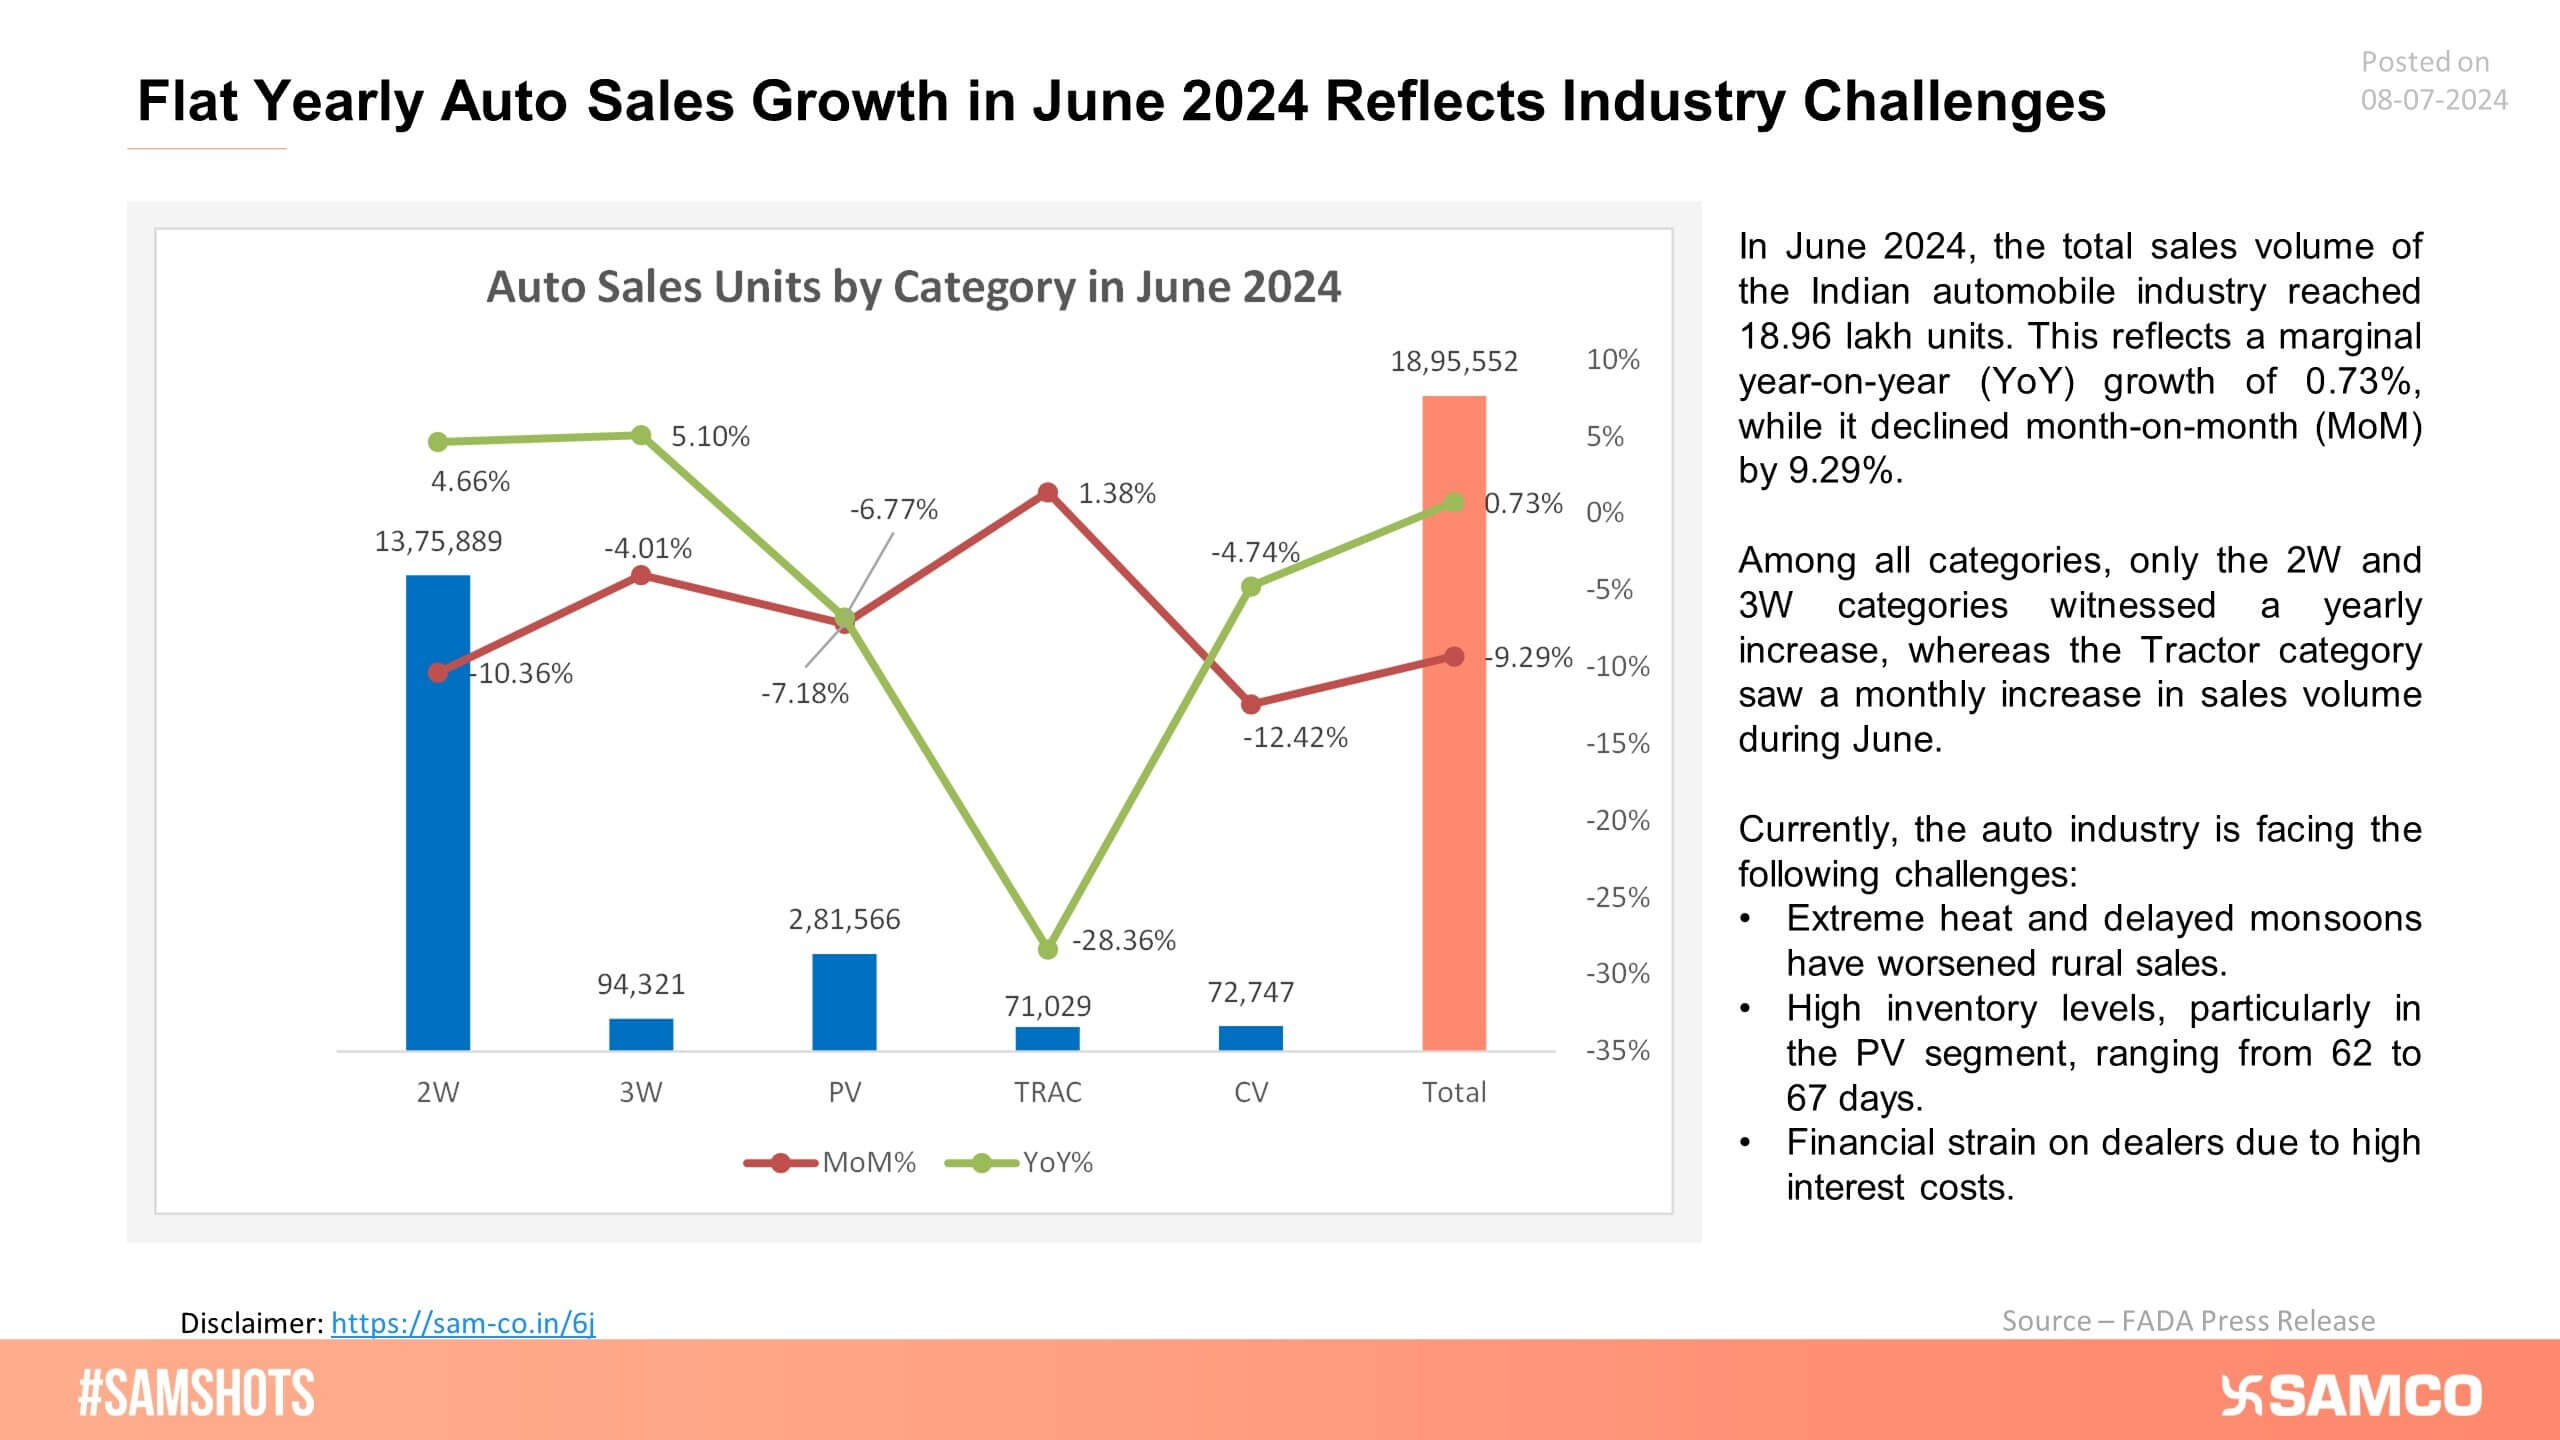
The above chart shows the category-wise growth in automobile sales volume in June 2024.
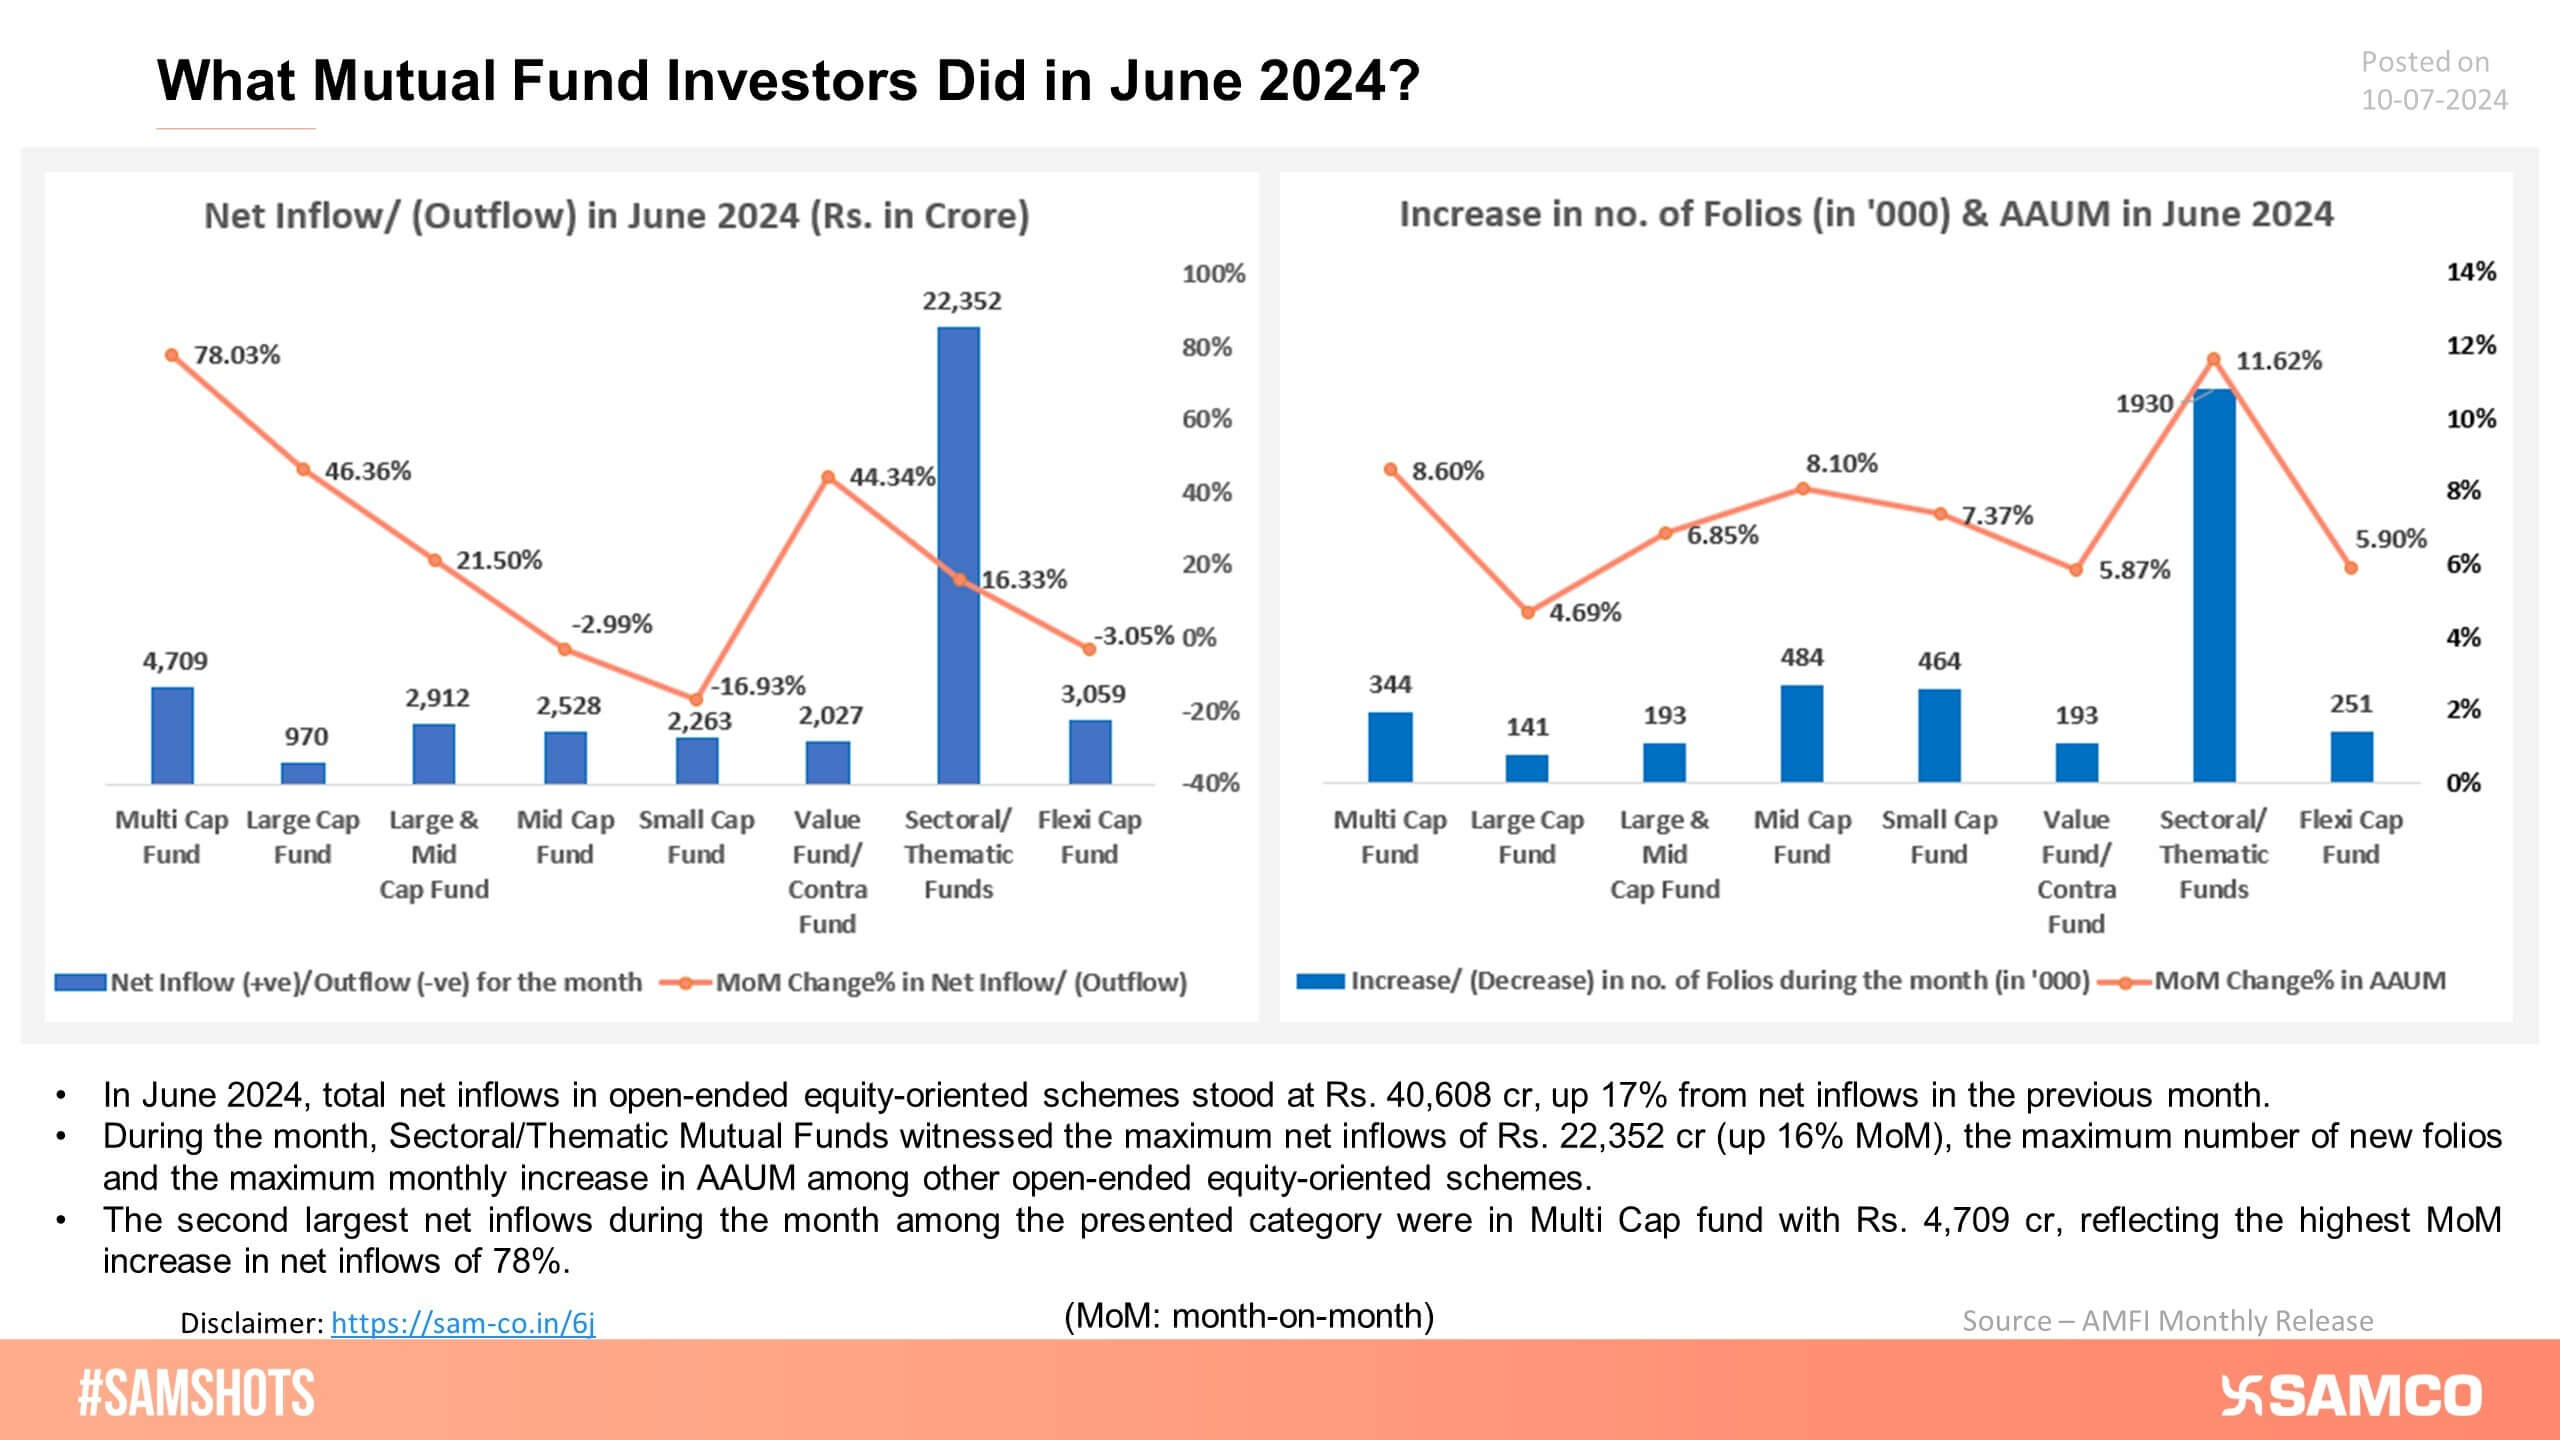
The above chart shows the fund flows, Average Assets Under Management (AAUM) change, and new folios among equity-oriented mutual fund schemes in June 2024.
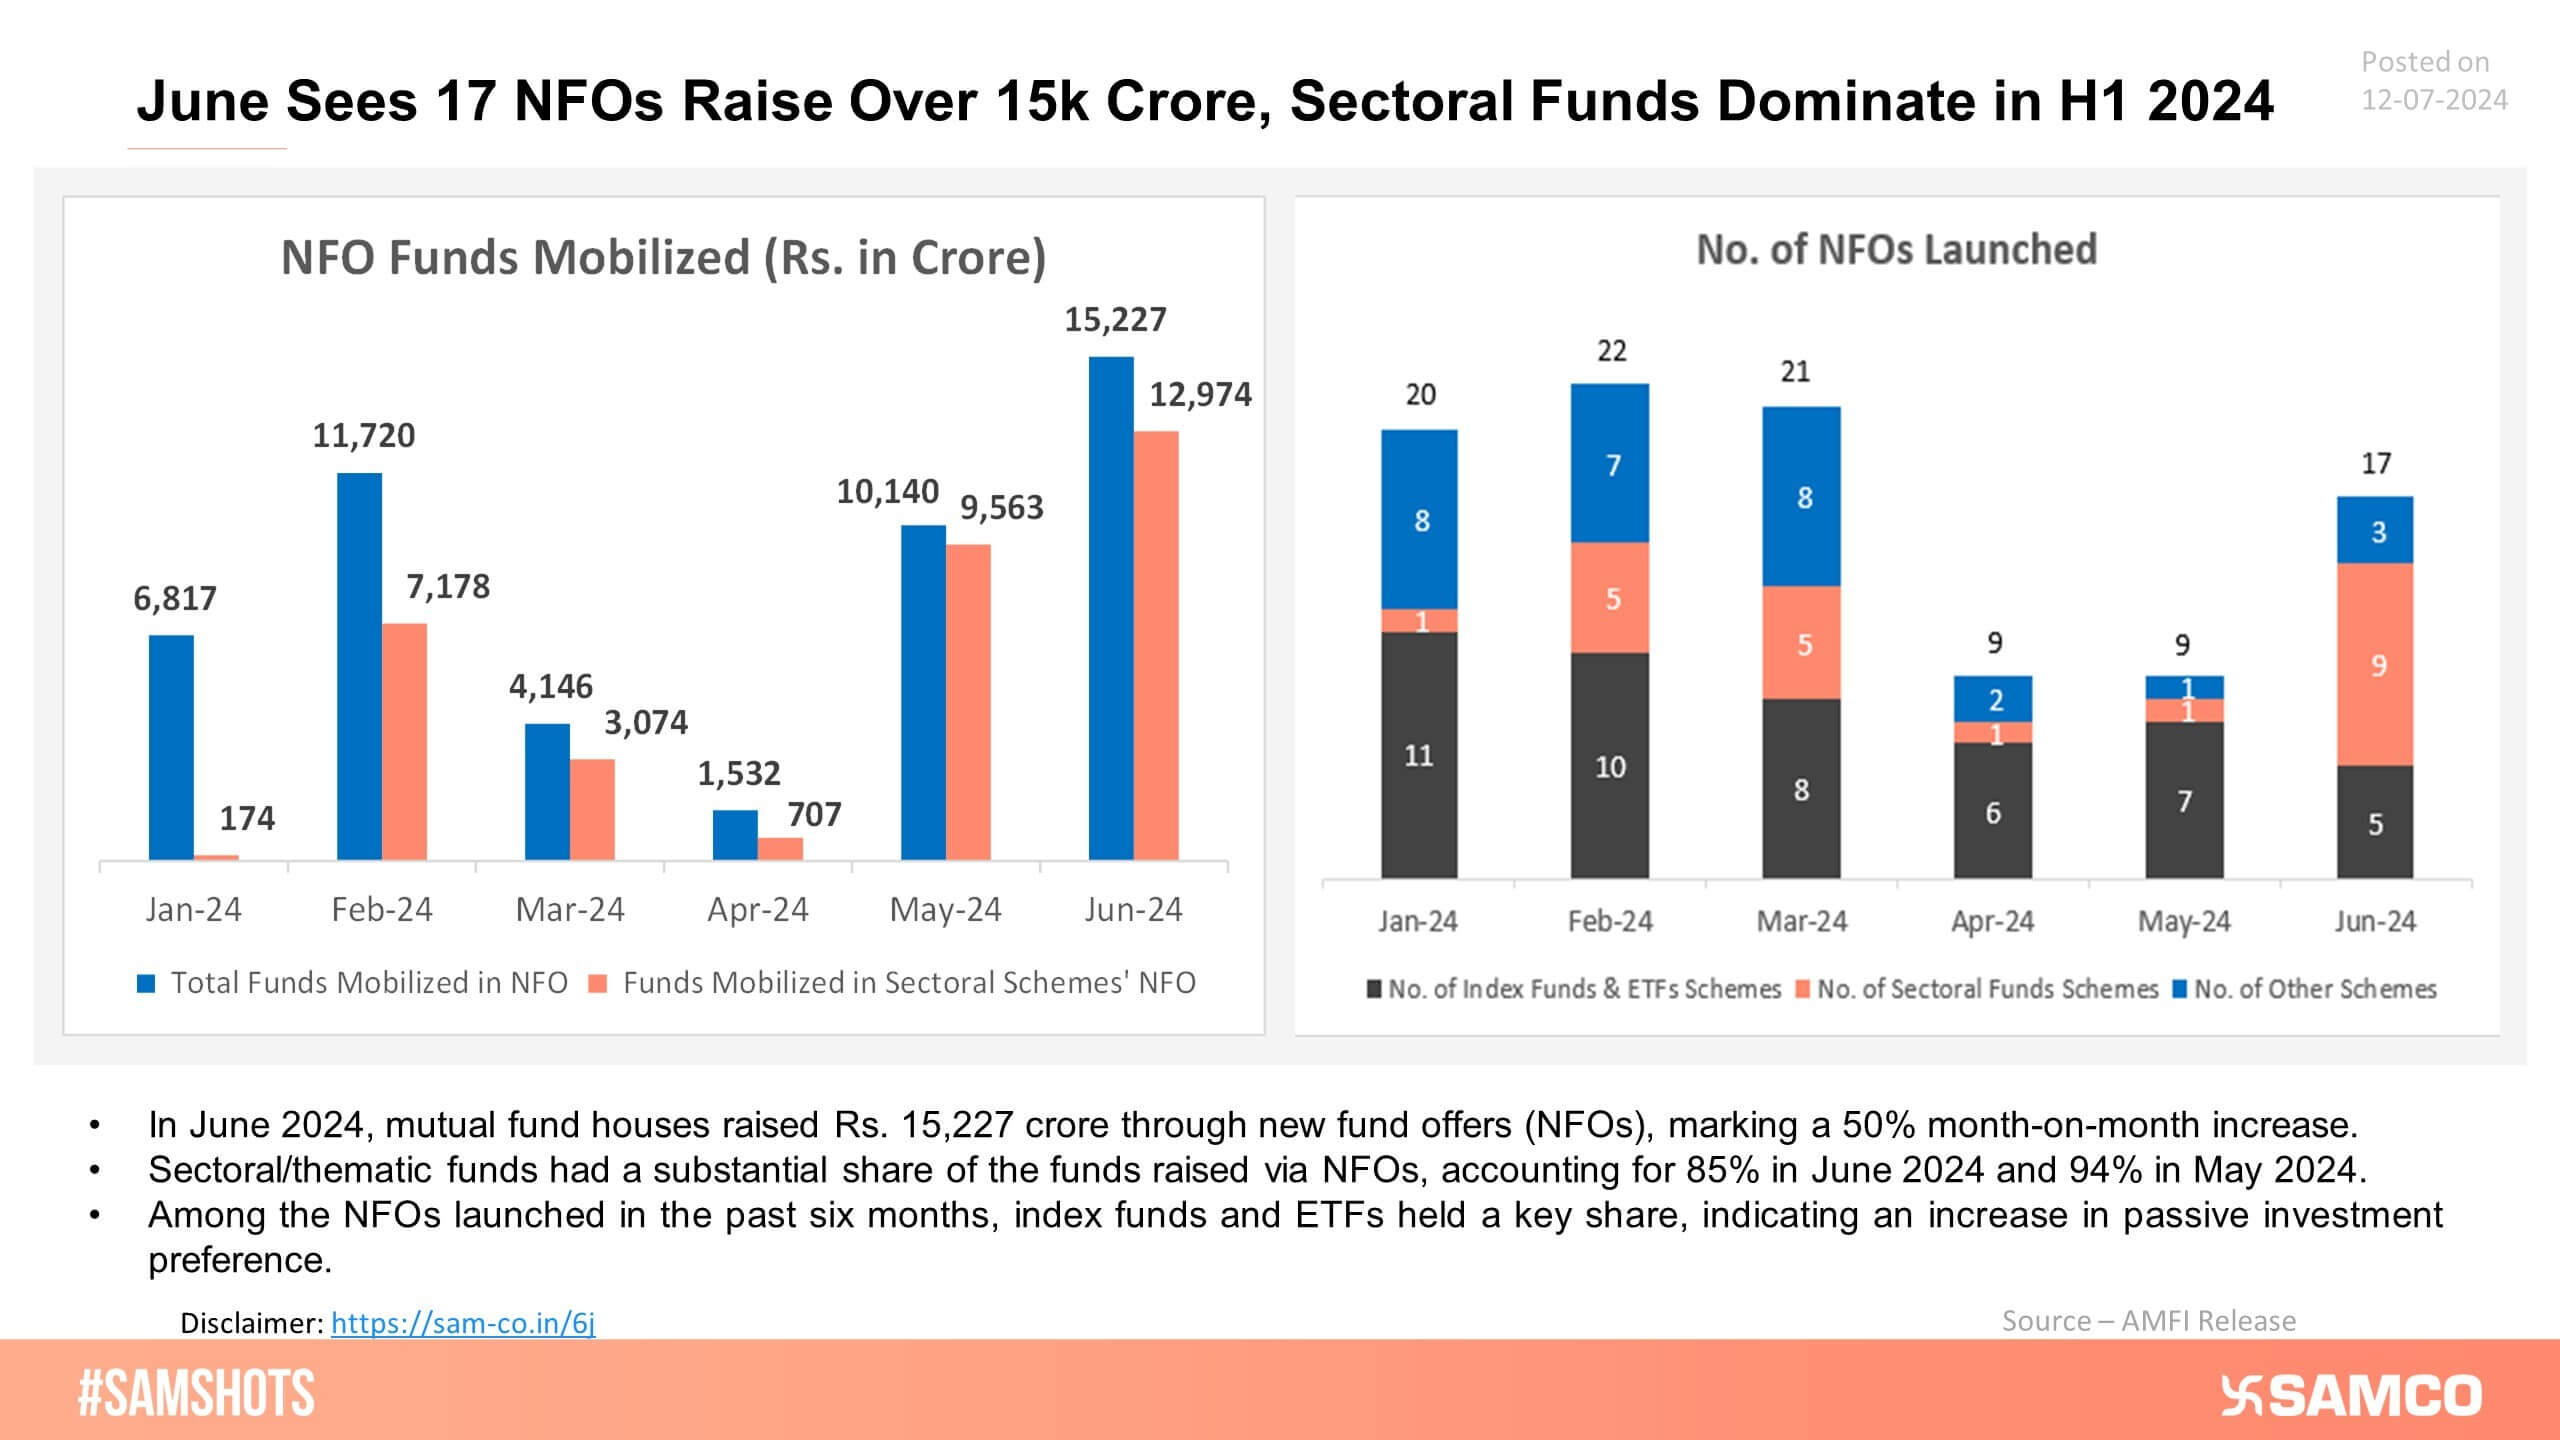
Here are the number of schemes launched and funds raised via NFO in H1 2024!
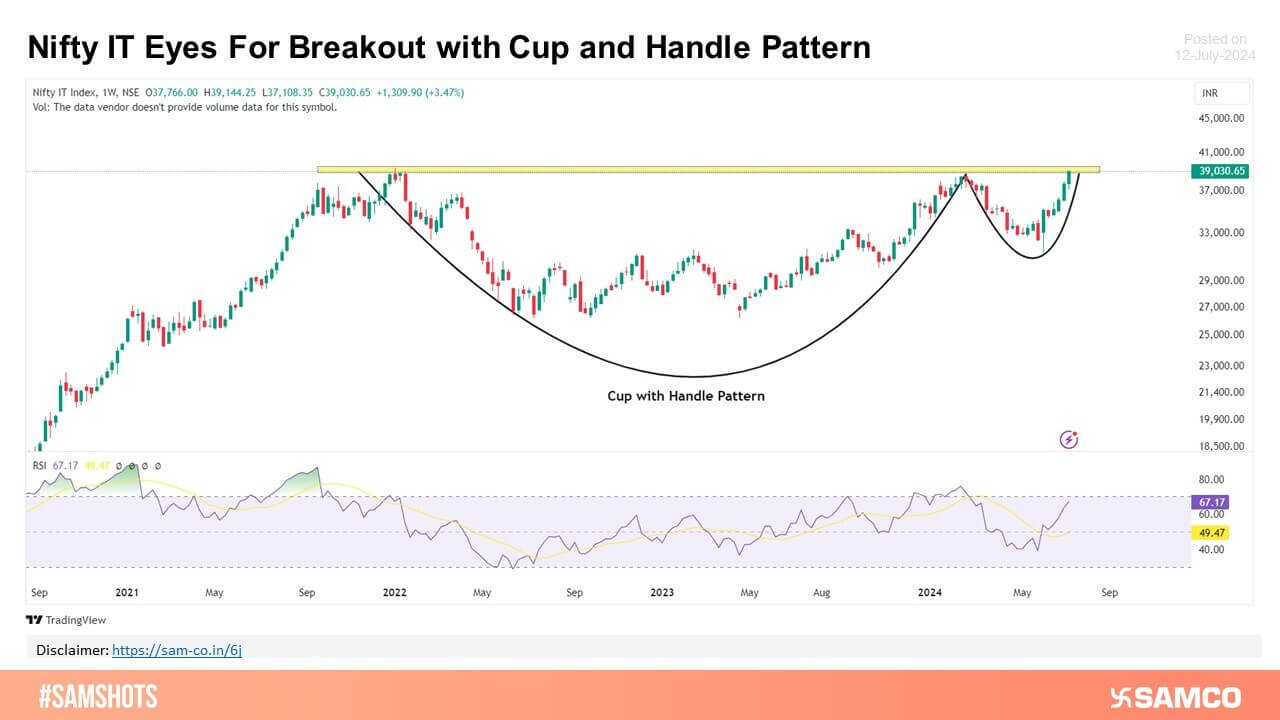
Nifty IT inches towards 52 Week High
CEAT LTD shows a rounding bottom pattern, suggesting potential upward movement ahead.
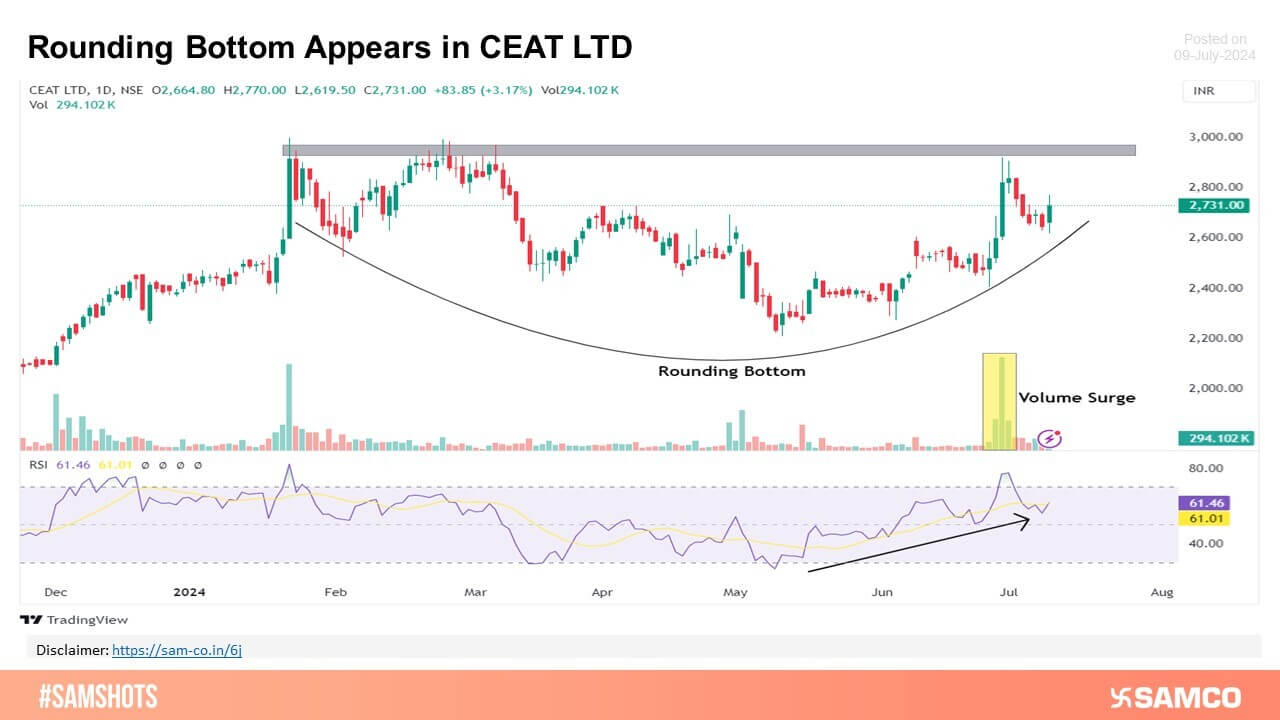
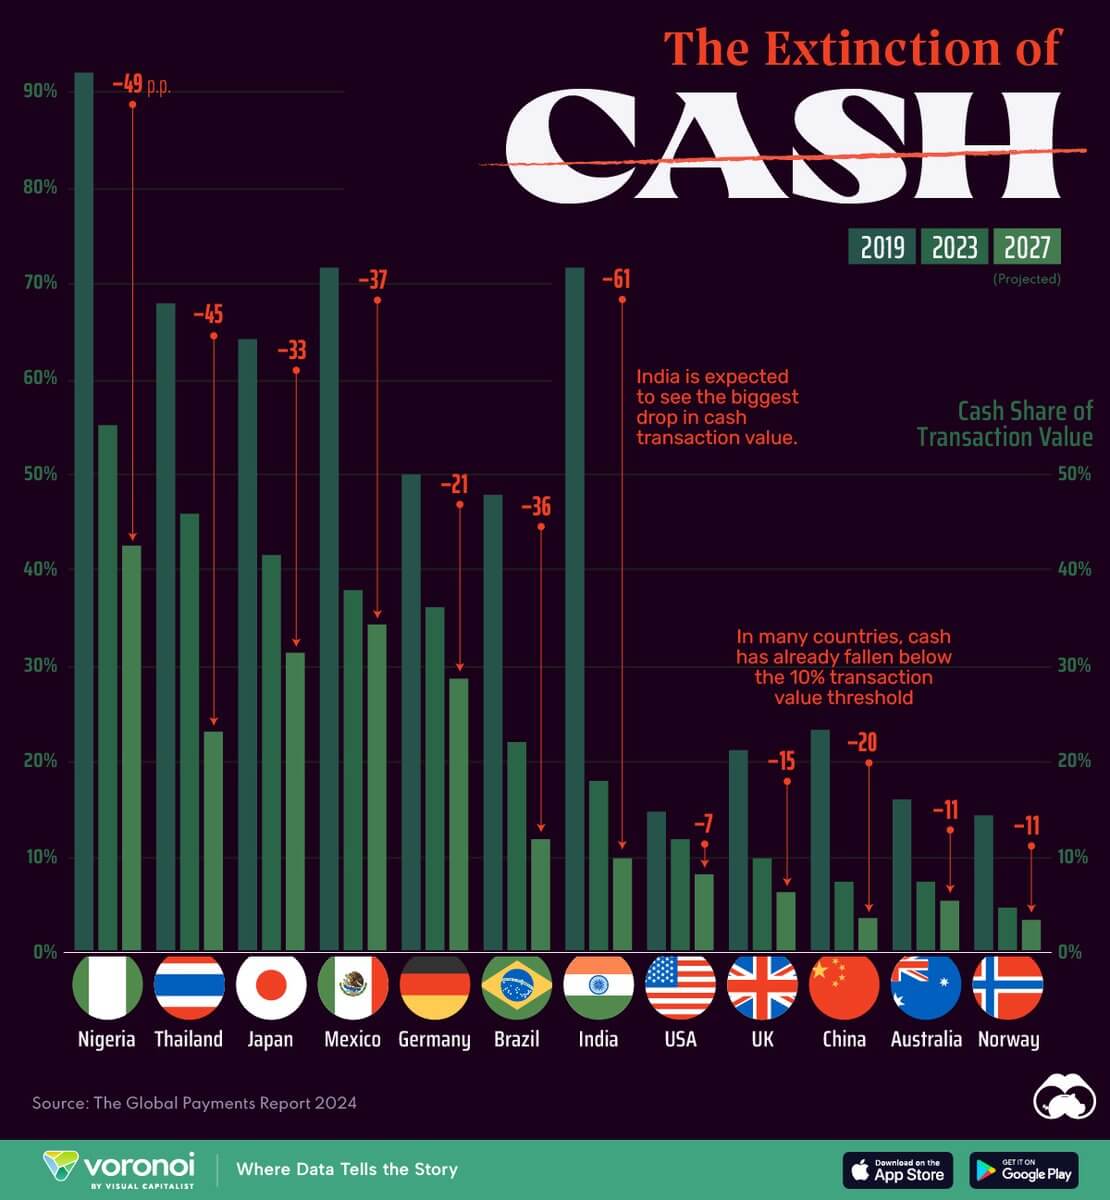
Image Source: @VisualCap (Twitter)
 Easy & quick
1. Register on SCORES portal
2. Mandatory details for filling complaints on SCORES
Name | PAN | Address | Mobile | Number | E-mail ID
3. Benefits
Effective Communication
Speedy redressal of the grievances
