The Indian markets staged a strong comeback this week, with the Nifty 50 clocking its biggest weekly gain in four years, closing on a positive note throughout the week.
After weeks of sustained selling and heightened volatility, both Midcap and Smallcap segments saw a sharp recovery, supported by renewed investor interest.
Globally, the outcome of the FOMC meeting brought some relief, as the Federal Reserve kept interest rates steady at 4.25%–4.50%, matching market expectations. However, the Fed’s updated dot plot signaled a slightly higher year-end inflation forecast of 2.7%, coupled with a trimmed U.S. growth outlook of 1.7%.
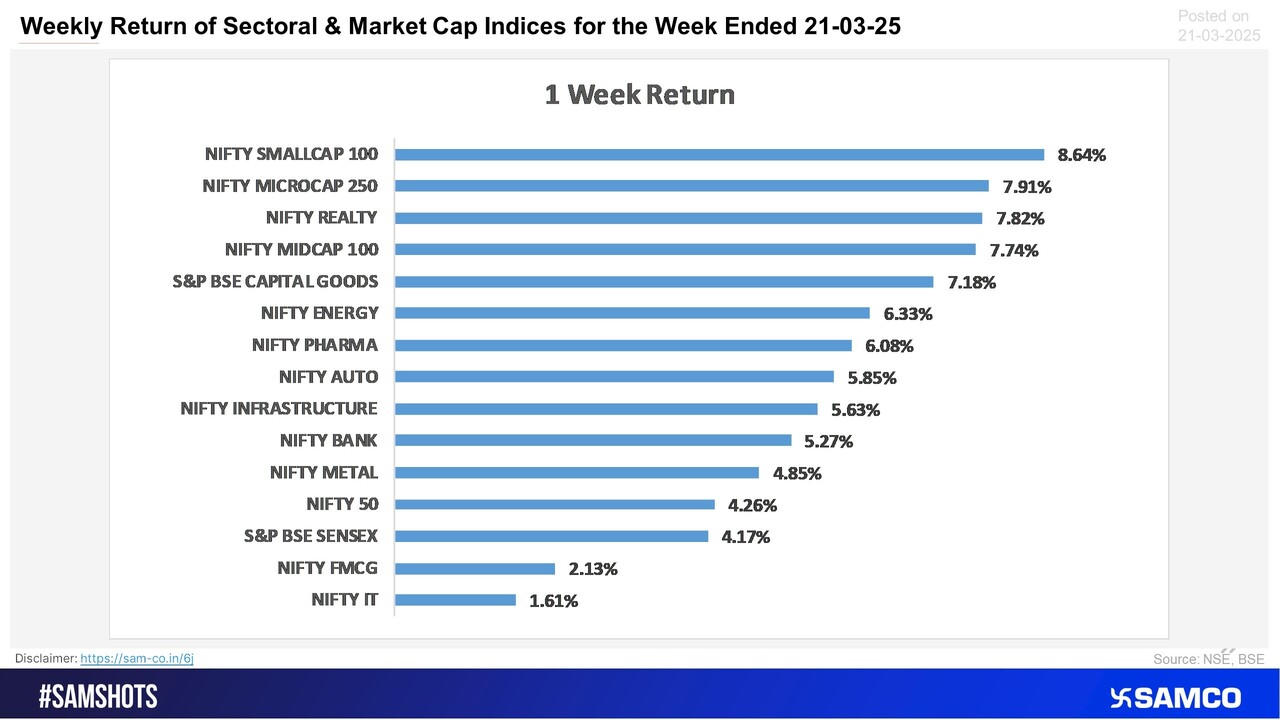
The Nifty 50 ended the week 4.26% higher at 23,350. All major sectoral indices ended the week on a positive note with Nifty Realty surging the most by 7.82%.
Scroll down to understand more of such market news and perspectives for the week gone by in easily understandable charts.
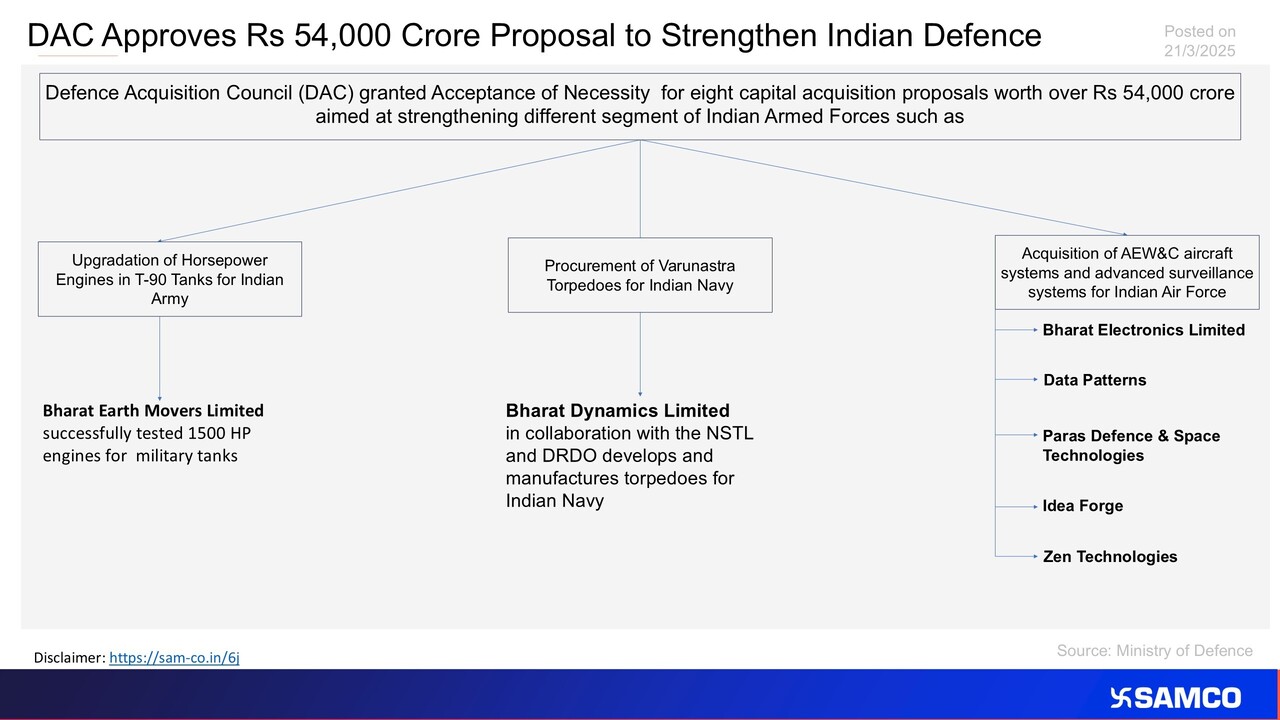
The chart displays the implication of the capital acquisition proposal on Indian Defence stocks.


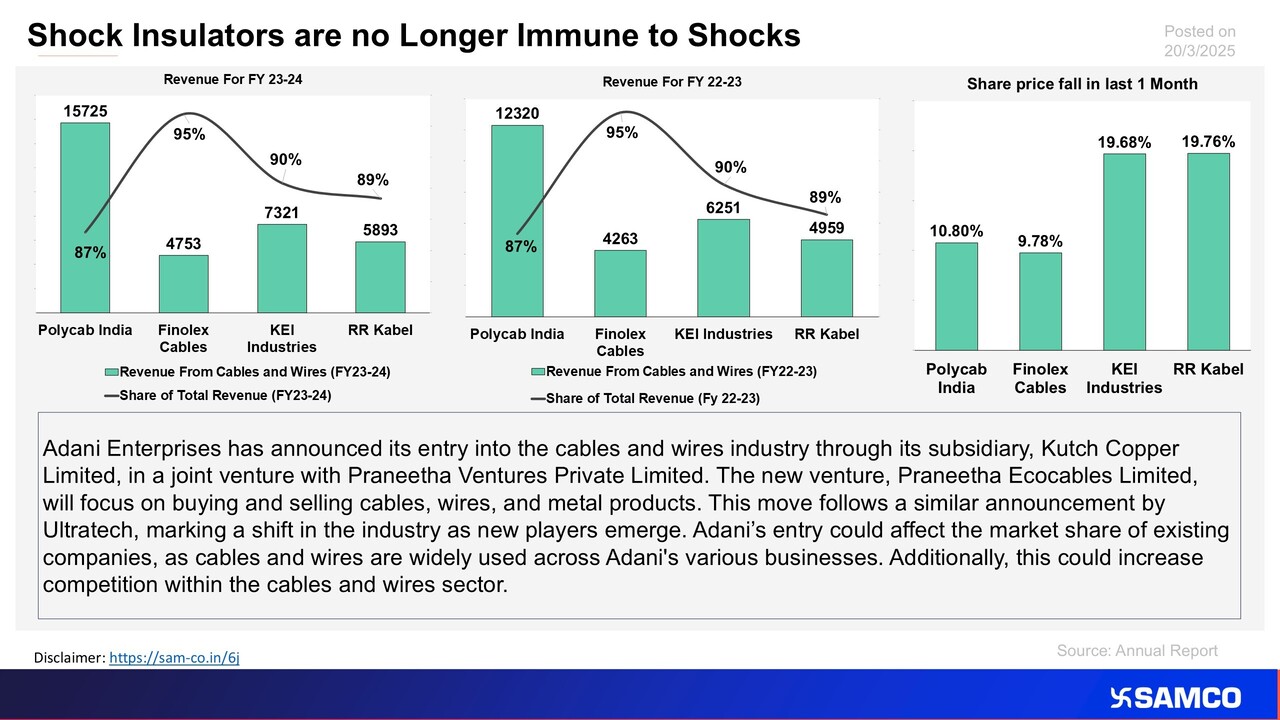
The chart explains the impact on cable and wire stocks due to the entry of Adani Enterprises in the C&W sector.
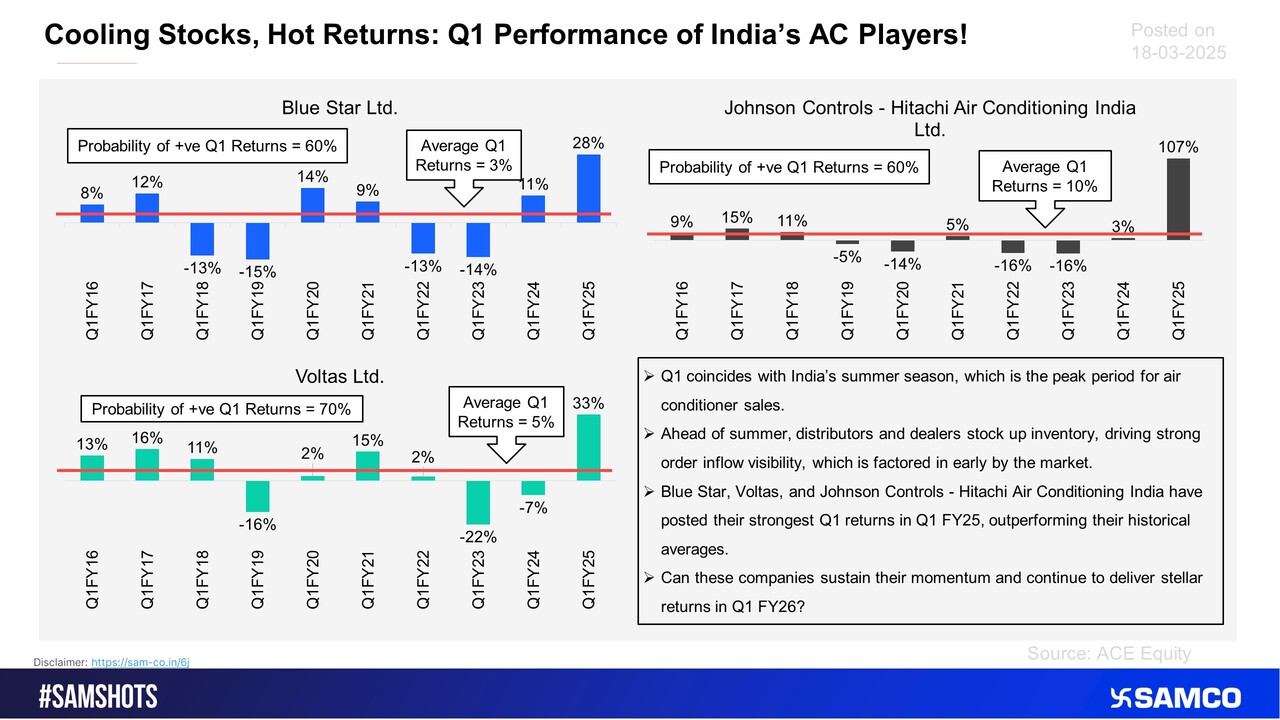
The chart presents the first-quarter (Q1) returns of three major Indian air conditioner companies Blue Star, Voltas, and Johnson Controls - Hitachi Air Conditioning India Ltd. across the past ten financial years.
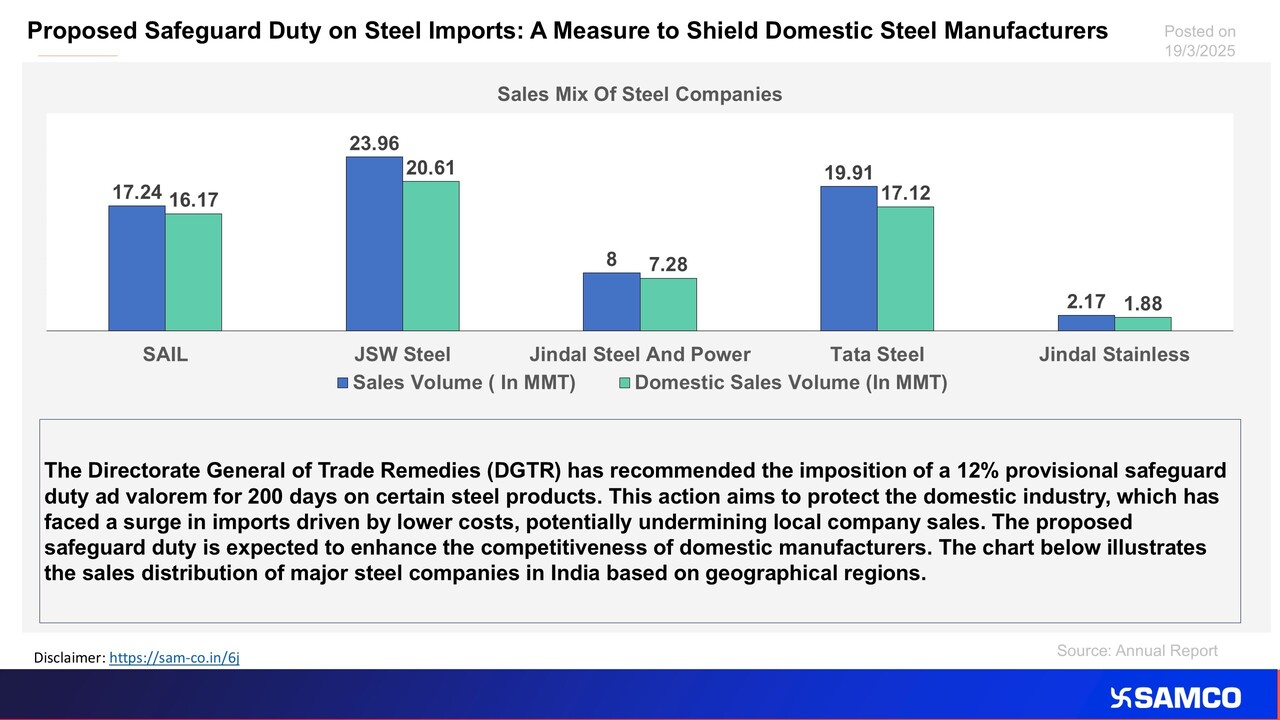
The chart displays the potential benefit for Indian steel makers due to safeguard duty.
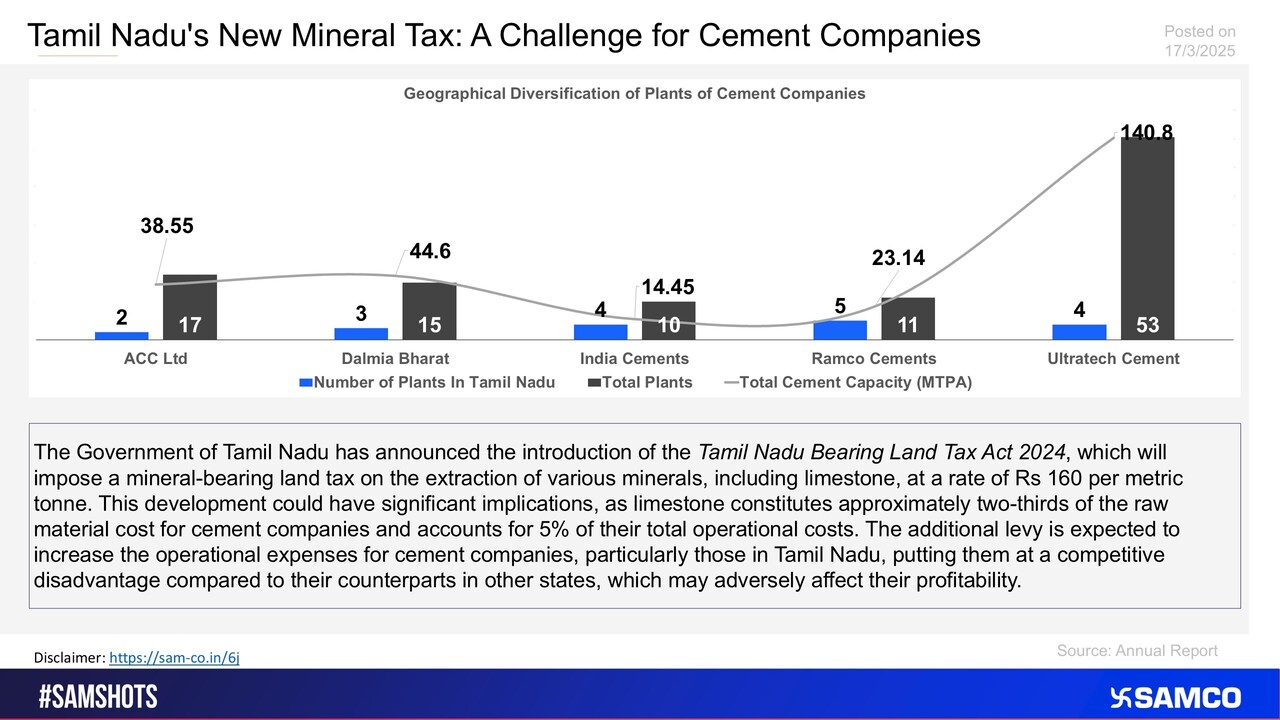
The chart analyses the effect of the New Mineral Tax Act by the Tamil Nadu Government on Cement Stocks.
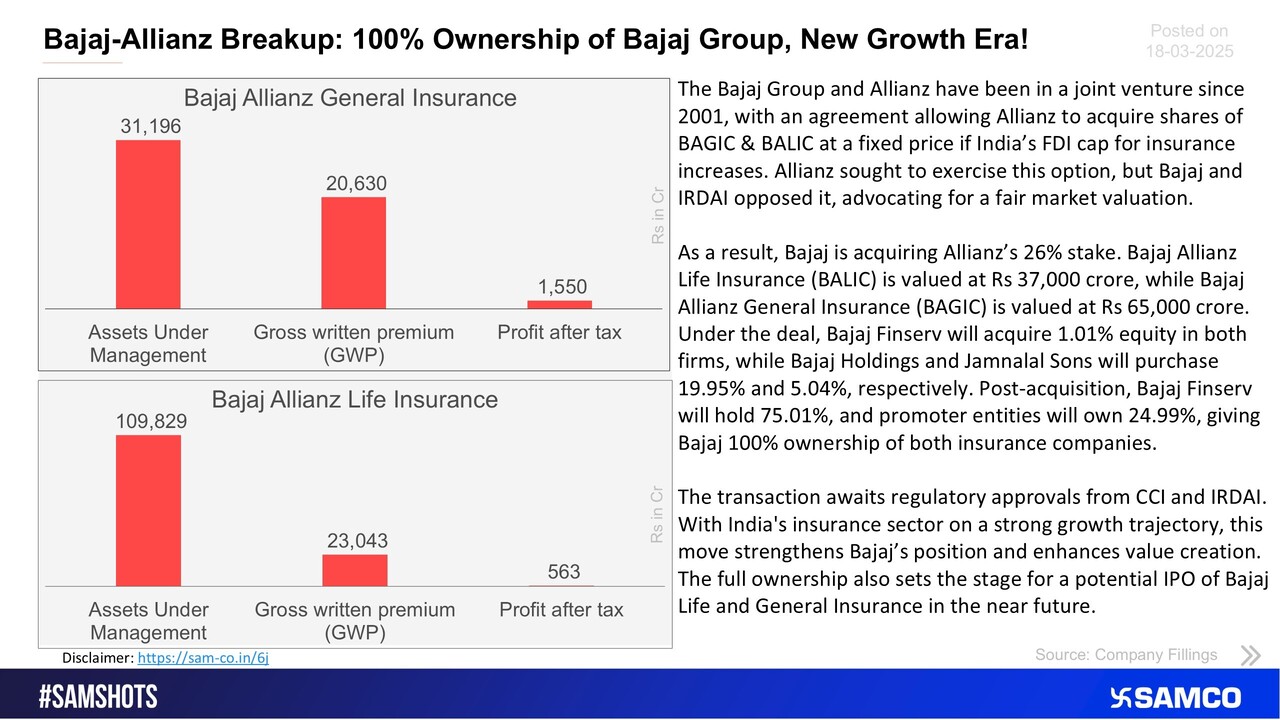
The below chart explains the Bajaj & Allianz group ownership changes in the Bajaj group Life & General Insurance companies.
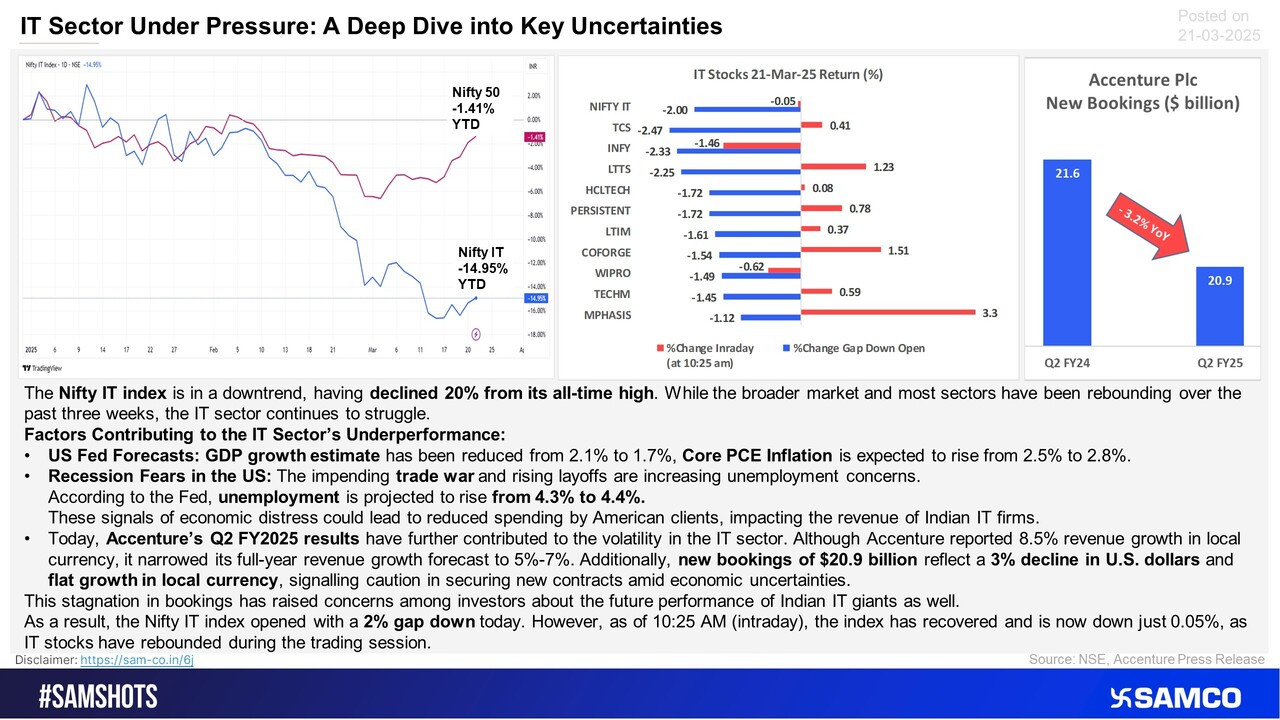
IT stocks are facing challenges, key factors causing headwinds are outlined below.
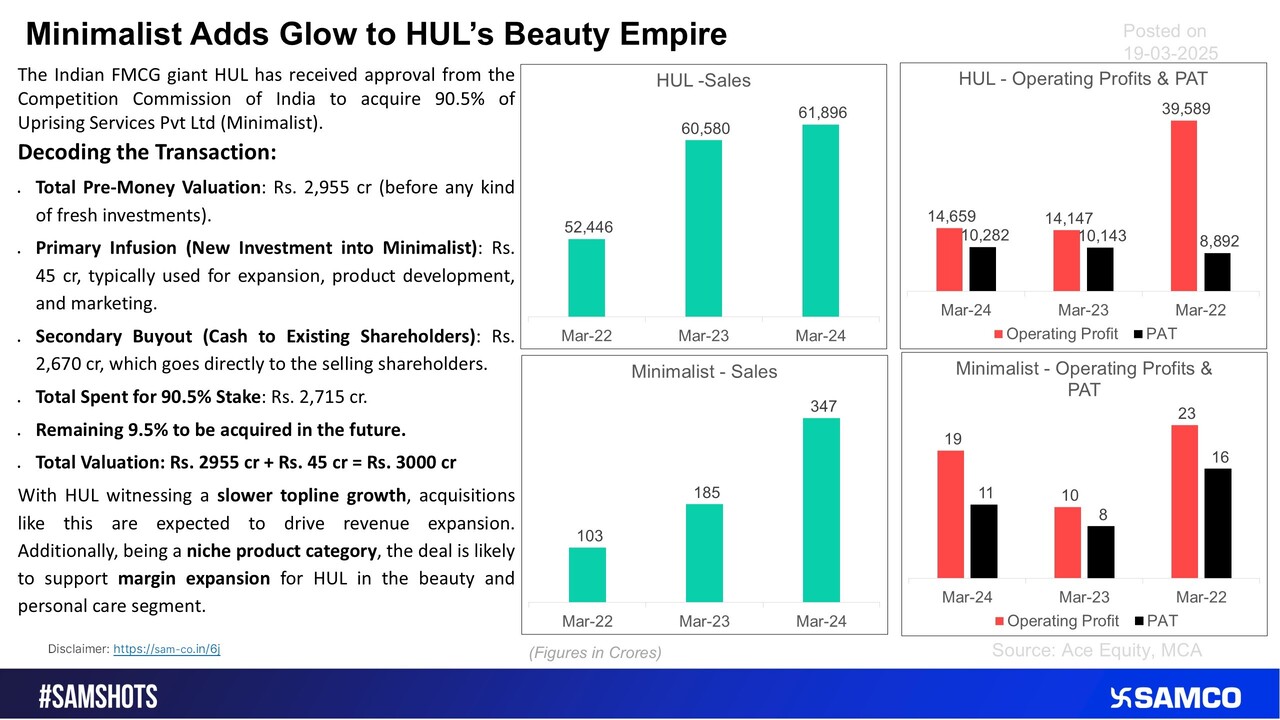
The accompanying chart elaborates on the acquisition of Minimalist by HUL.
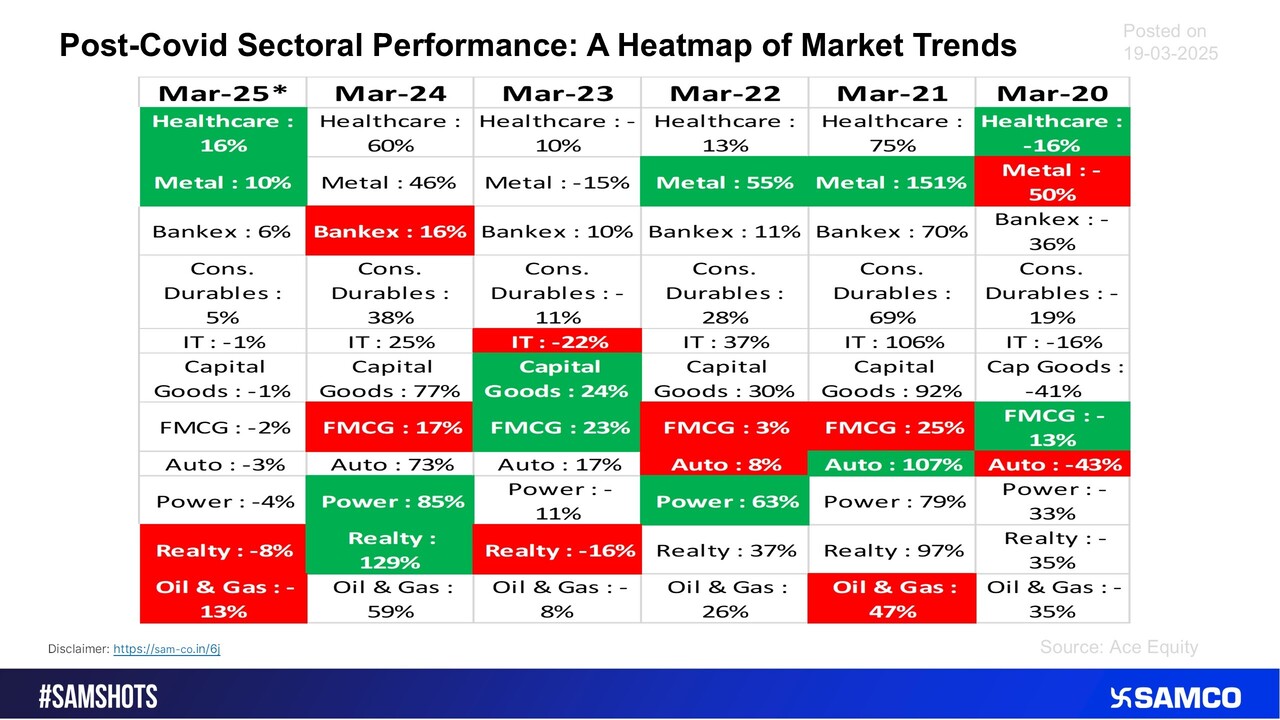
Here’s how sectors have performed post-COVID.
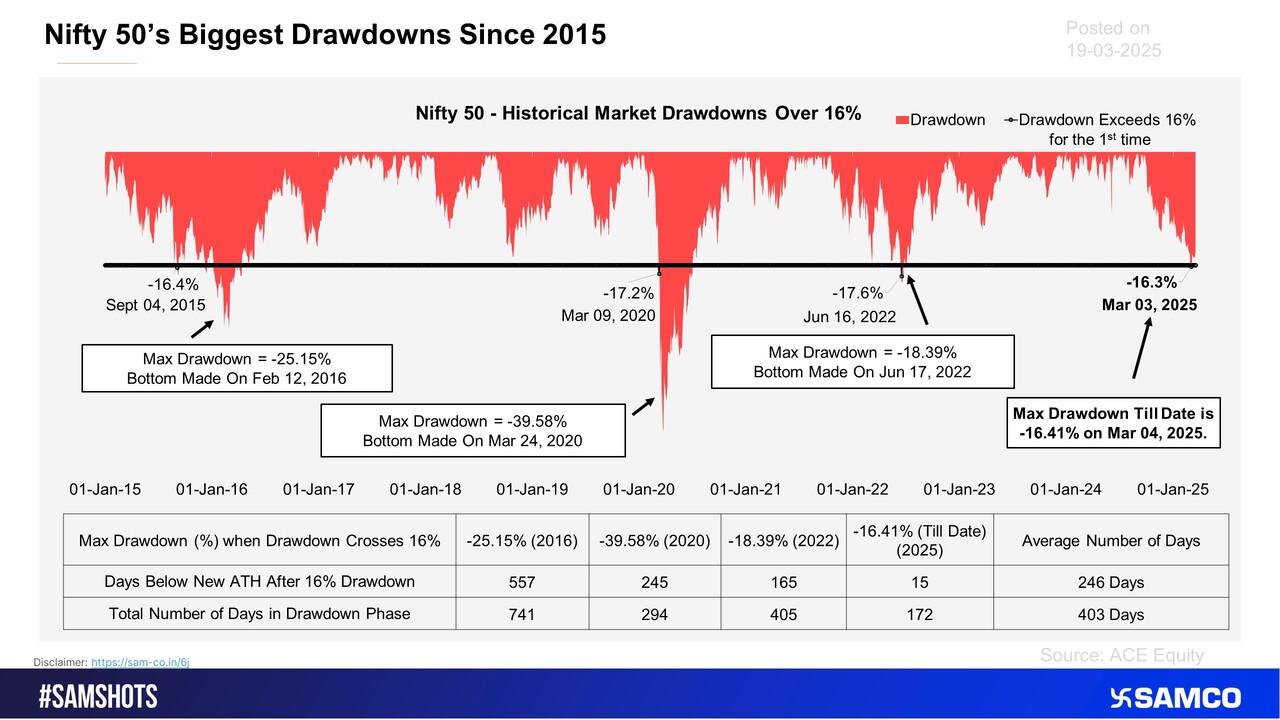
The Nifty 50 recorded a 16% drawdown for the first time on March 4, 2025, since its most recent all-time high on September 27, 2024. Historical data suggests that the index is likely to take time before touching a new all-time high.
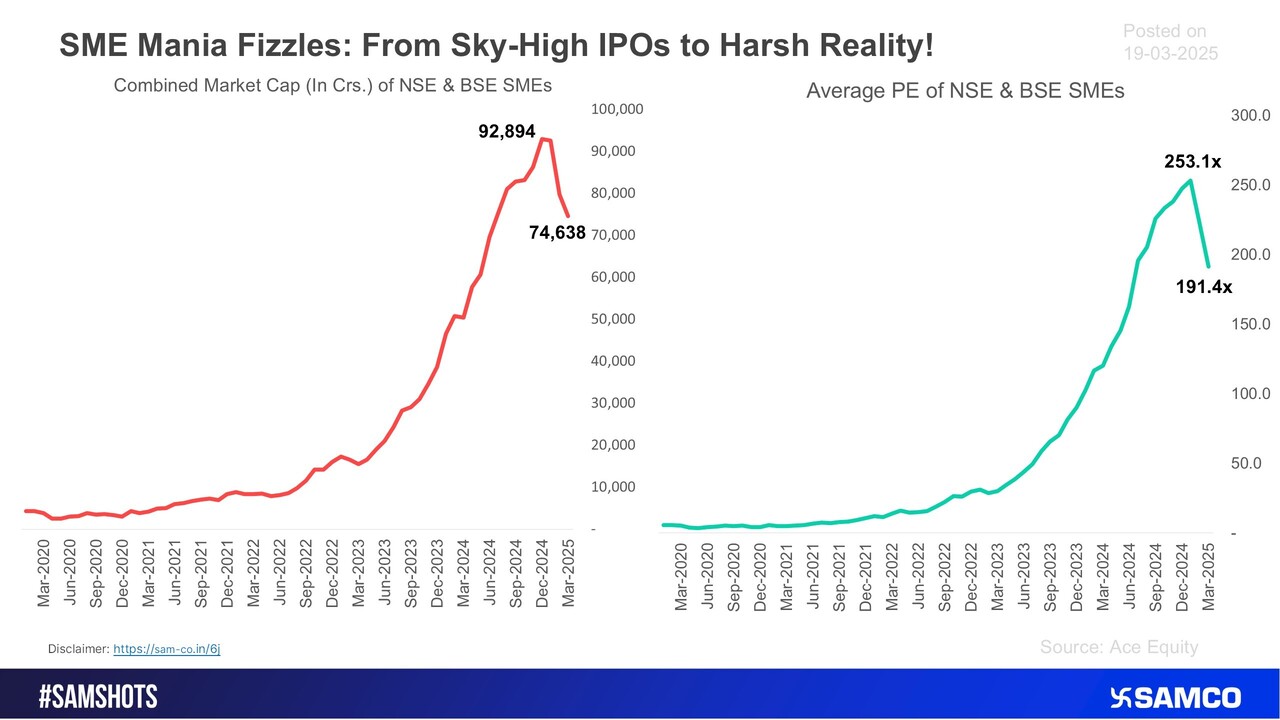
The below chart showcases the meltdown of froth in SMEs.
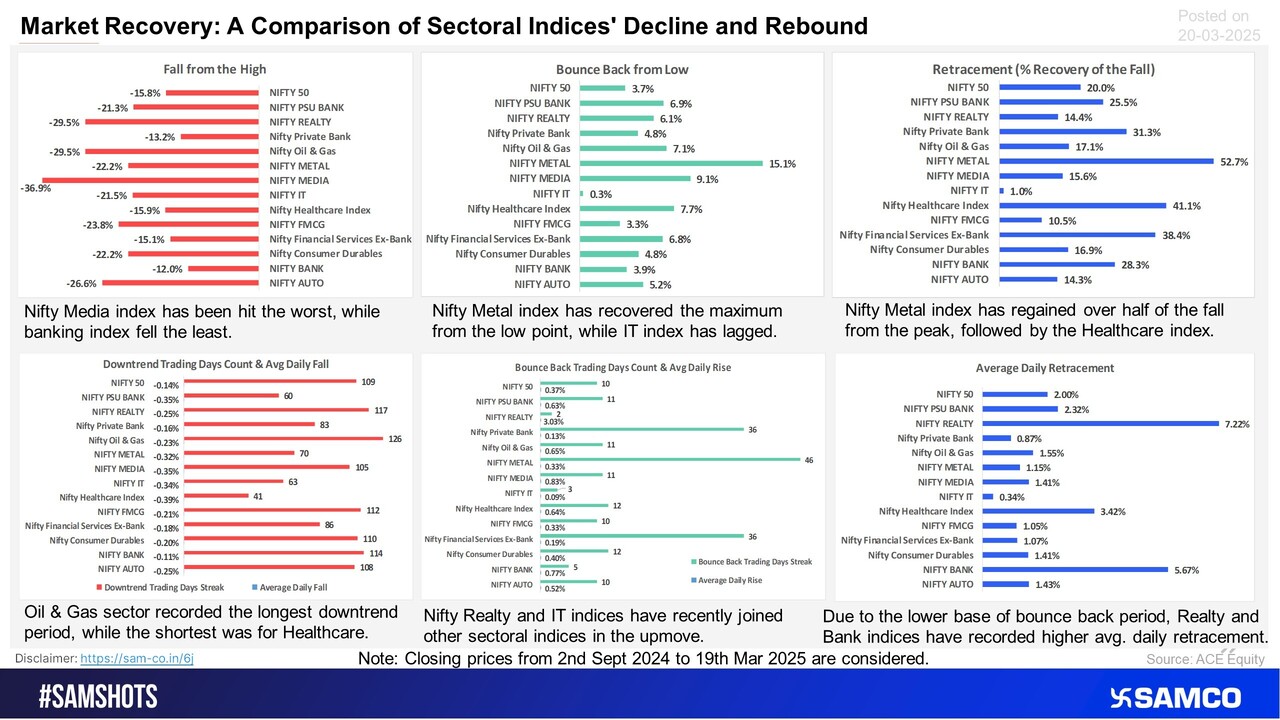
Take a look below to compare the performance of different sectors during the recent downturn and subsequent rebound.
All marketcap based and sectoral indices close in the green, the Smallcap index rebounds the most.
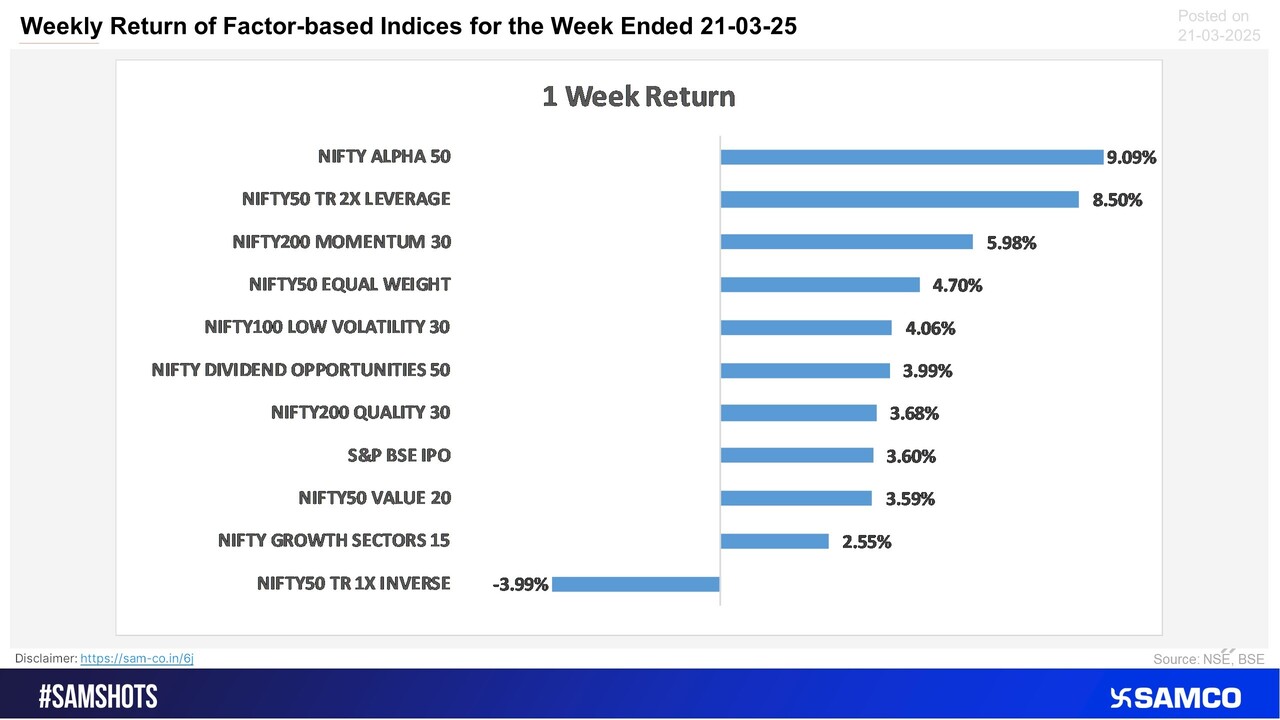
As bulls are back in the market, Alpha, Leverage and Momentum factors shine.
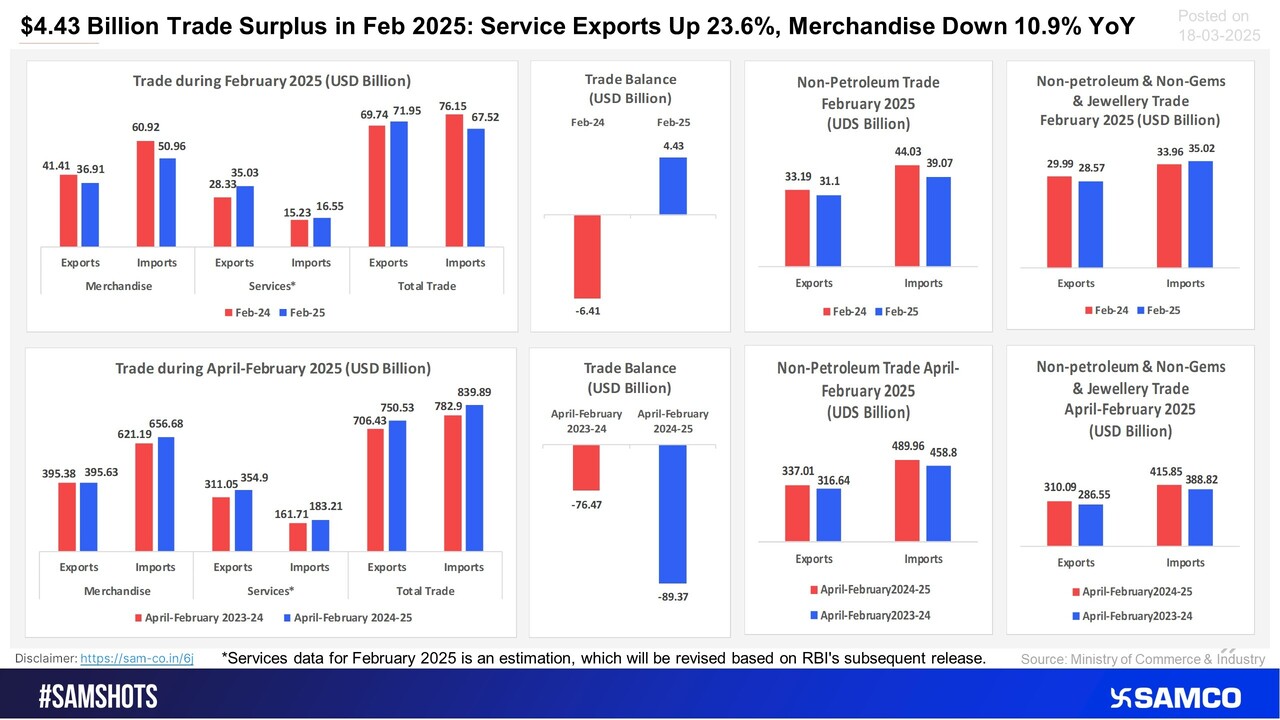
Highlights of India’s trade surplus for February 2025 are presented below.
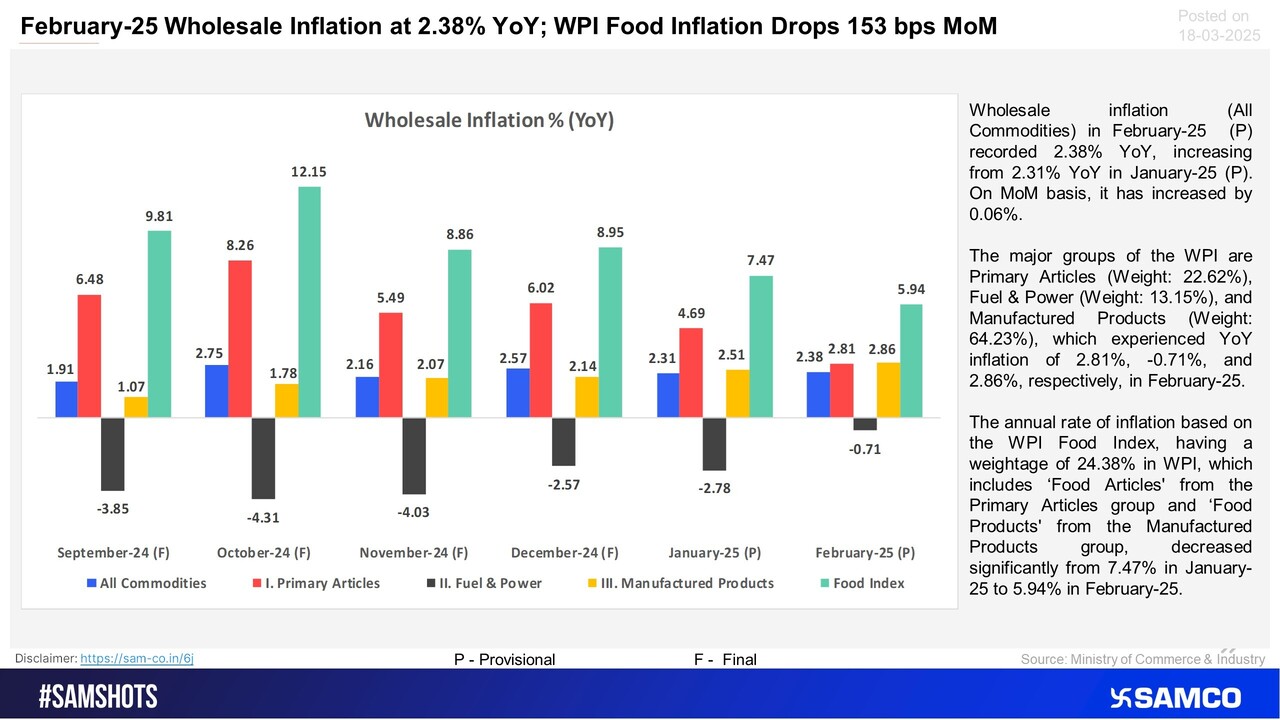
WPI increases marginally, while WPI food inflation eases substantially. Take a look at the chart below to learn more.
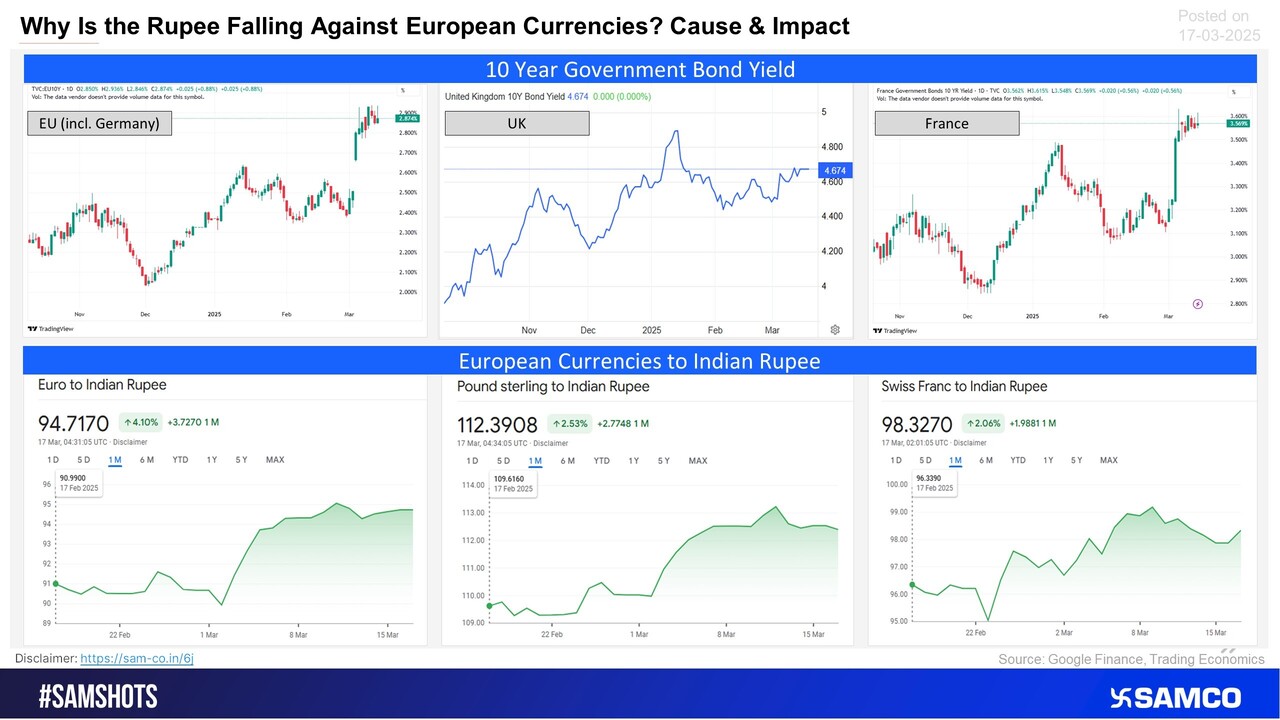
Analysing rising bond yields in European countries and its impact on the Indian Rupee.
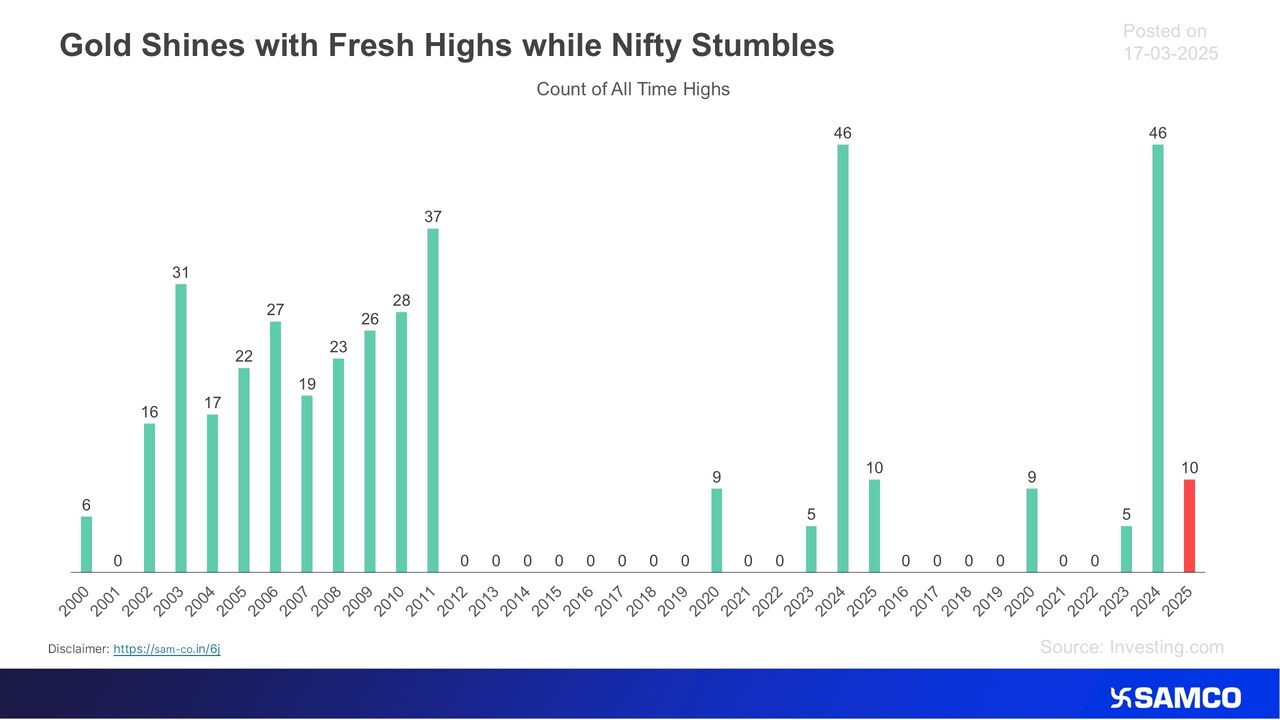
Here’s the chart presenting the number of yearly highs of Gold.
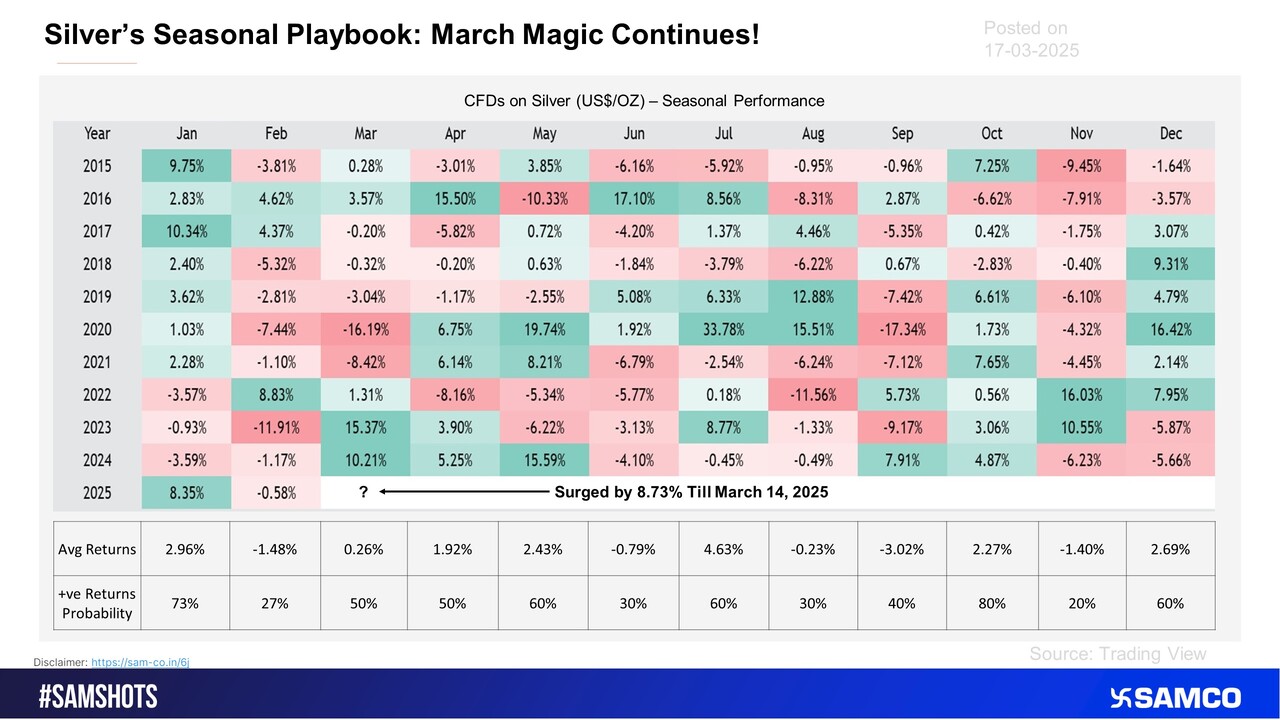
Over the past two years, March has been particularly strong, with silver posting gains of over 10% each year. Silver has already advanced by more than 8% in the first half of March 2025, underscoring ongoing bullish momentum.
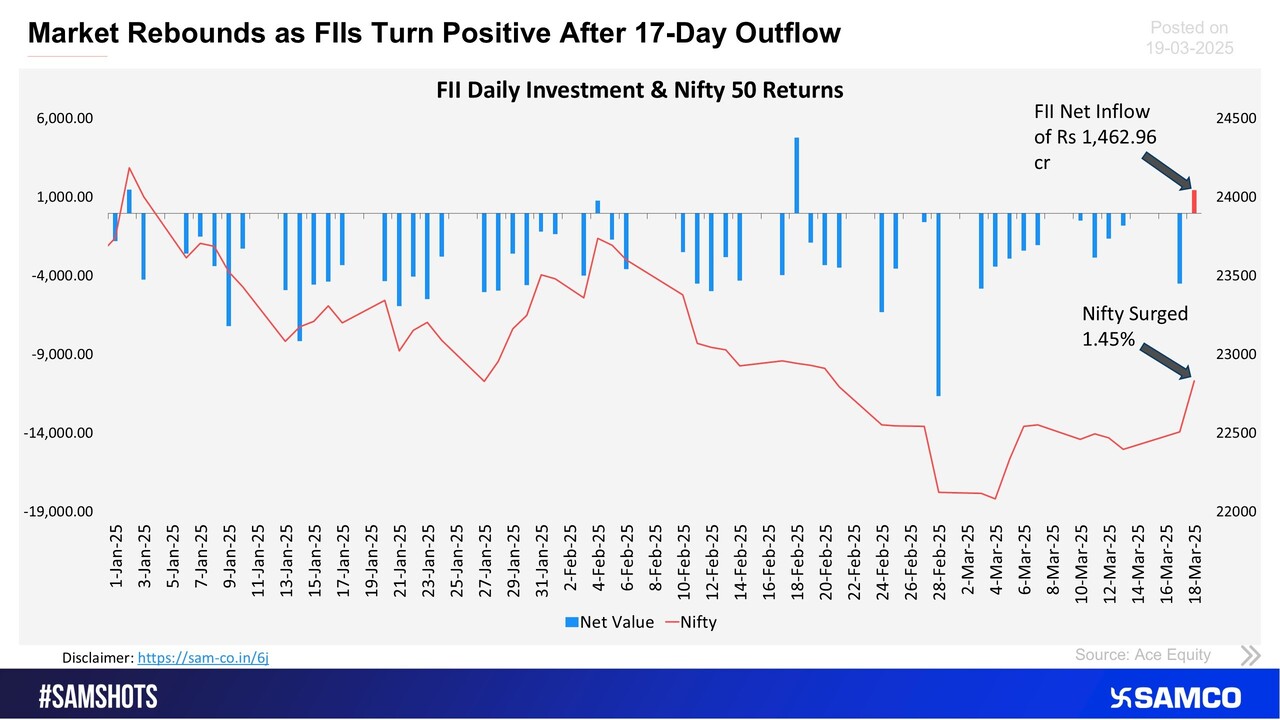
The chart below illustrates FII daily investment flows, highlighting a shift to bullish momentum after a prolonged bearish trend.
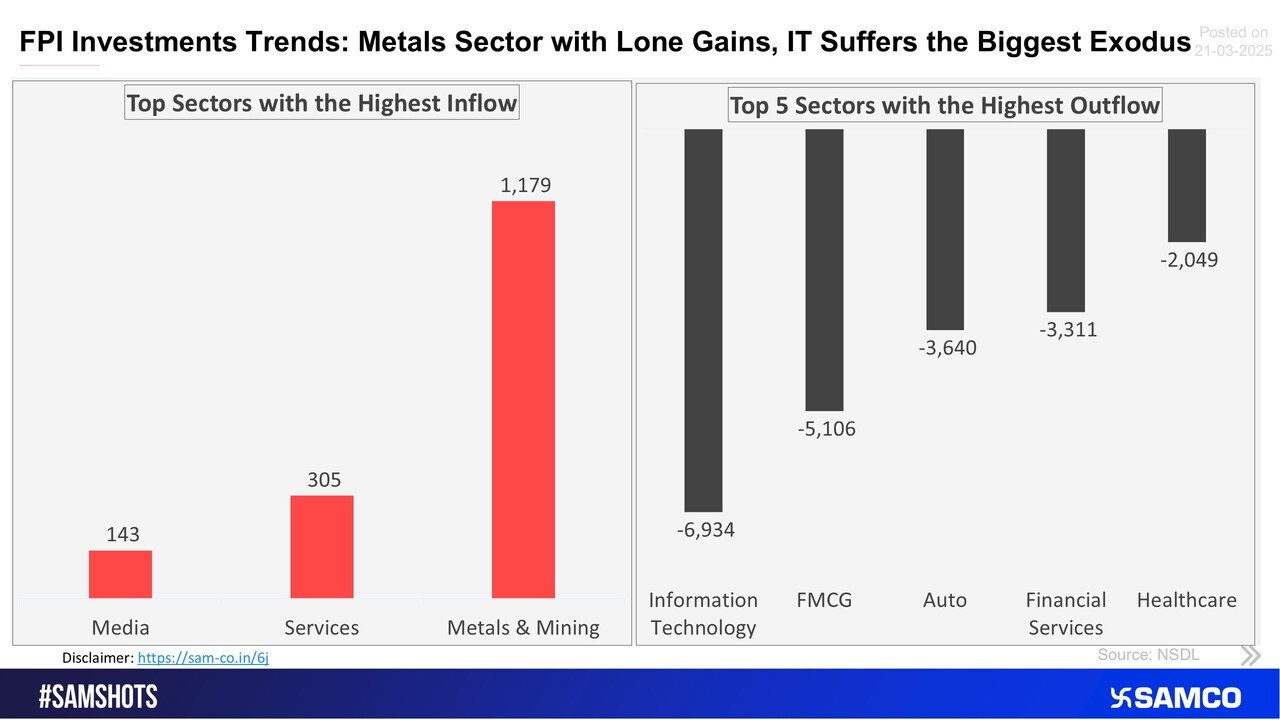
The accompanying chart shows the top 5 sectors that witnessed FPI’s highest inflow and outflow in the latest quarter.
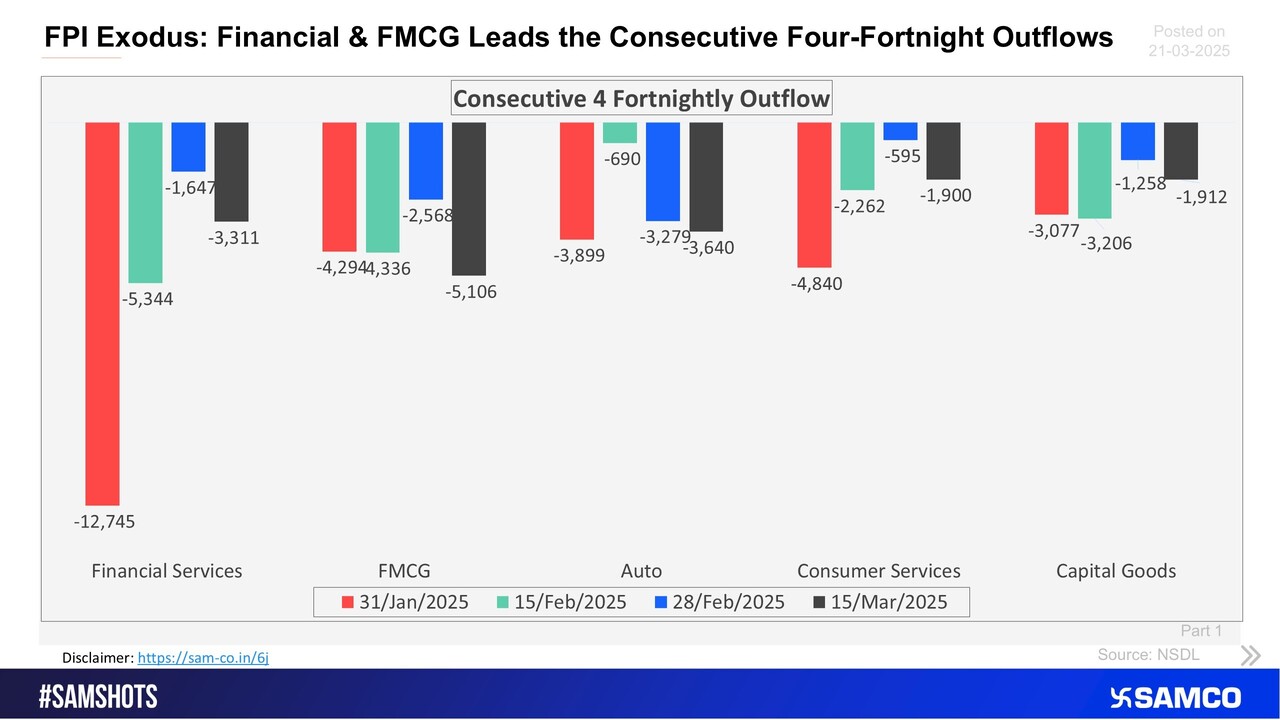
The sectors shown in the chart have witnessed consecutive 4 fortnightly outflows of FPI money (Part 1).
The sectors shown in the chart have witnessed consecutive 4 fortnightly outflows of FPI money (Part 2).
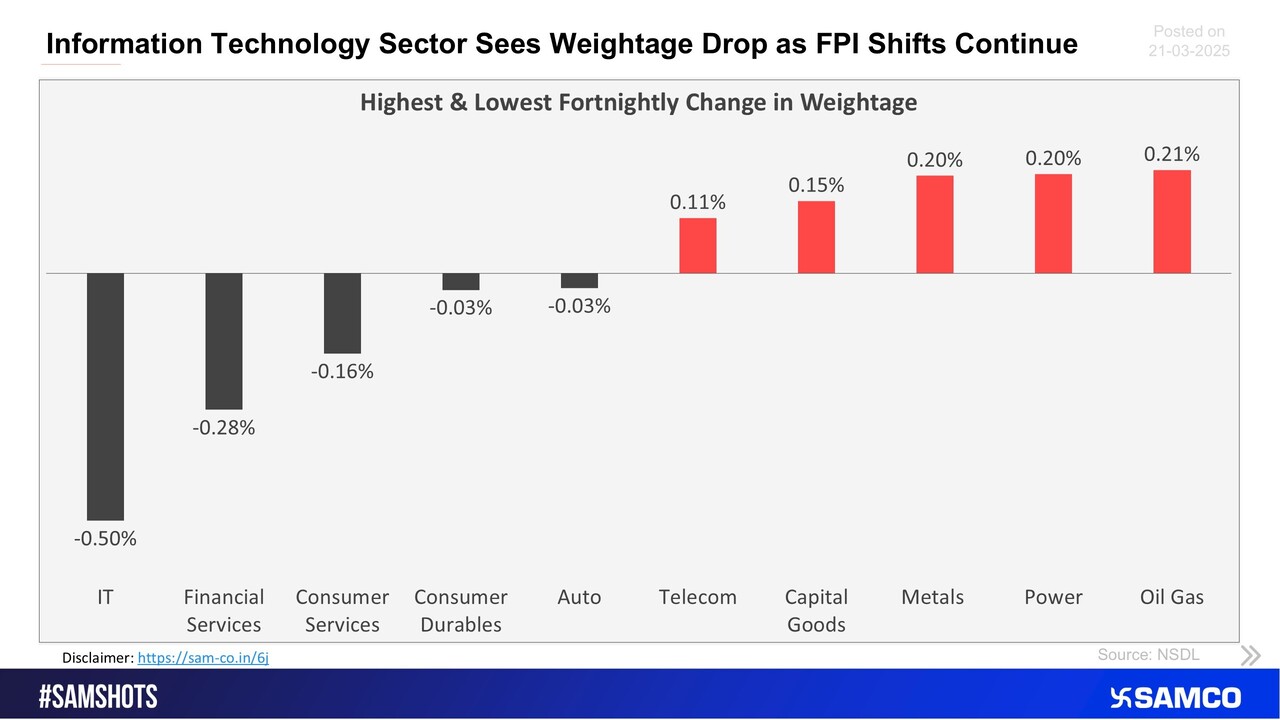
The chart below displays sectors that witnessed the highest and lowest change in the weightage of sectoral FPI holdings to the total FPI holdings compared to the previous fortnight.
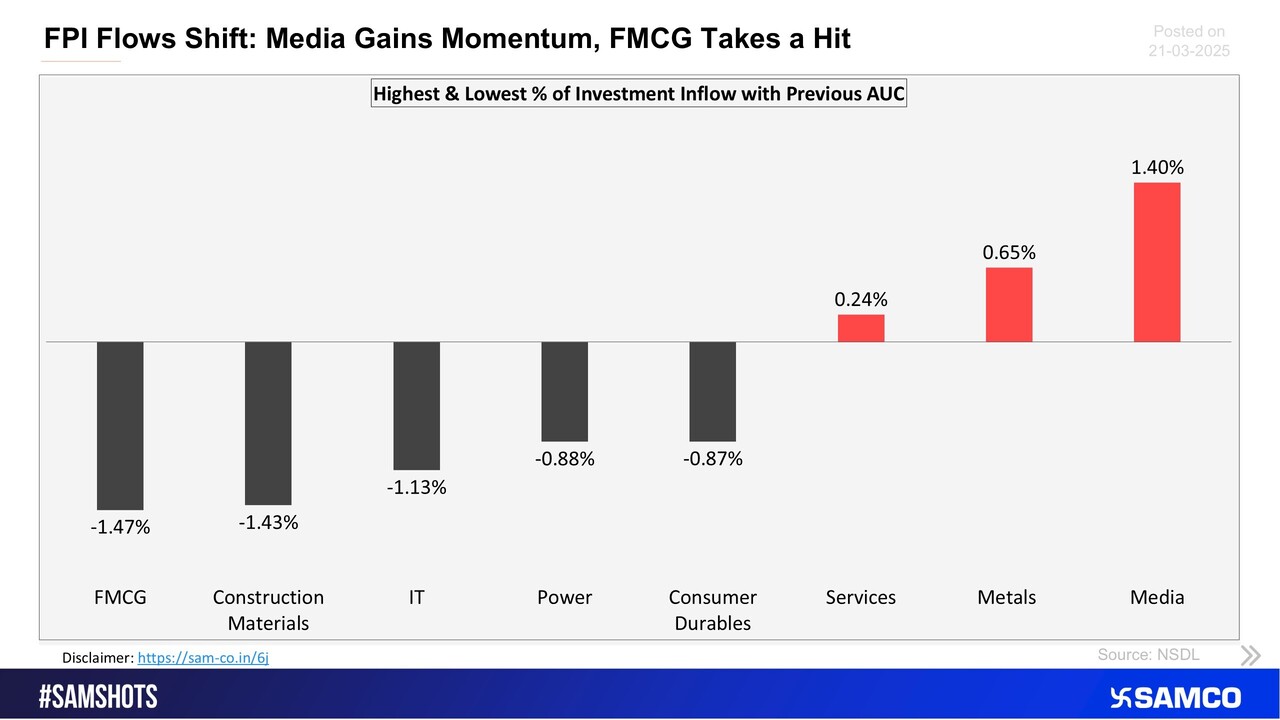
The below chart presents the highest & lowest percentage inflow of investment in the latest fortnight compared to the previous period AUC (Asset Under Custody) of FPI.
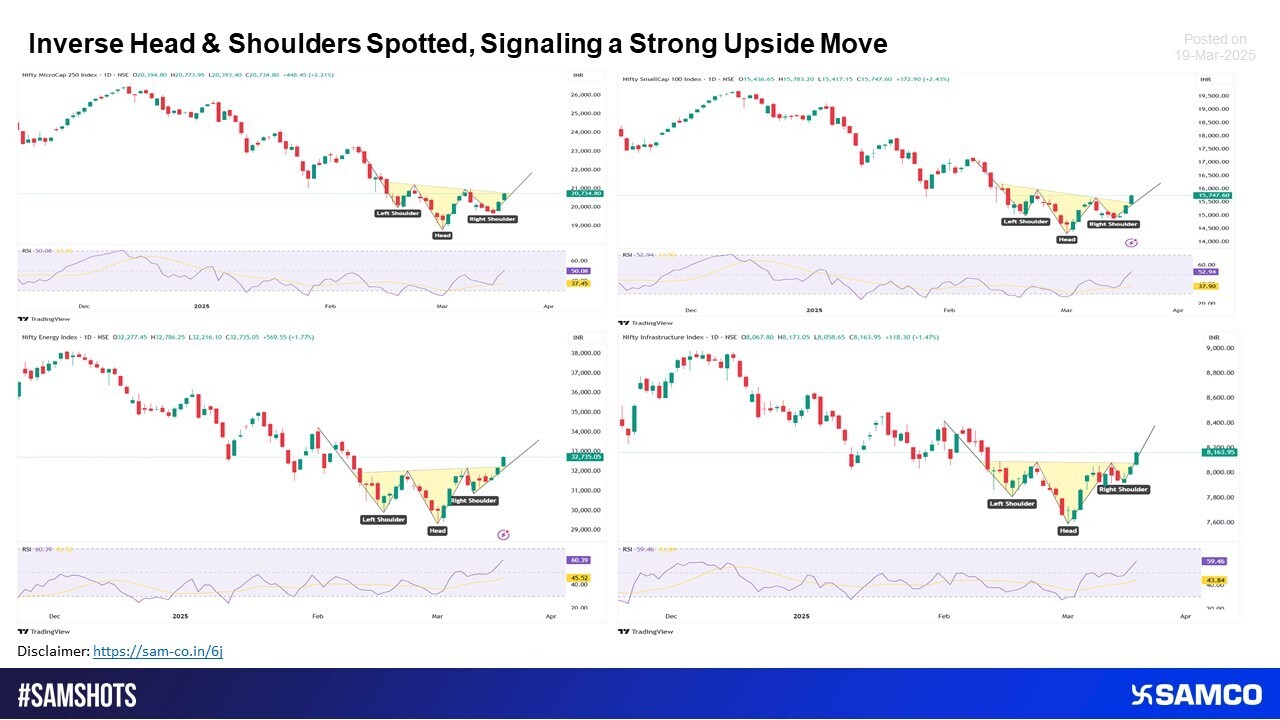
Inverse Head & Shoulders Formation Unfolds, Paving the Way for a Robust Upside Surge.
Gold Shatters Resistance, Surging Past the Flag Formation.
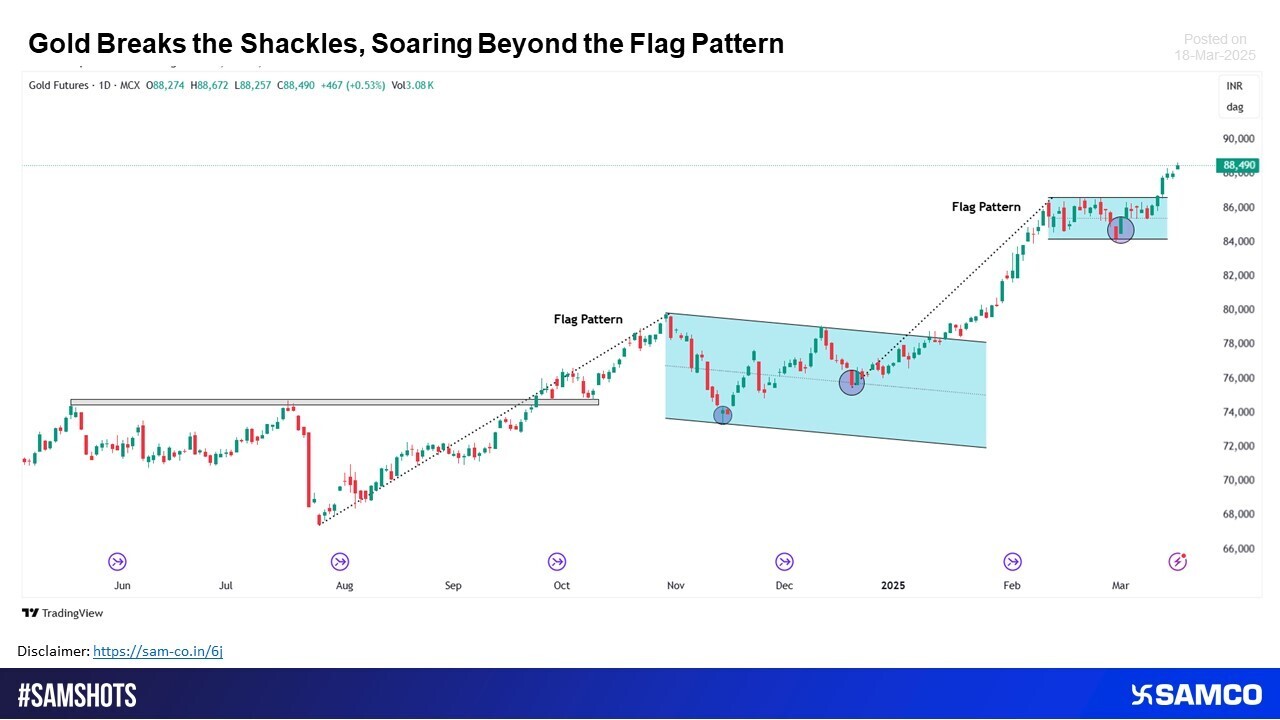
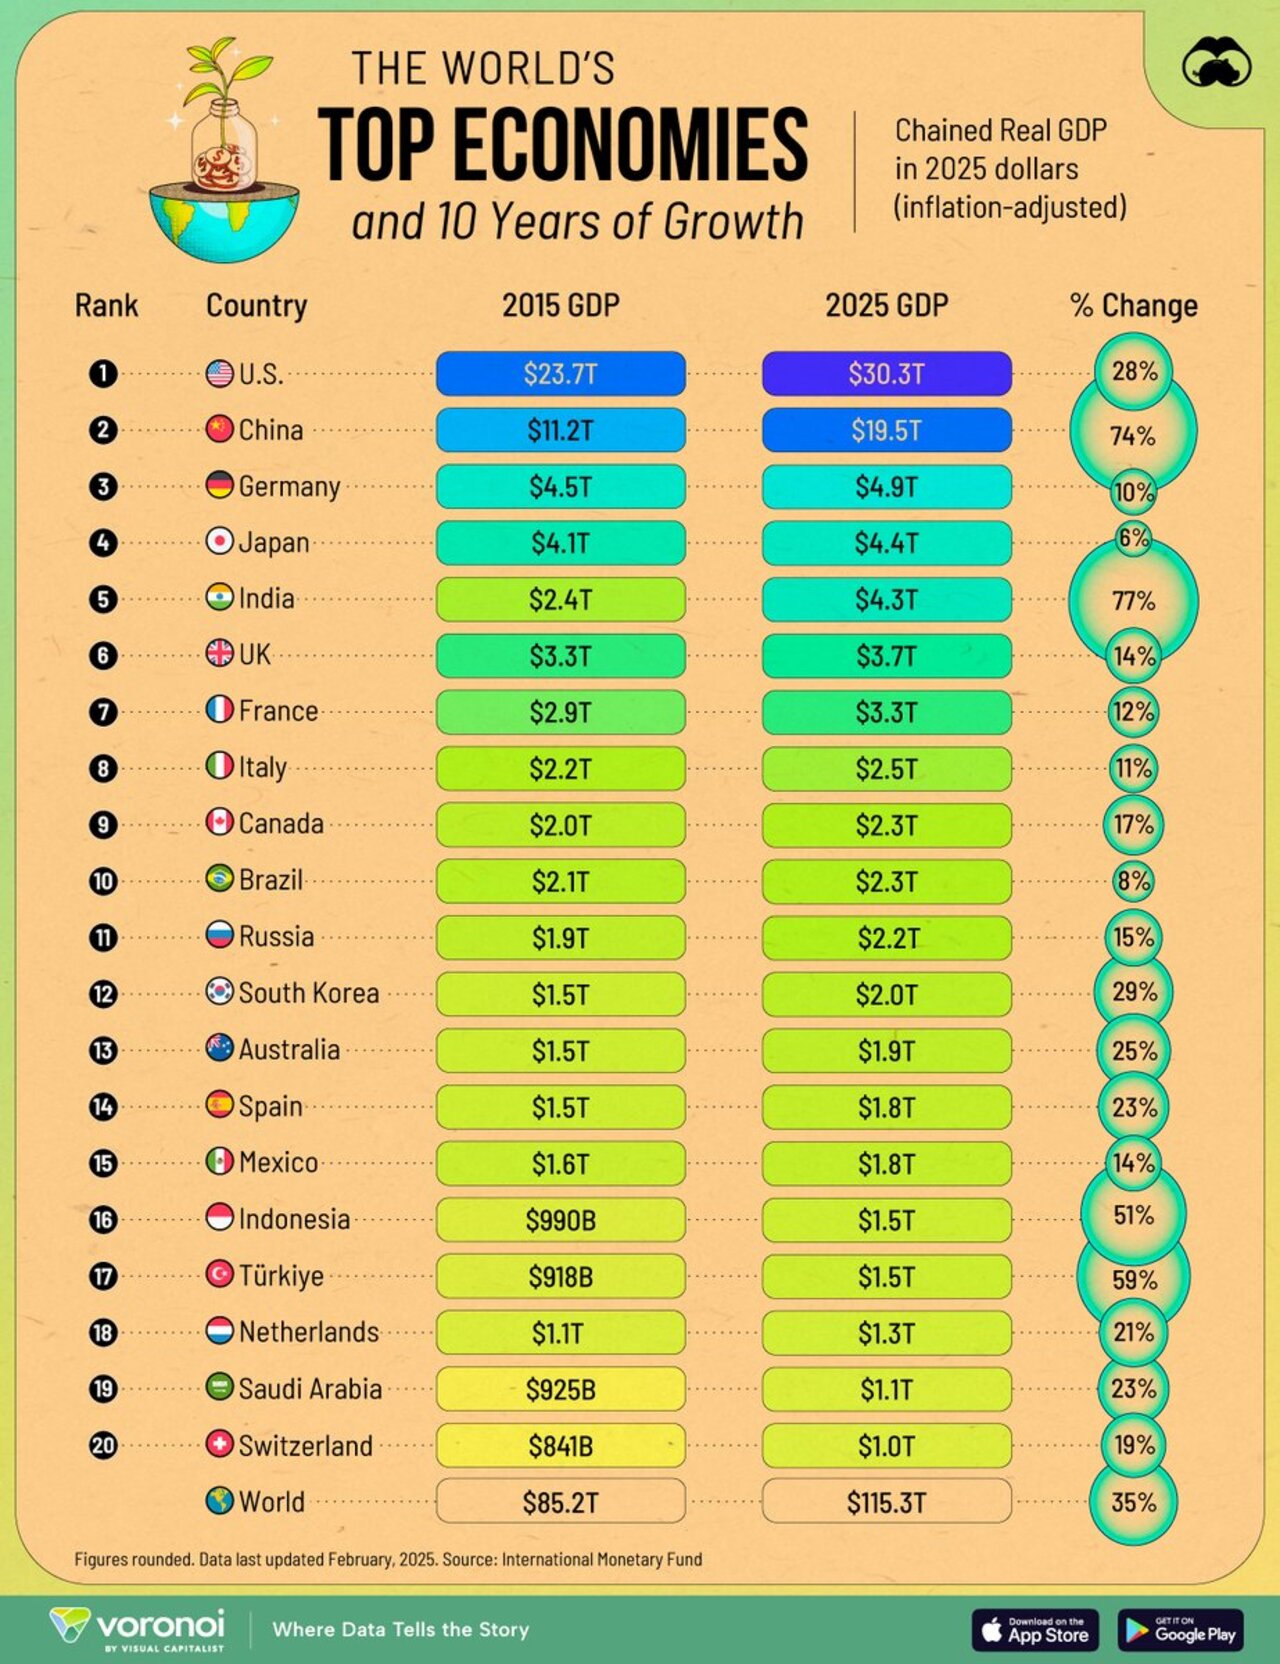
Image Source: @VisualCap (Twitter)
 Easy & quick
1. Register on SCORES portal
2. Mandatory details for filling complaints on SCORES
Name | PAN | Address | Mobile | Number | E-mail ID
3. Benefits
Effective Communication
Speedy redressal of the grievances
