Indian markets remained volatile throughout the week, with small-cap and mid-cap stocks stealing the spotlight by outperforming broader indices.
The Q3FY25 earnings season wrapped up with a varied performance across sectors. Pharma and Realty stood out with solid gains, supported by strong demand and operational efficiencies. On the flip side, the Energy and Infrastructure sectors faced challenges, struggling to maintain income growth.
Meanwhile, gold and silver continued their upward trend in the commodities space, reflecting global uncertainty and investor preference for safe-haven assets. With earnings season now behind us, market focus is shifting toward macroeconomic indicators, policy cues, and global market trends, which could set the tone for the coming weeks.
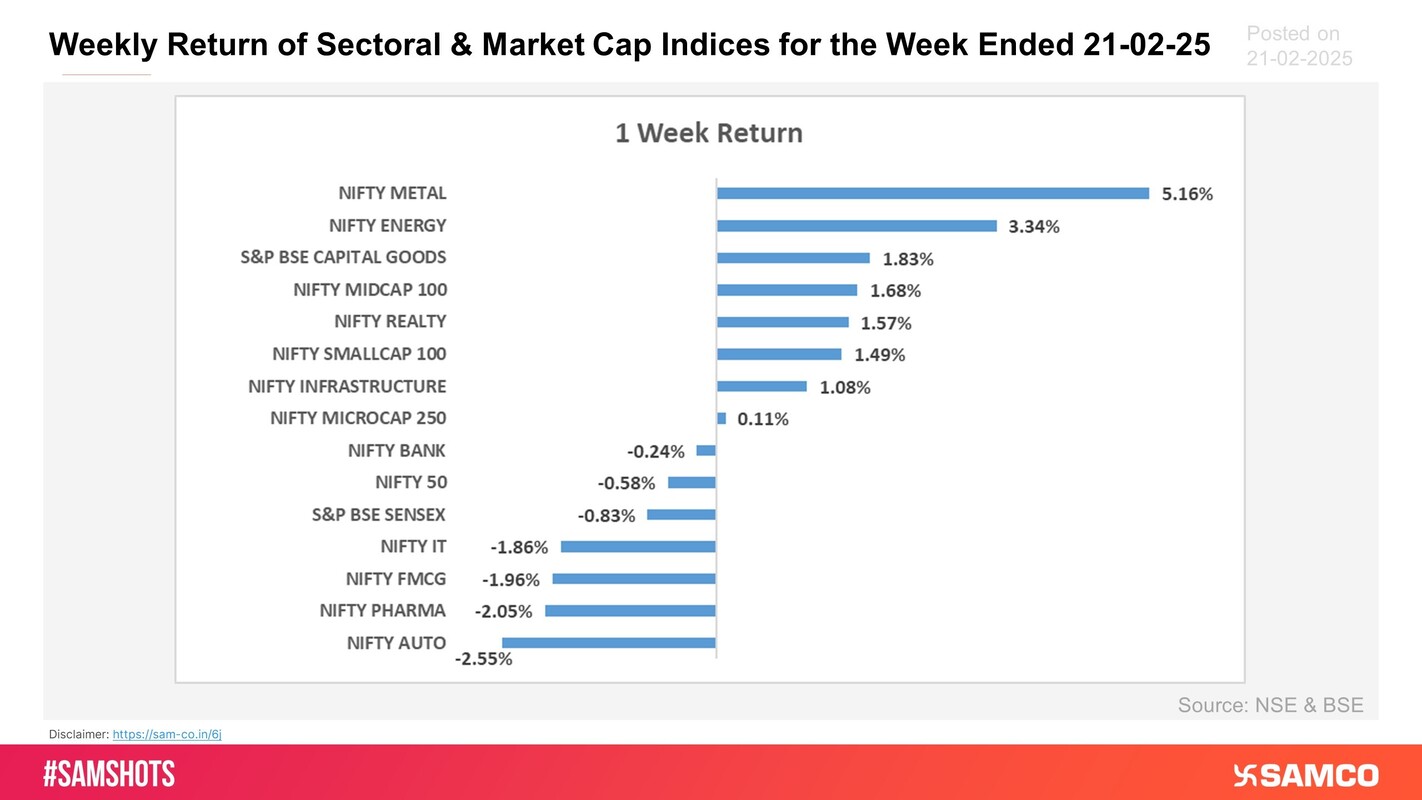
The Nifty 50 ended the week 0.58% lower at 22,796. Nifty Metal and Nifty Energy surged the most with gains of 5.16%, and 3.34% respectively.
Scroll down to understand more of such market news and perspectives for the week gone by in easily understandable charts.
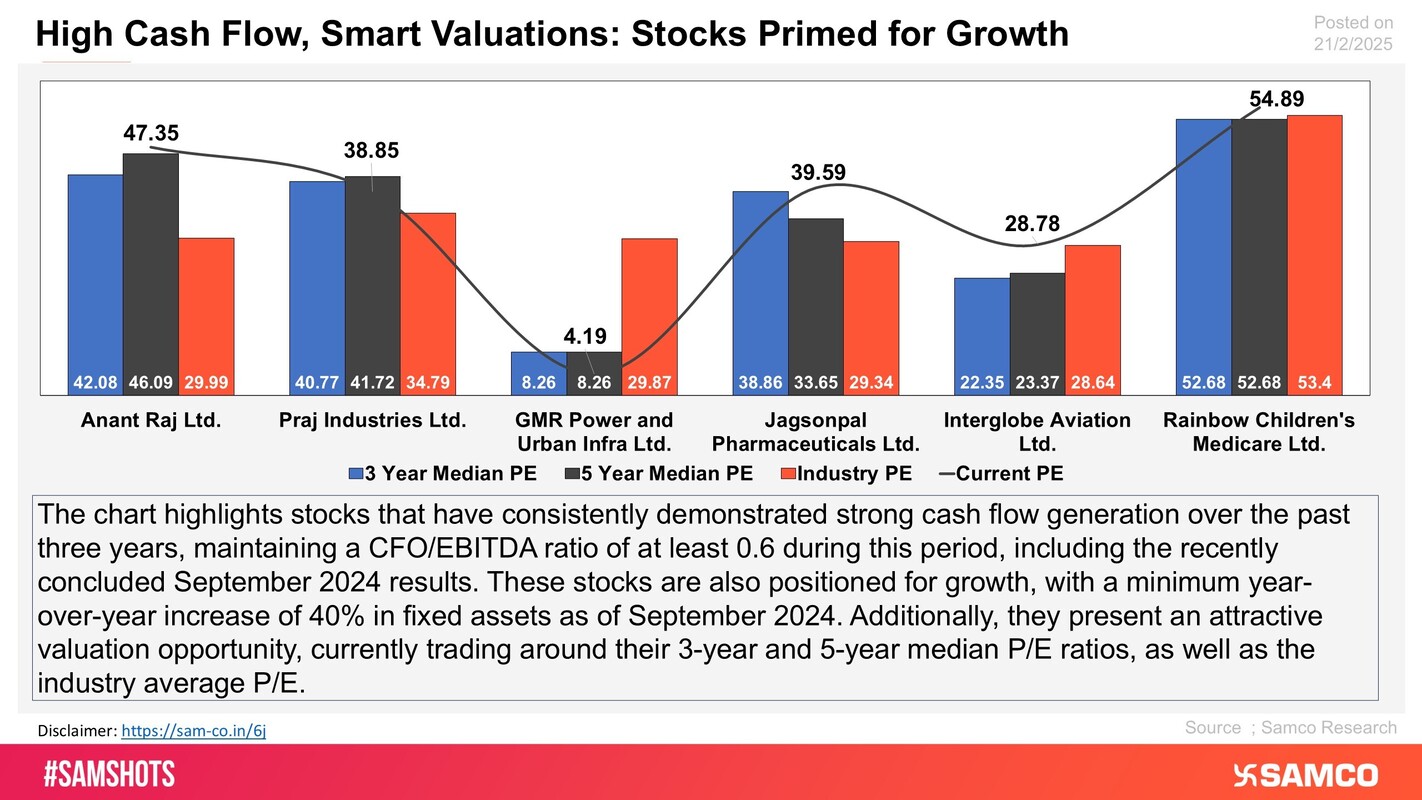
The chart highlights financially strong, growth-oriented, and reasonably valued companies.


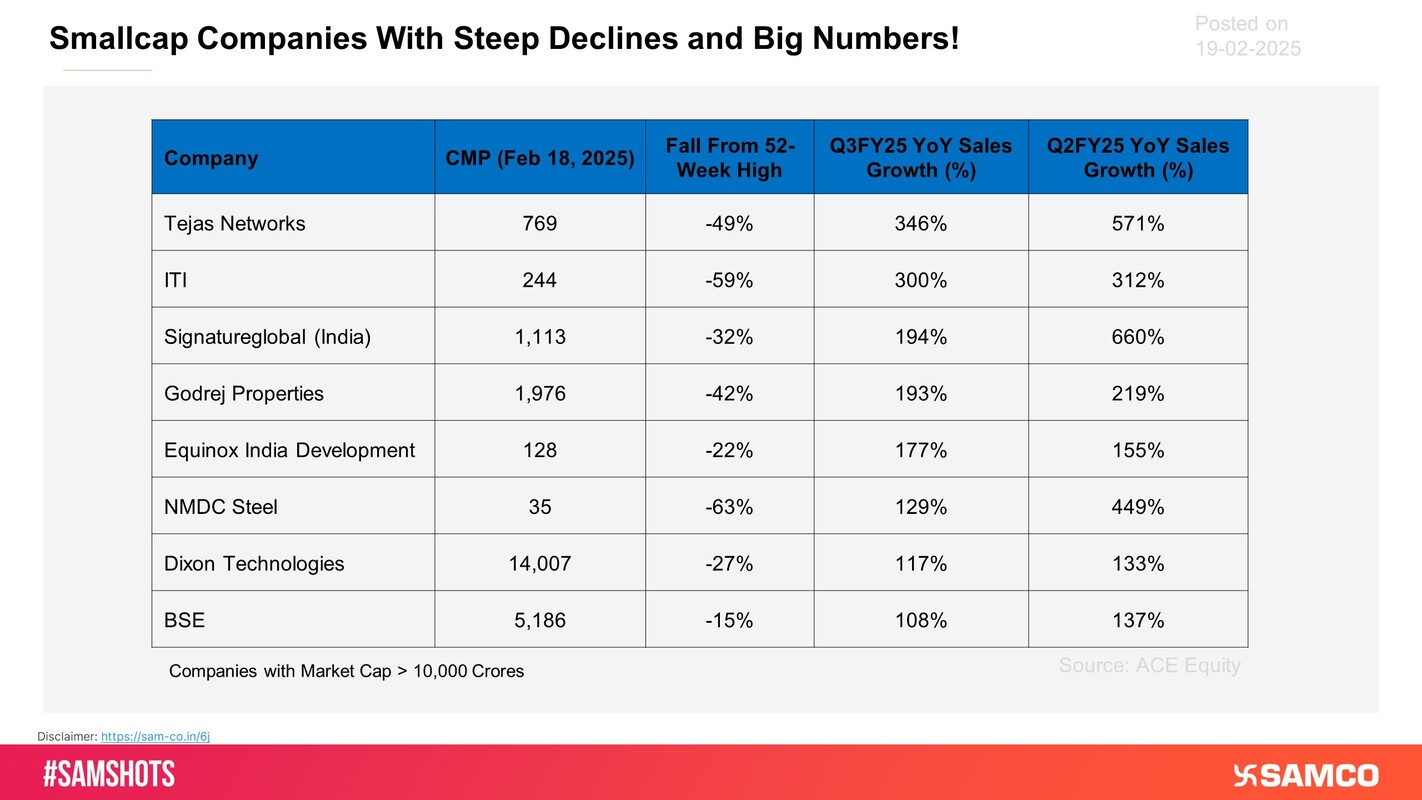
The above table displays small-cap stocks with a market capitalization of at least Rs. 10,000 crores that have witnessed significant corrections from their 52-week highs yet continue to deliver strong year-on-year (YoY) sales growth for the past 2 quarter
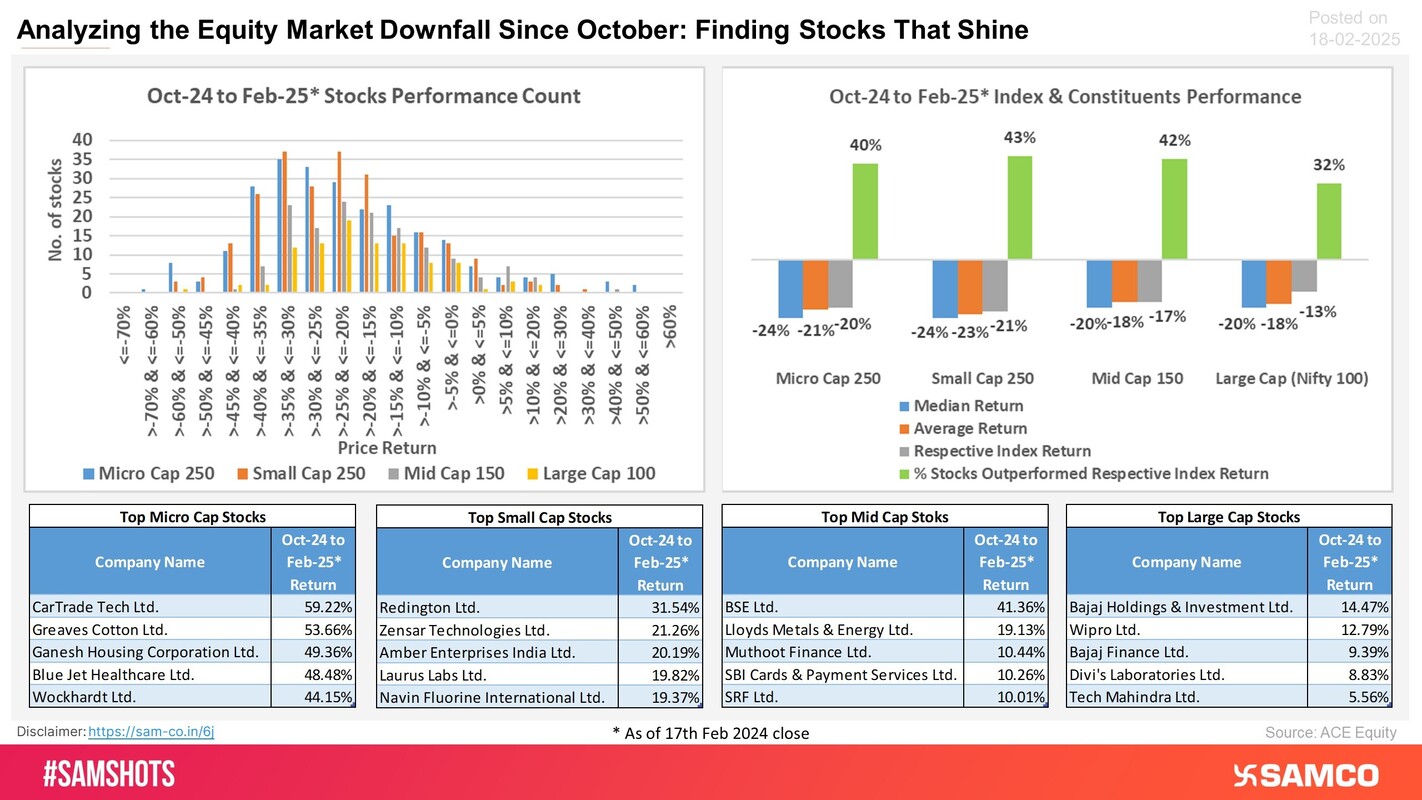
Let’s analyse the market capitalisation-wise count of shares in each return group and discover stocks that provided outperforming returns even amid the bearish market:
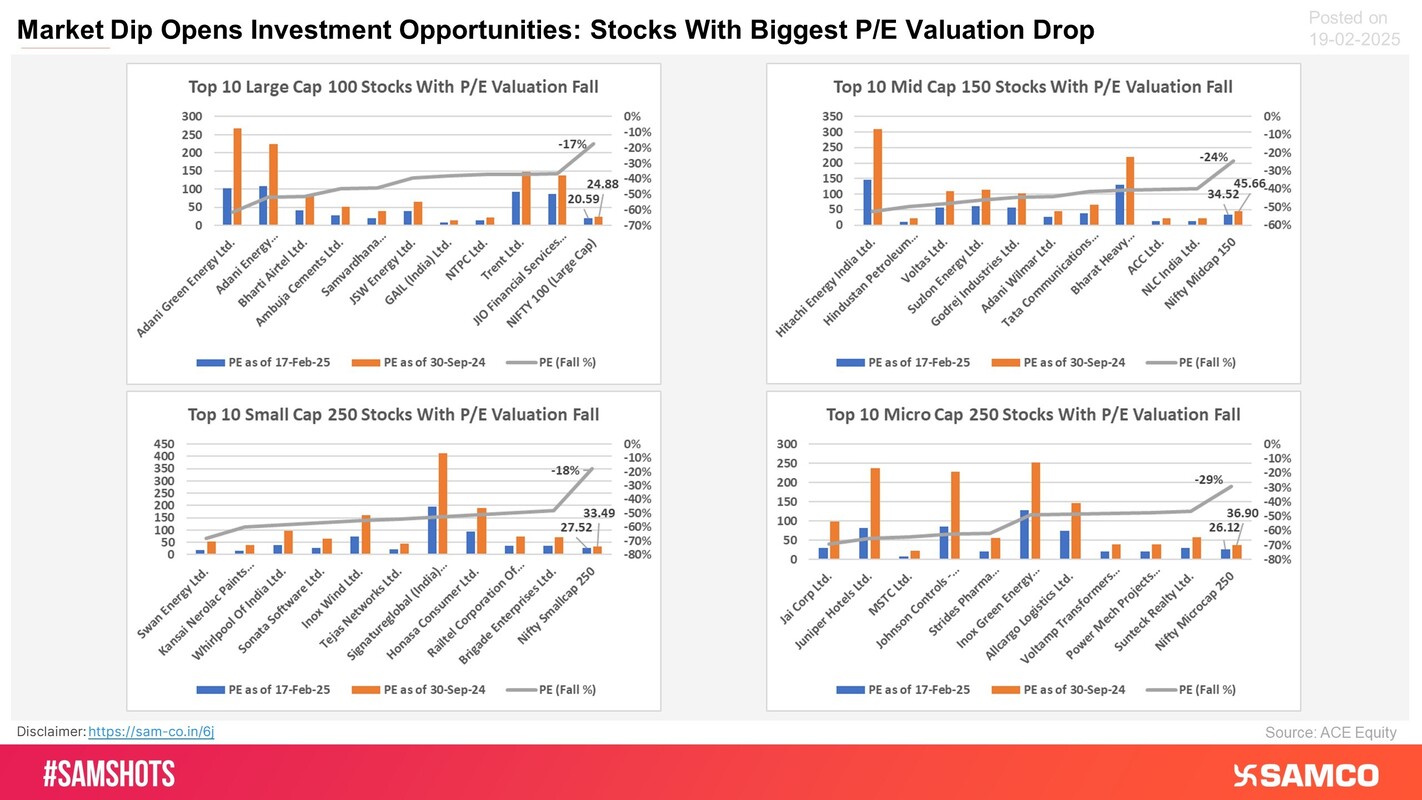
Let’s find the companies providing valuation comfort for investment, as their P/E multiple has fallen the most in this market correction.
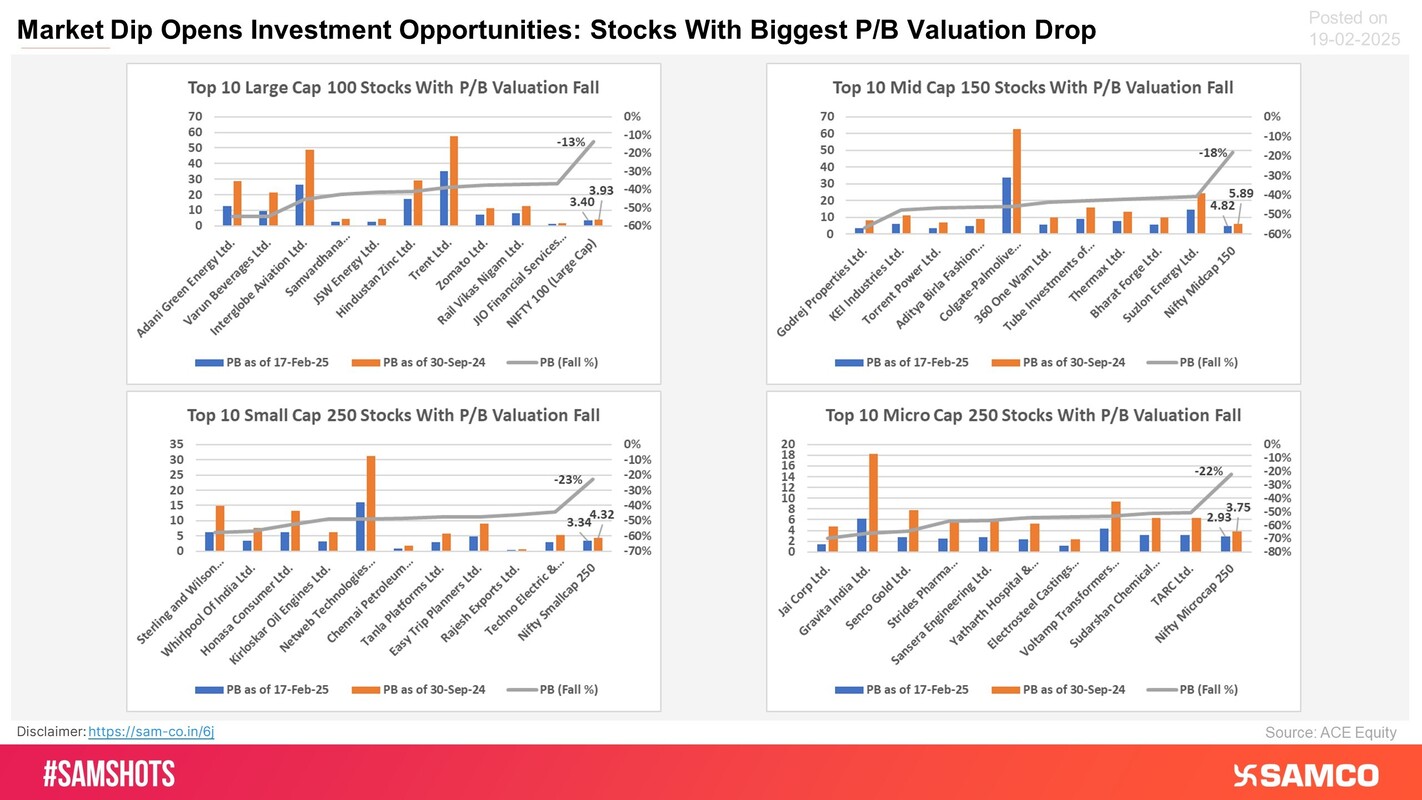
Let’s find the companies providing valuation comfort for investment, as their P/B multiple has fallen the most in this market correction.
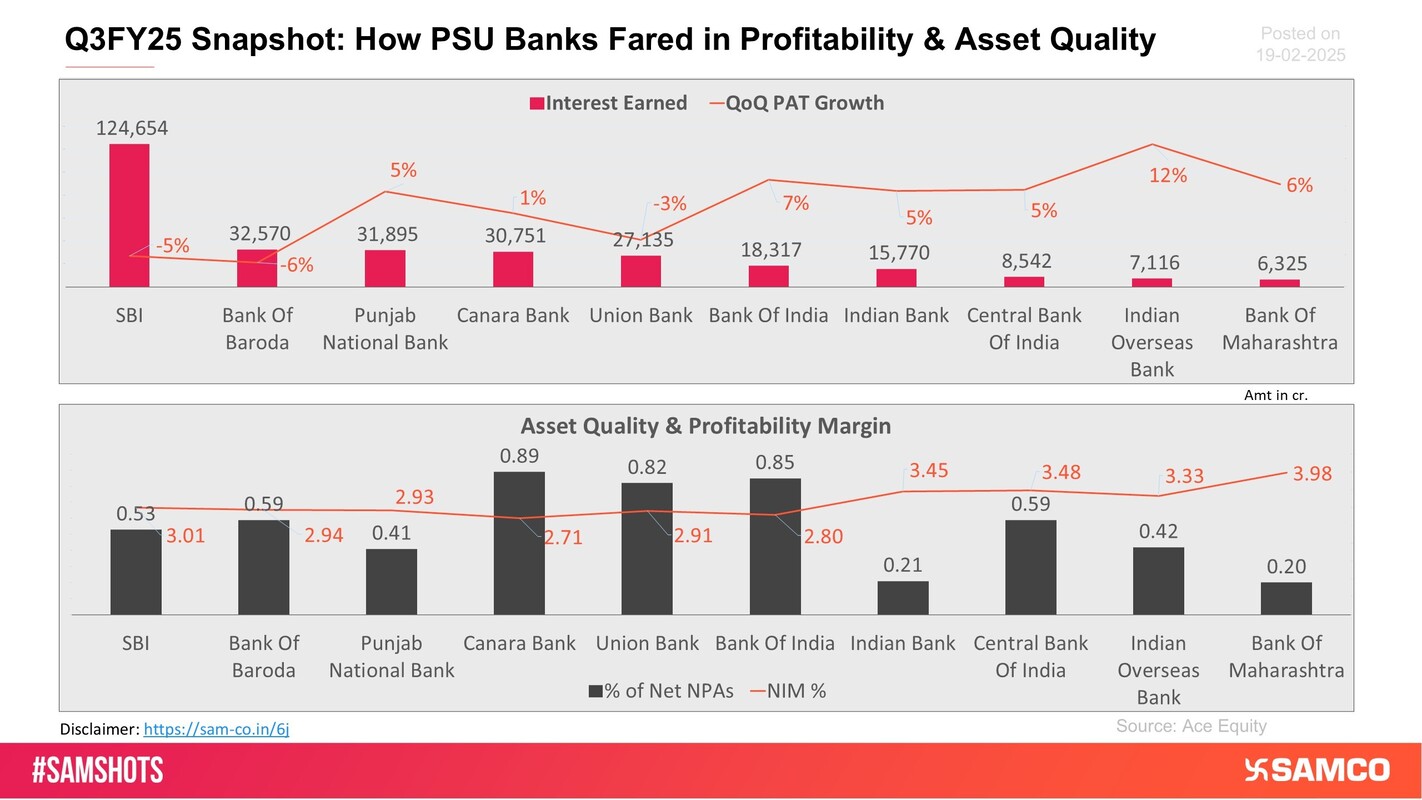
The attached chart shows the performance of PSU banks in Q3FY25.
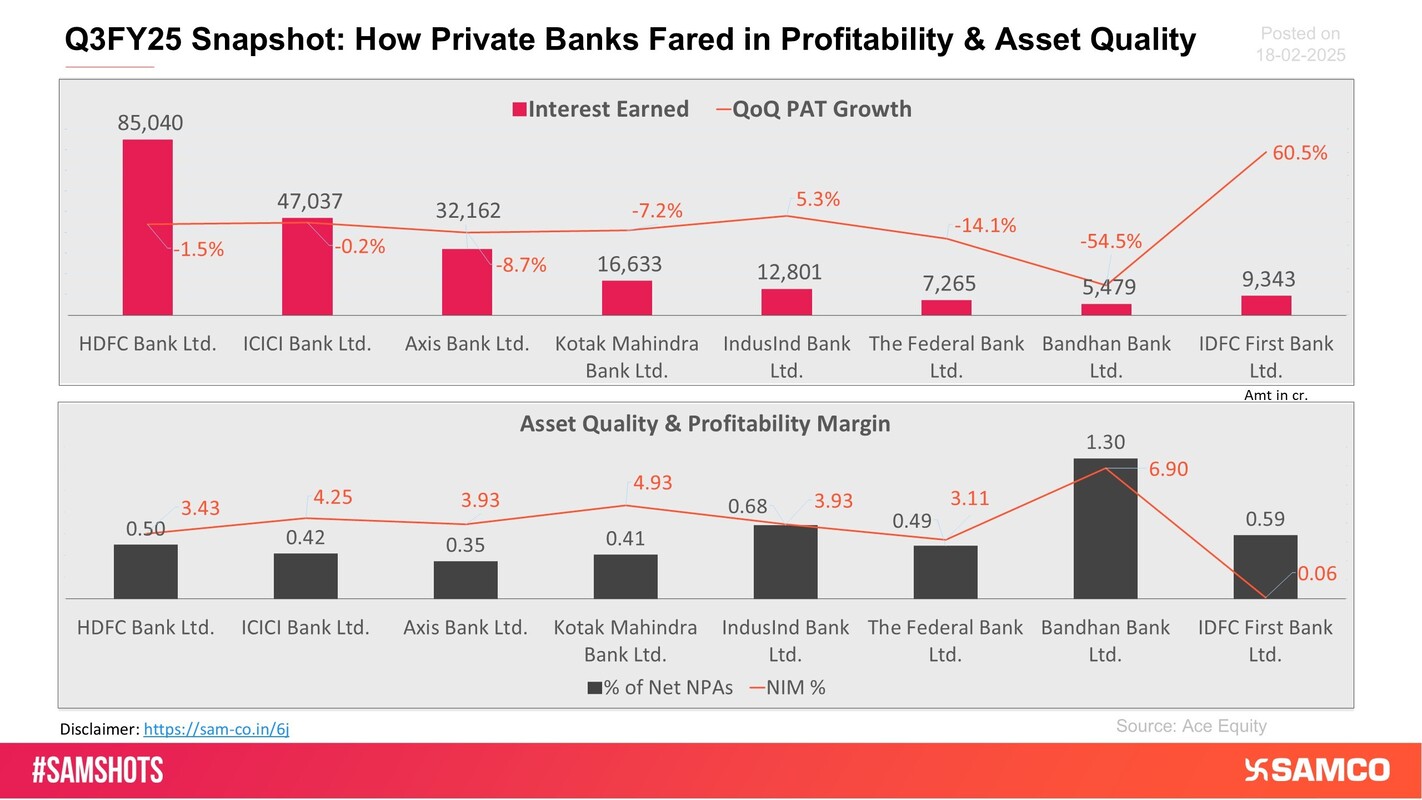
The attached chart shows the performance of private banks in Q3FY25.
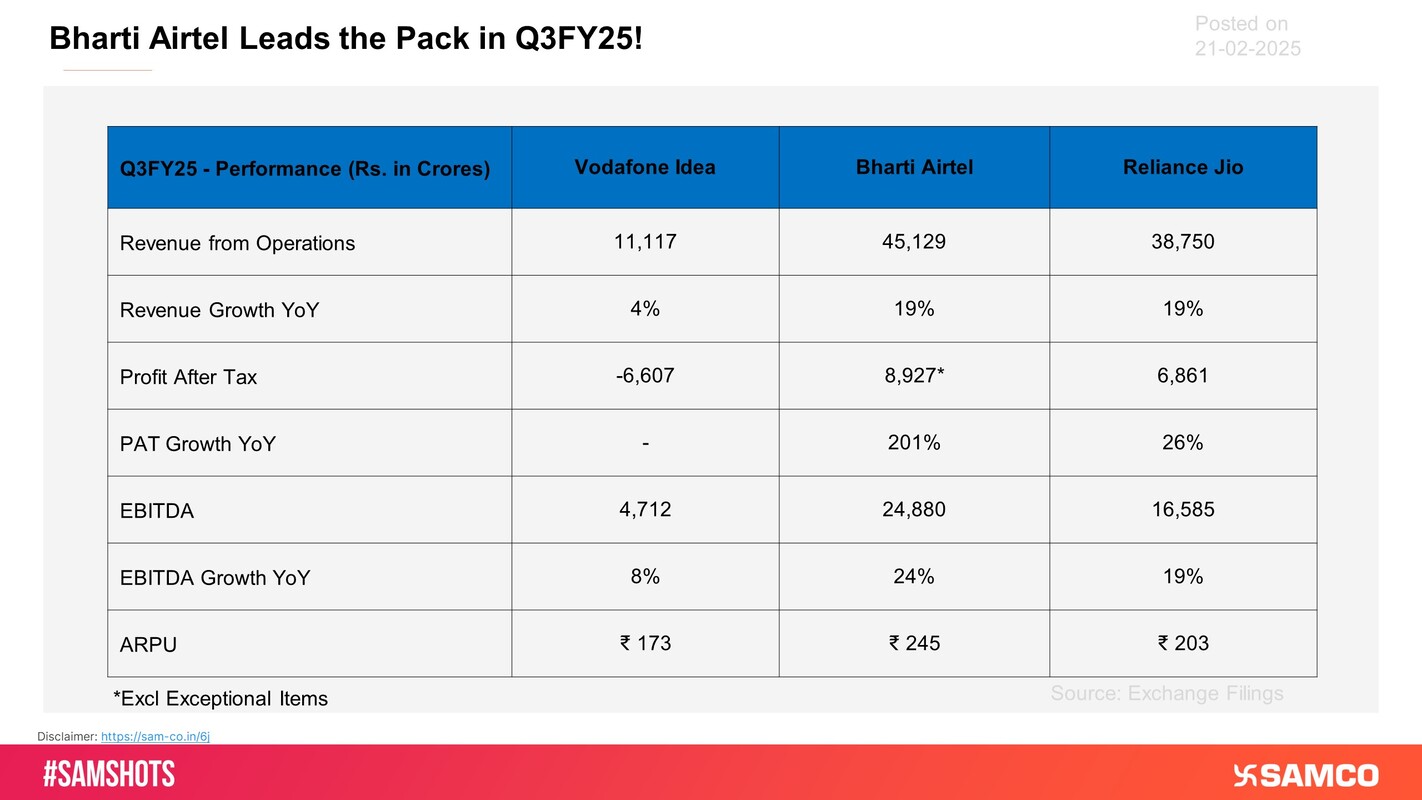
Bharti Airtel has outperformed Vodafone Idea and Reliance Jio across key financial and operational metrics.
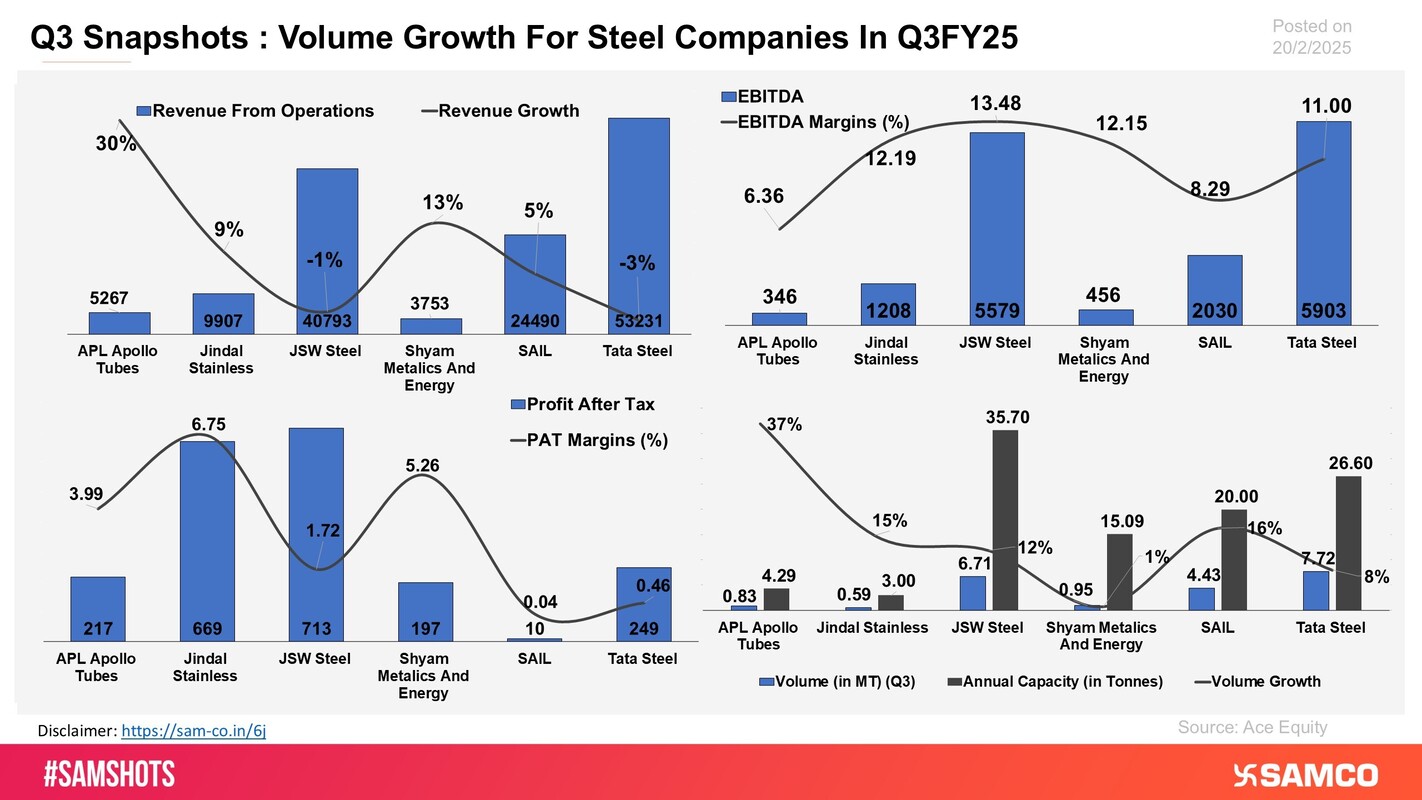
The chart displays the quarterly performance of steel performance for Q3FY25.
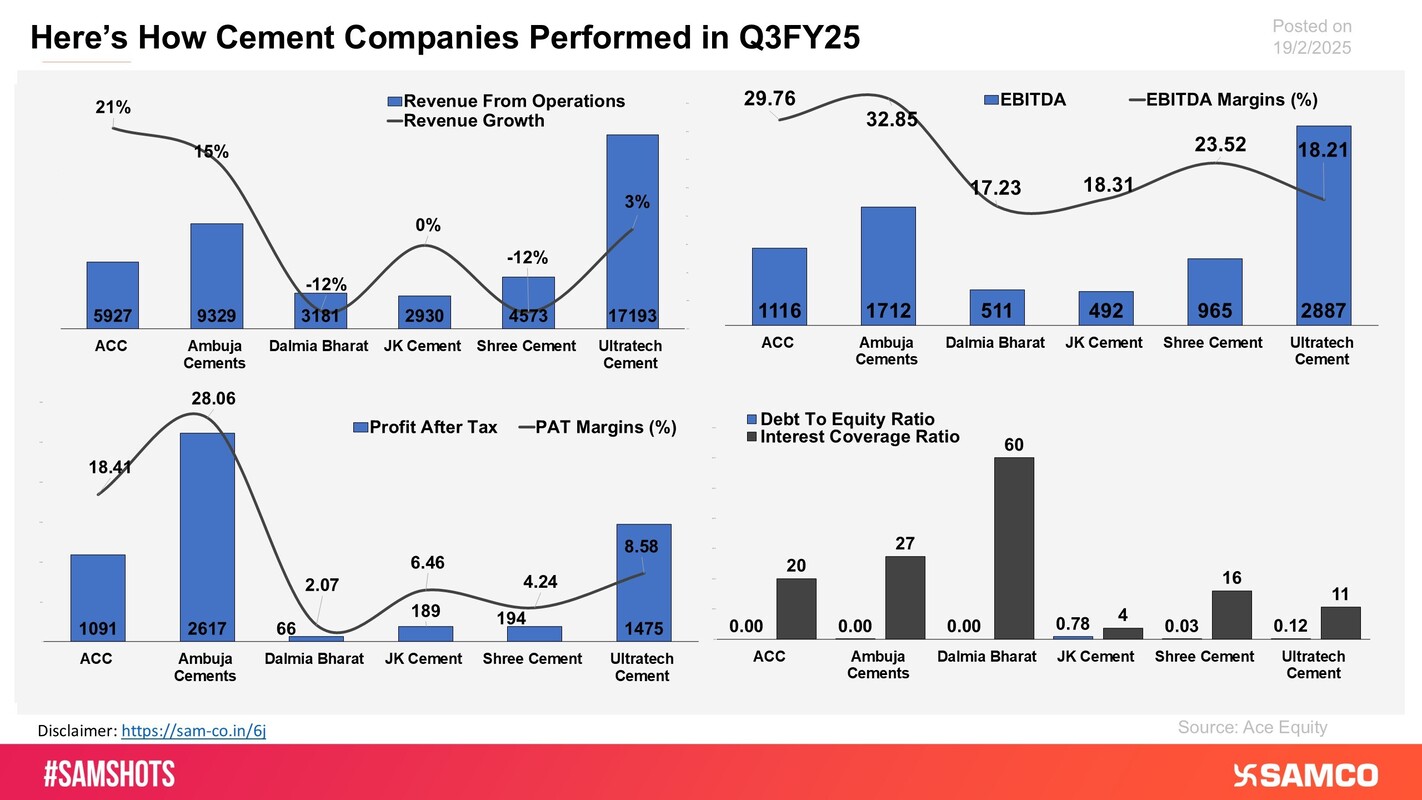
The chart evaluates Cement Companies on financial parameters For Q3FY25.
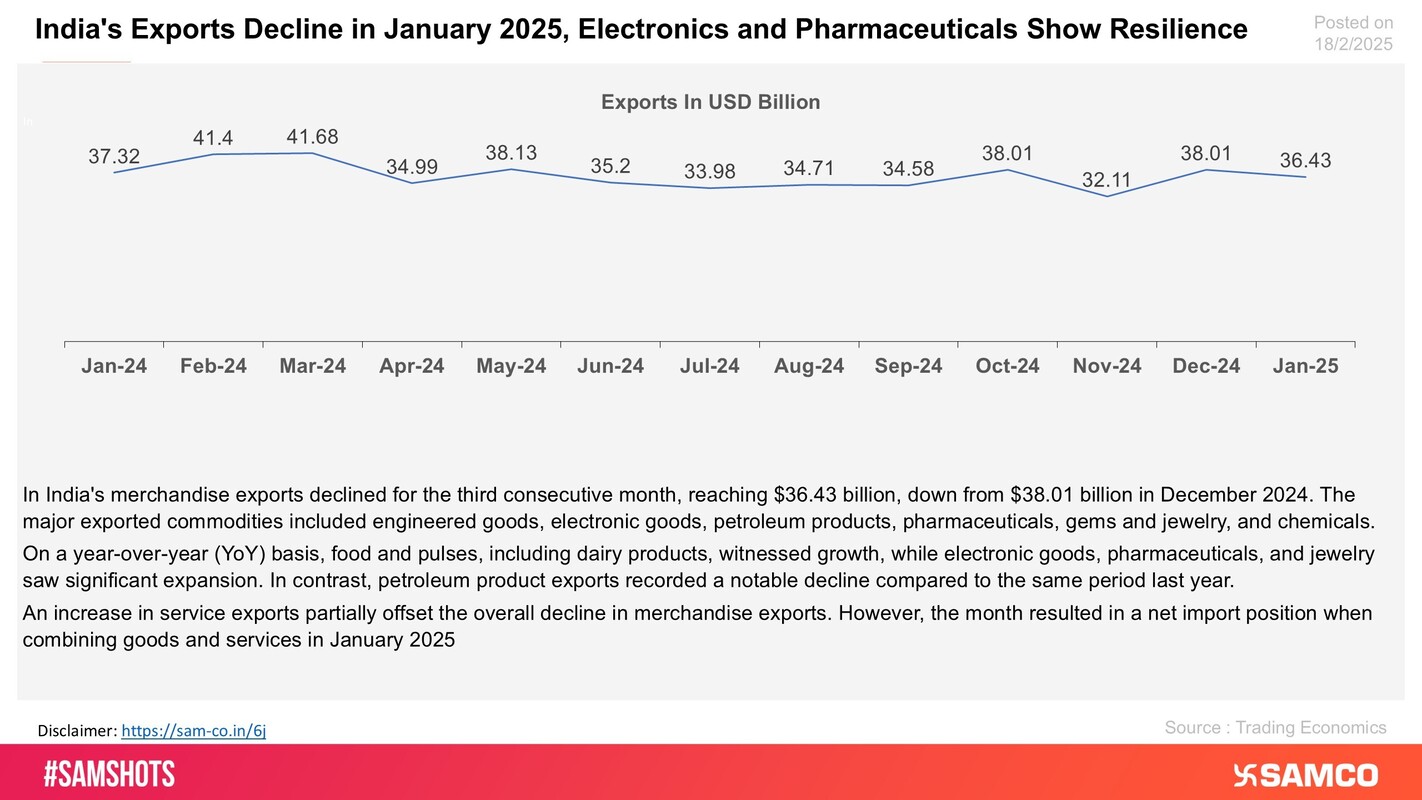
The chart evaluated the reason behind the lag in merchandise exports for India in January 2025.
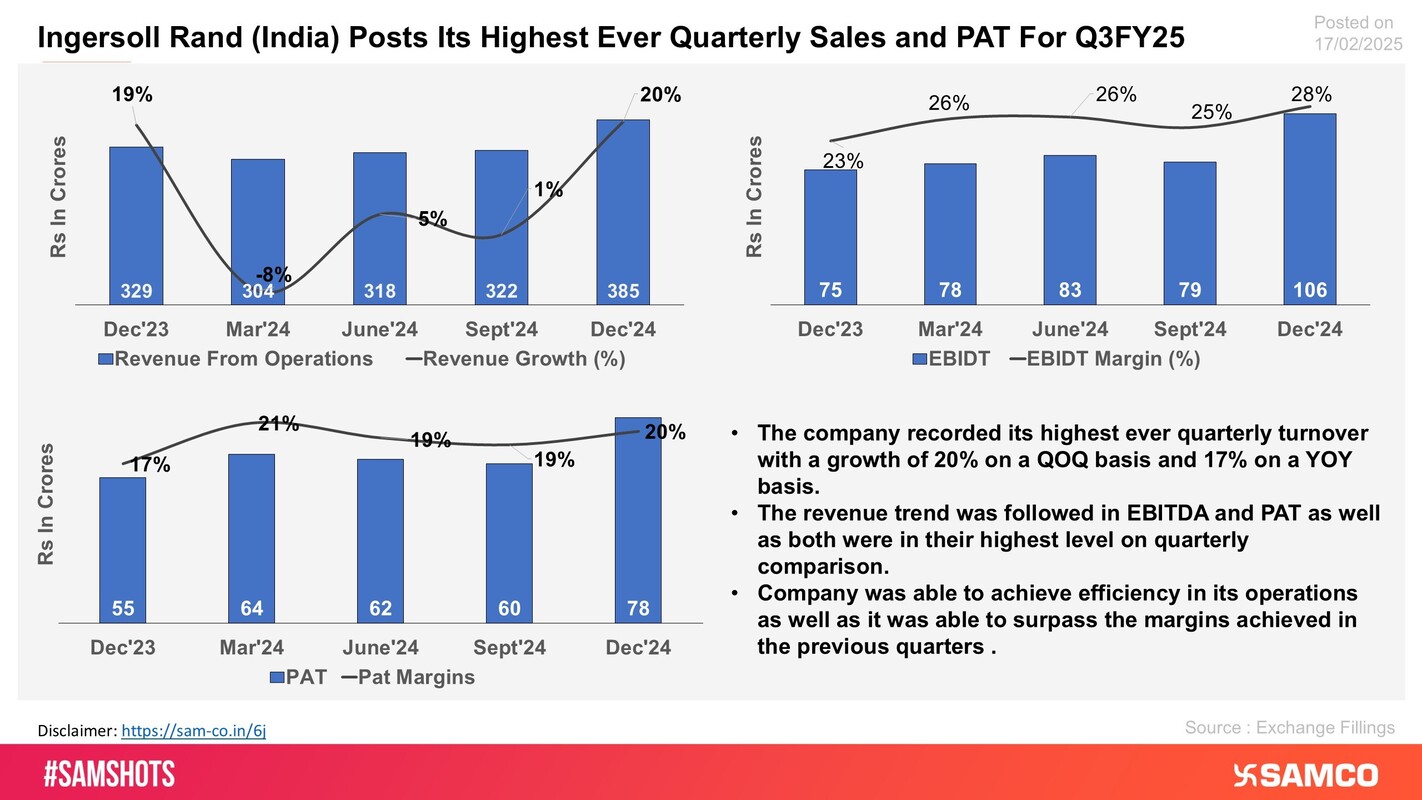
The chart displays the financial performance of Ingersoll Rand India for Q3FY25.
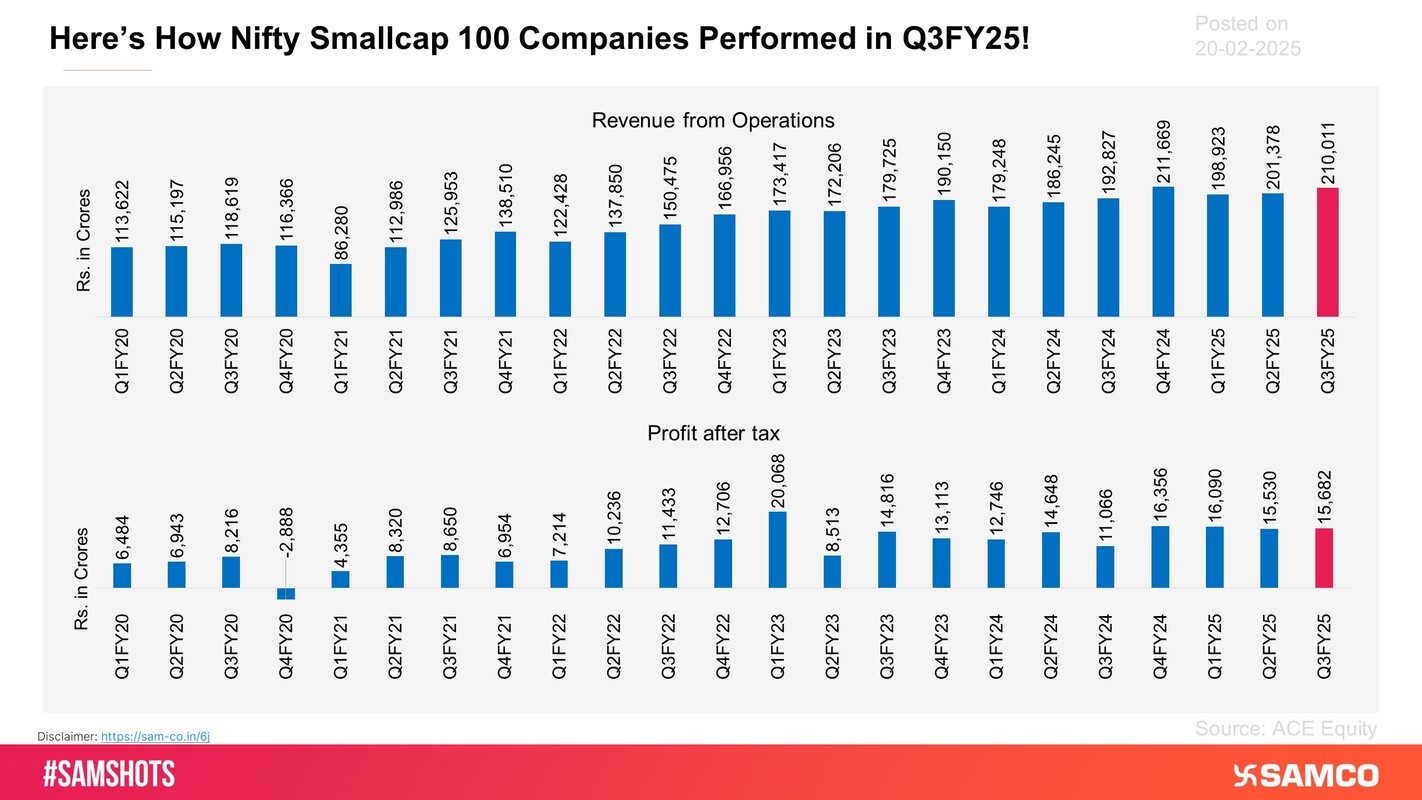
The latest revenue figure at Rs. 2,10,011 Cr is near all-time high revenues reported in Q4FY24, indicating continued demand and operational expansion.
Metal Sector Index outperformed this week, up 5.16%, while Auto Index fell by 2.55%
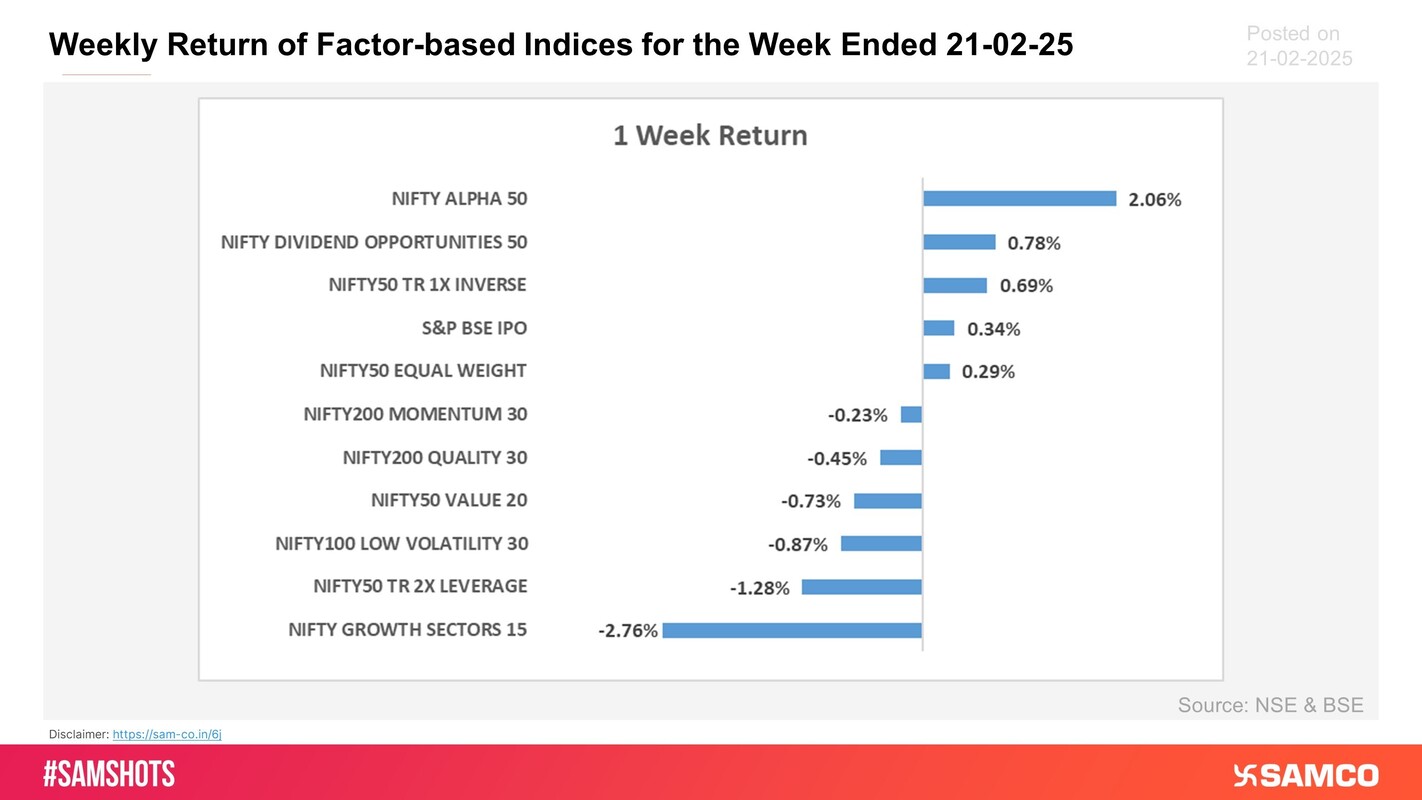
Alpha Factor shined this week as Nifty Alpha 50 (+2.06%) outperformed other strategy indices
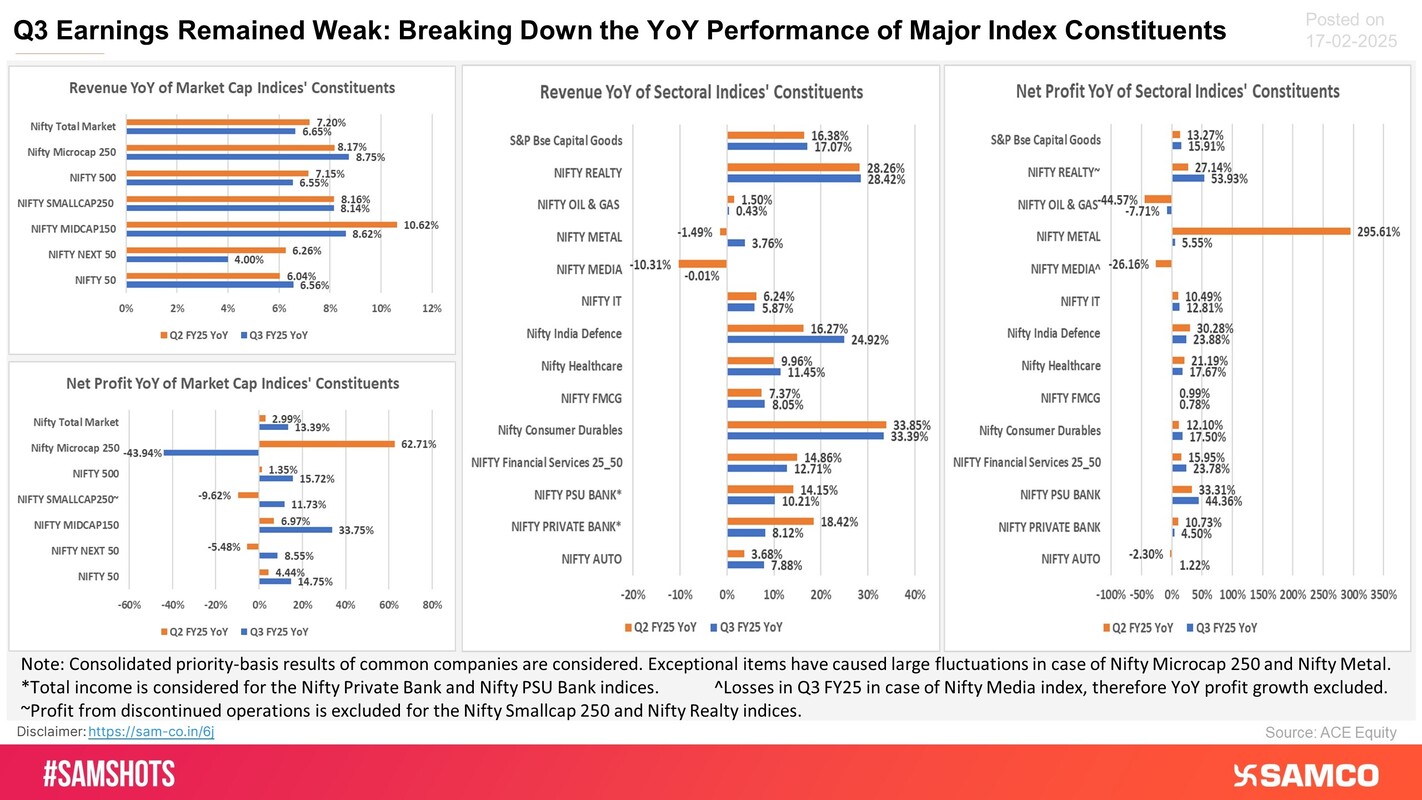
Earnings growth summarization of major indices for Q3 FY25 on a YoY basis.
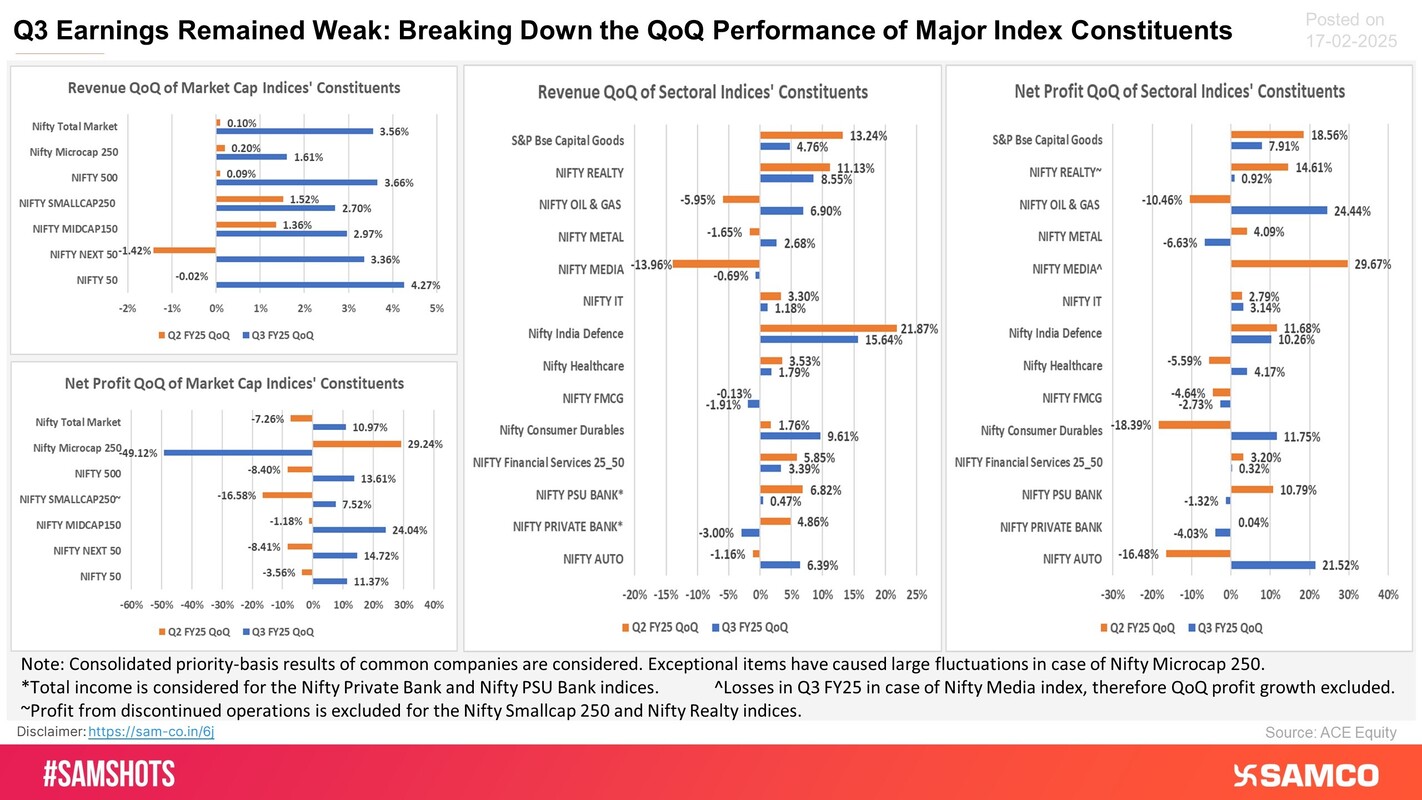
Earnings growth summarization of major indices for Q3 FY25 on a QoQ basis.
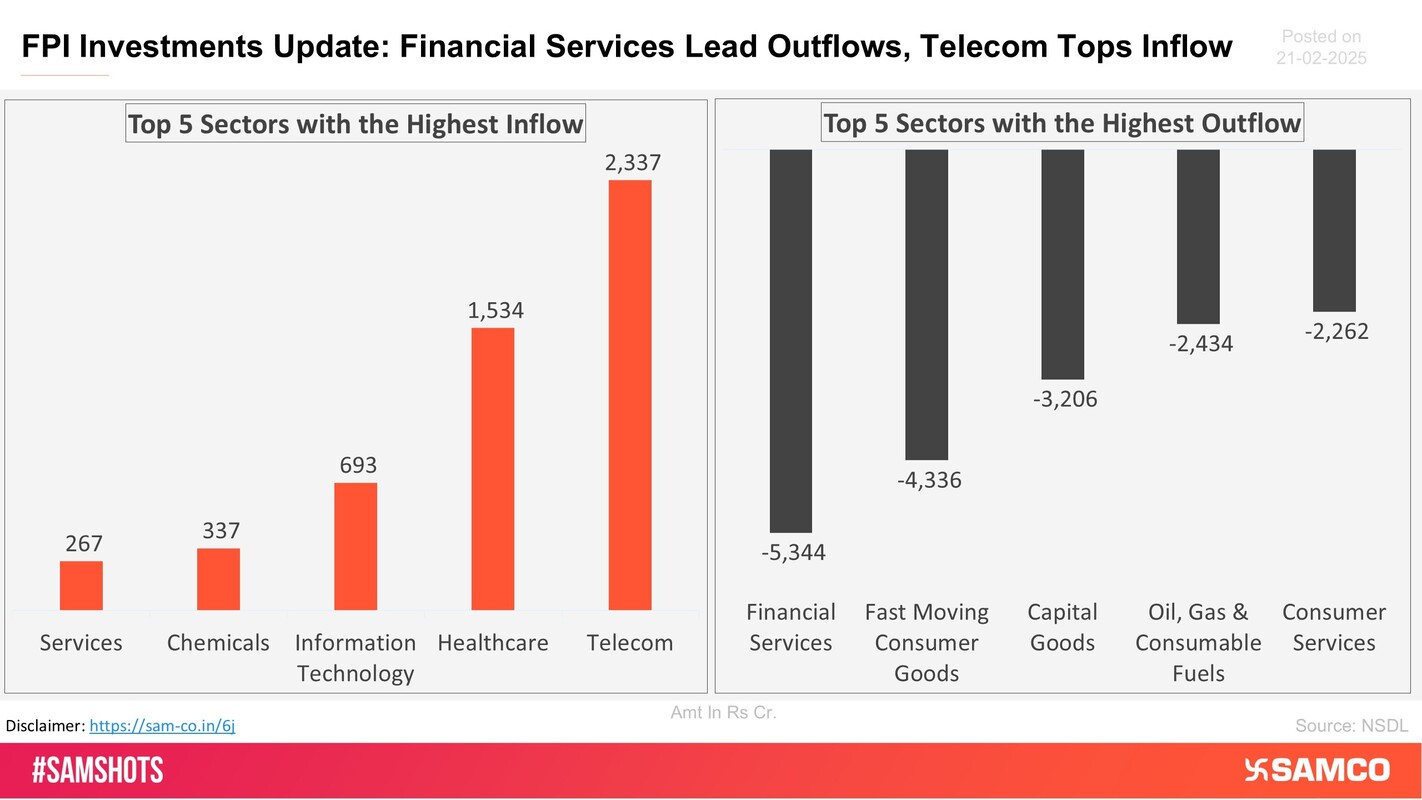
The chart shows the top 5 sectors that witnessed FPI’s highest inflow and outflow in the latest quarter.
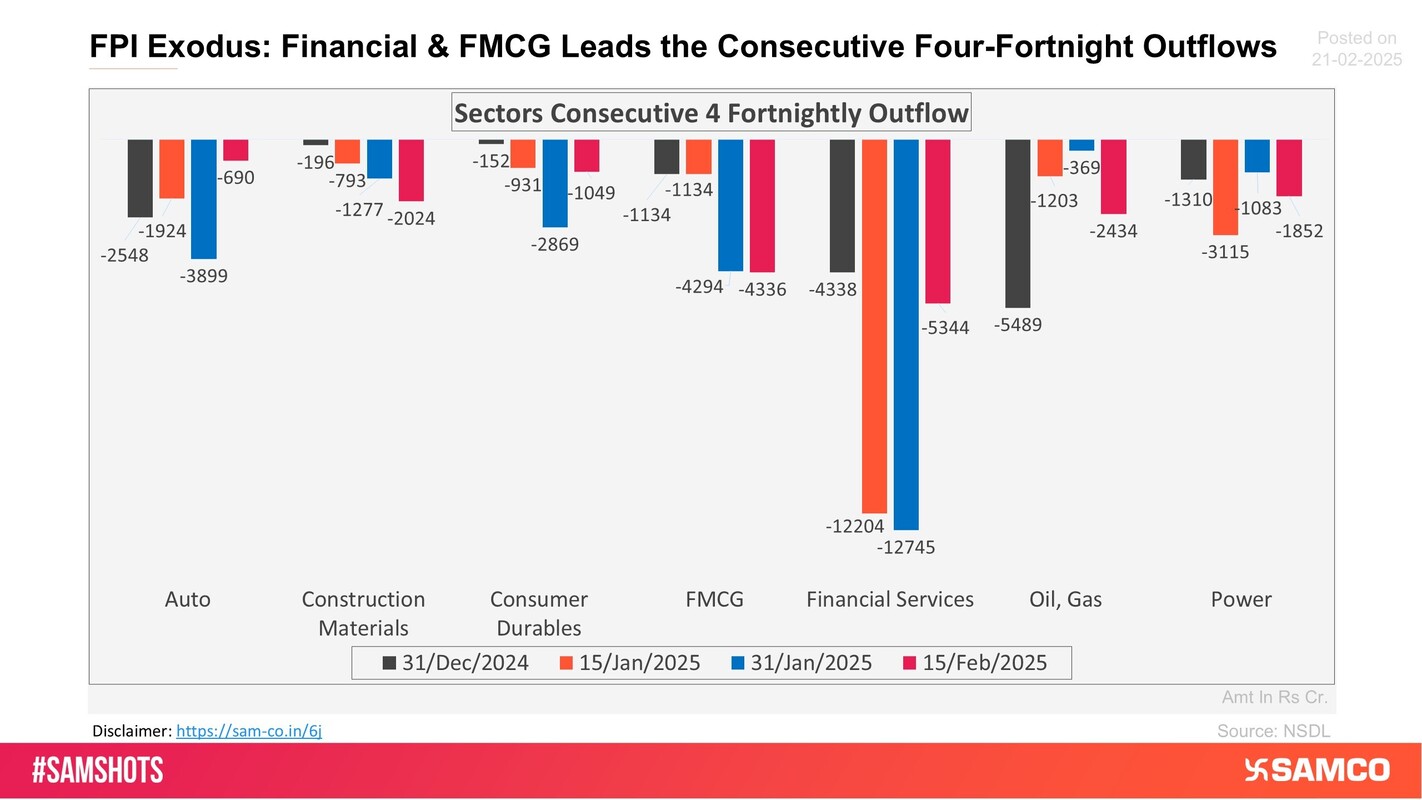
The sectors shown in the chart have witnessed consecutive 4 fortnightly outflows of FPI money.
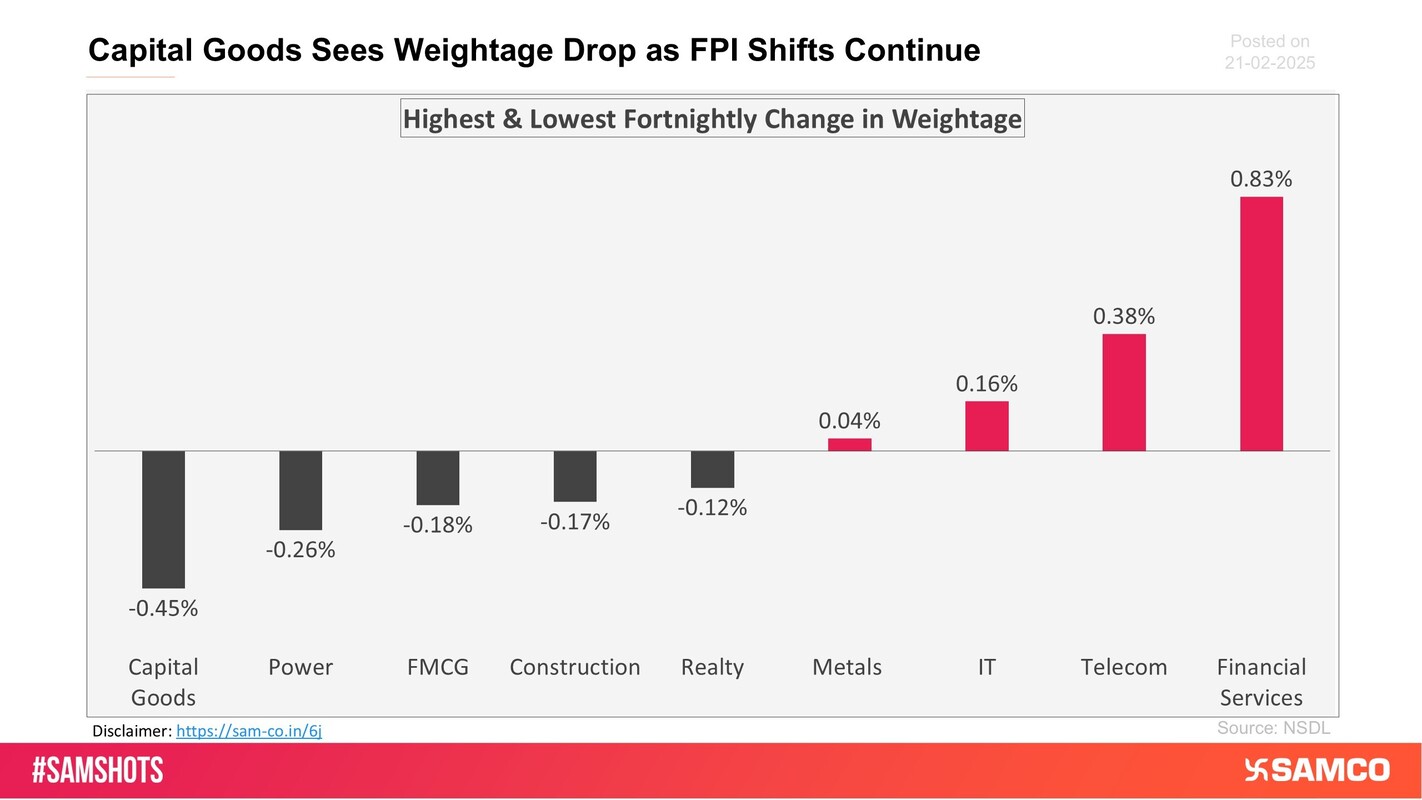
The chart below displays sectors that witnessed the highest and lowest change in the weightage of sectoral FPI holdings to the total FPI holdings compared to the previous fortnight.
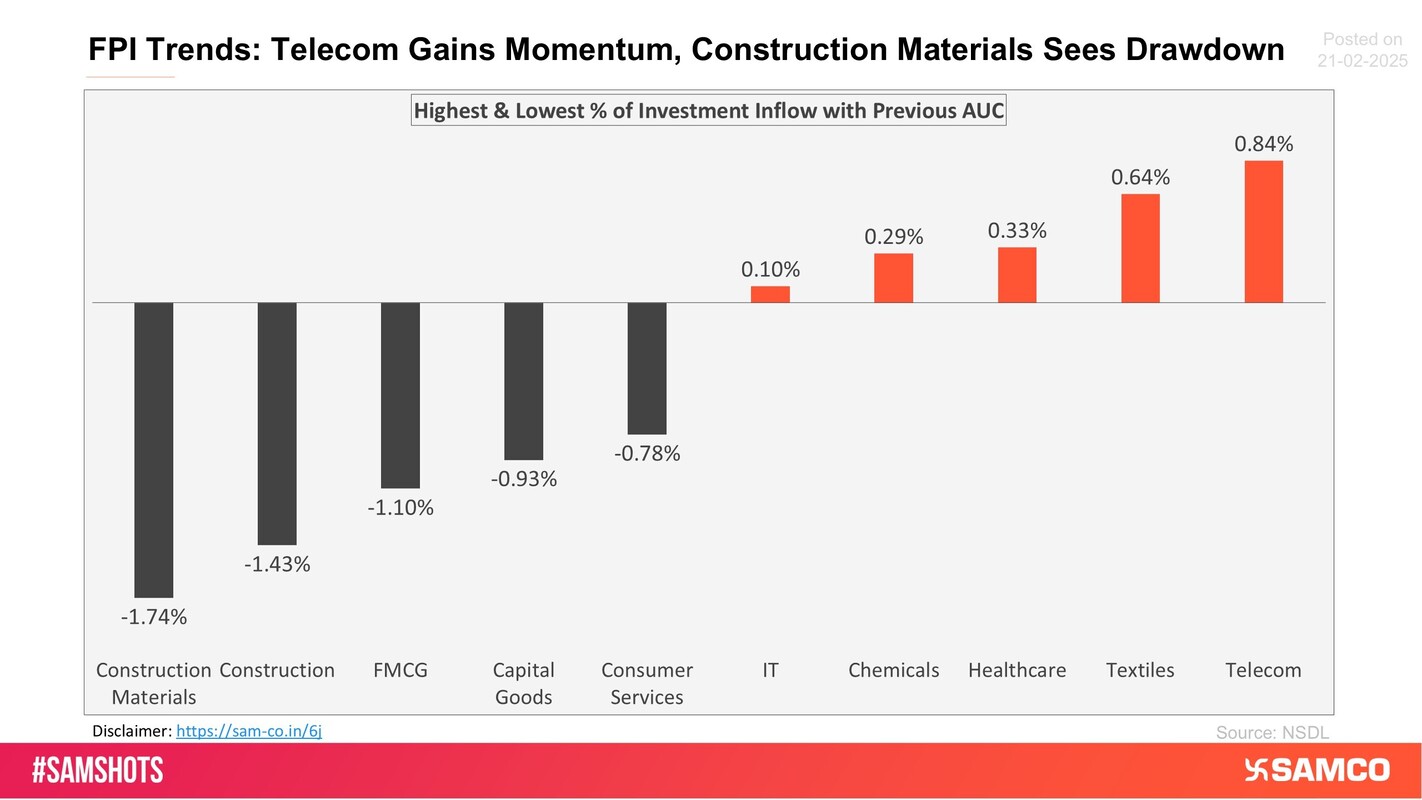
The below chart presents the highest & lowest percentage inflow of investment in the latest fortnight compared to the previous period AUC (Asset Under Custody) of FPI.
TCPL Packaging’s Strong Breakout Signals Further Upside
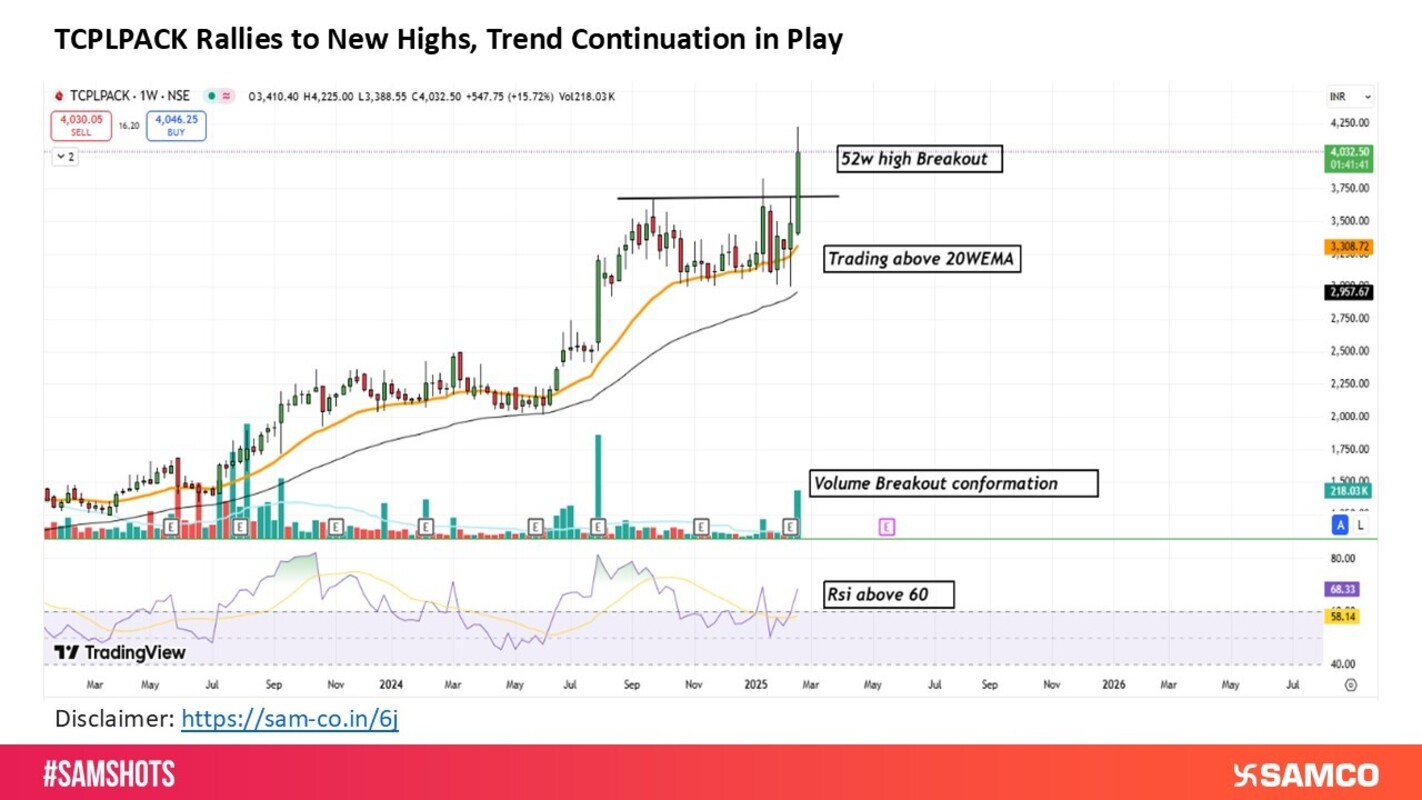
Image Source: @StatistaCharts (Twitter)

 Easy & quick
1. Register on SCORES portal
2. Mandatory details for filling complaints on SCORES
Name | PAN | Address | Mobile | Number | E-mail ID
3. Benefits
Effective Communication
Speedy redressal of the grievances
