The Nifty 50 extended its rally from last week but snapped its 7-day winning streak, ultimately closing with a modest 0.72% gain at 23,519. The uptrend was primarily driven by strong Foreign Institutional Investor (FII) inflows, marking a seven-day consecutive buying spree.
Volatility surged, fueling a rally in precious metals, with silver stealing the spotlight- soaring 4% to hit a new all-time high, outperforming gold.
Meanwhile, after last week’s robust gains, the Midcap and Smallcap segments saw a muted to negative performance. Sectoral indices delivered a mixed performance, with Bank Nifty leading the pack, jumping 1.92%.
Scroll down to understand more of such market news and perspectives for the week gone by in easily understandable charts.
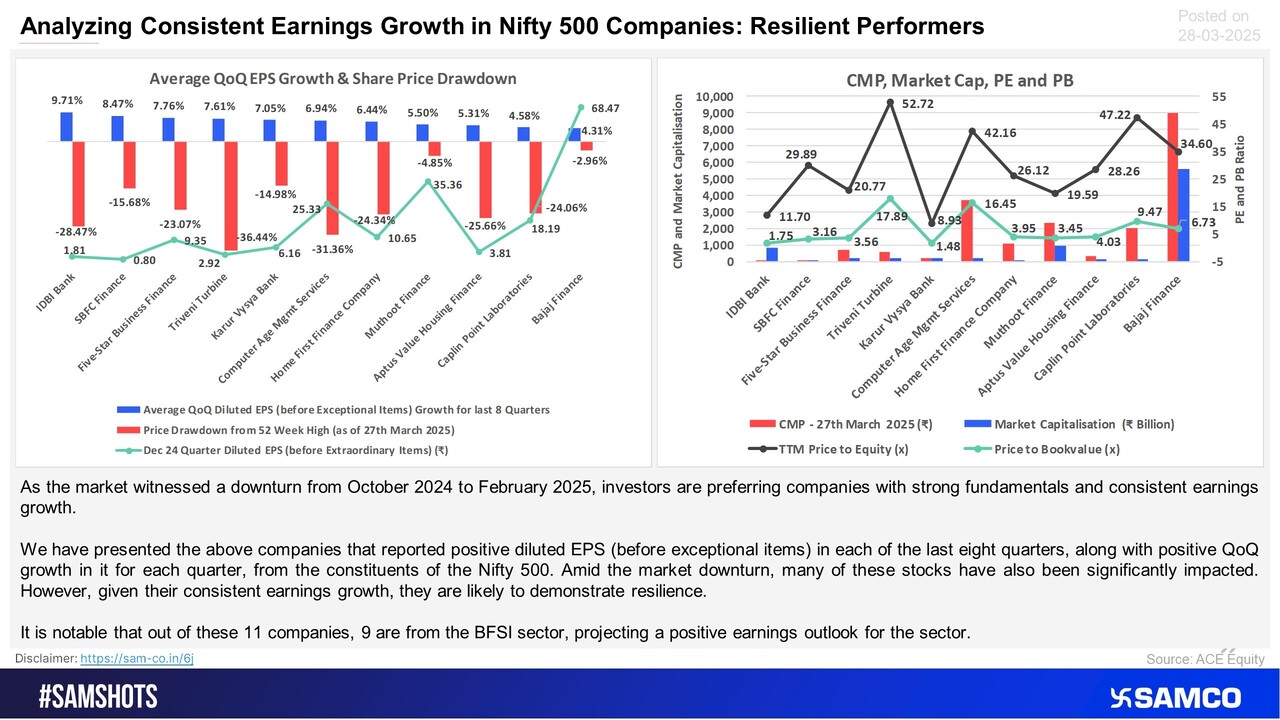
Want strong fundamental bets amid a volatile market? Here’s a list of companies with consistent earnings growth over the past two years


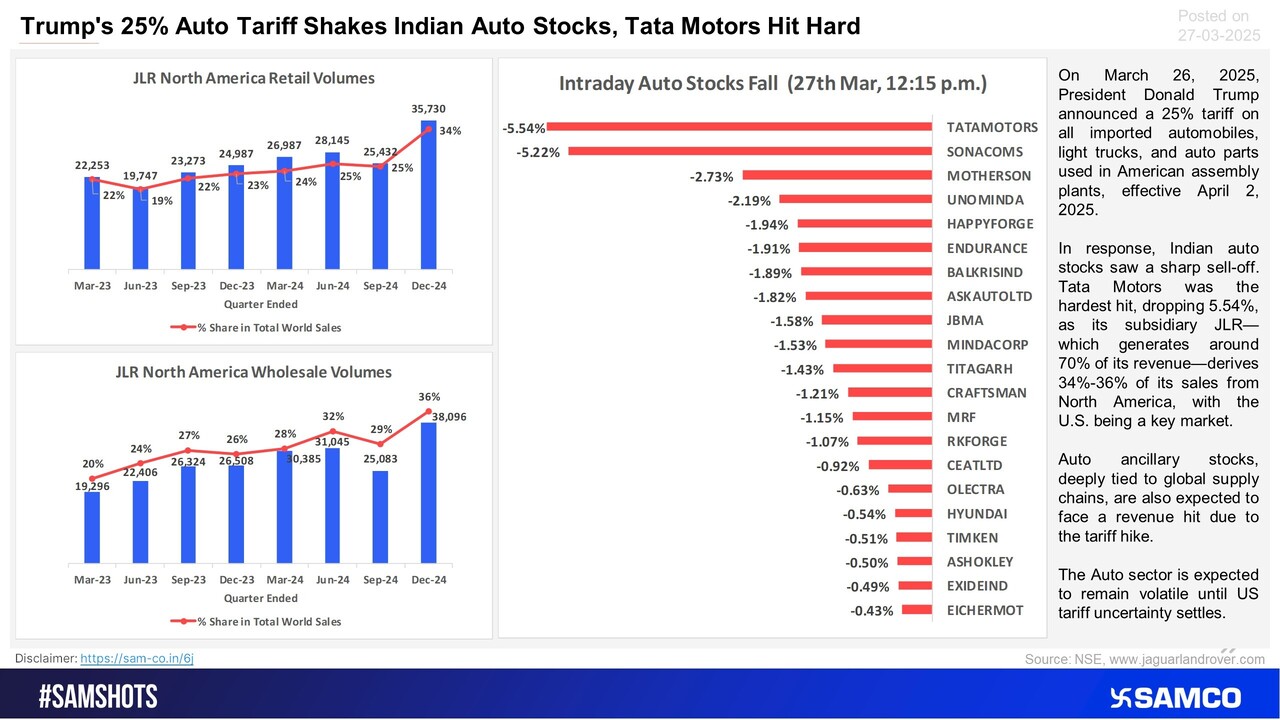
The tariff proposal by the US on imported Auto and components left the auto industry shattered. Here’s an analysis
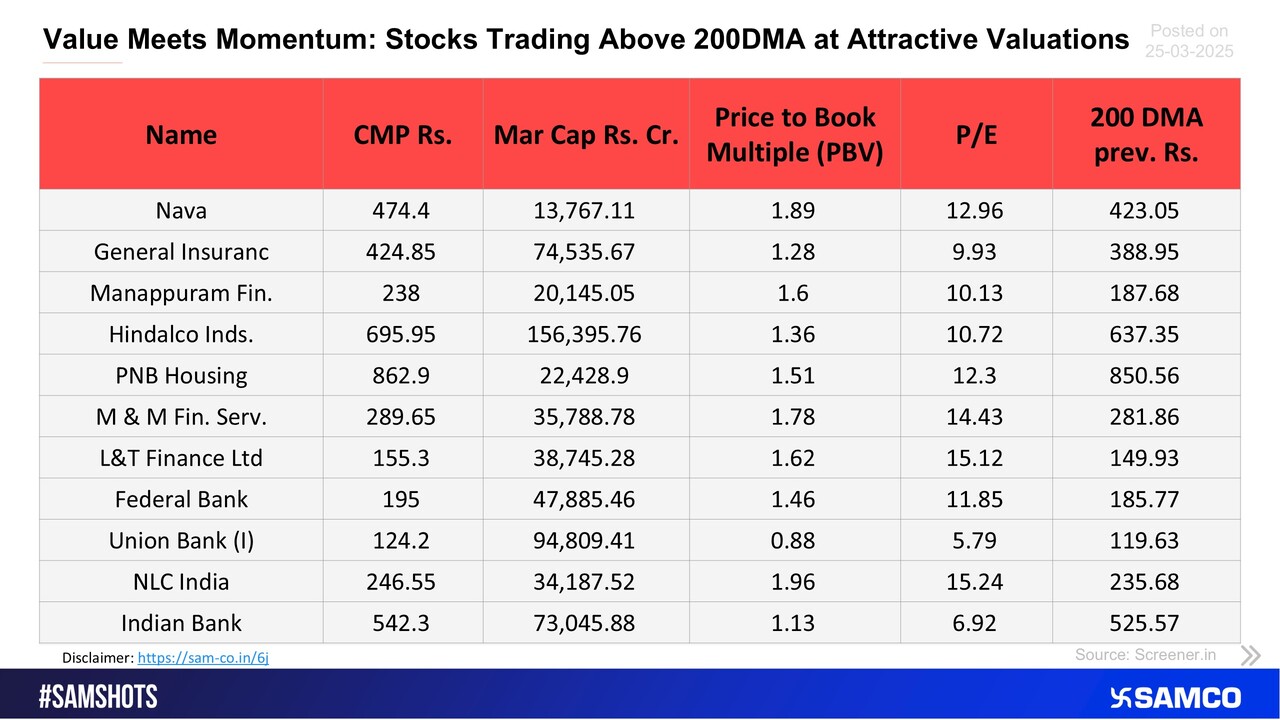
The below chart presents a list of stocks that are trading at above 200 DMA and at a low valuation.
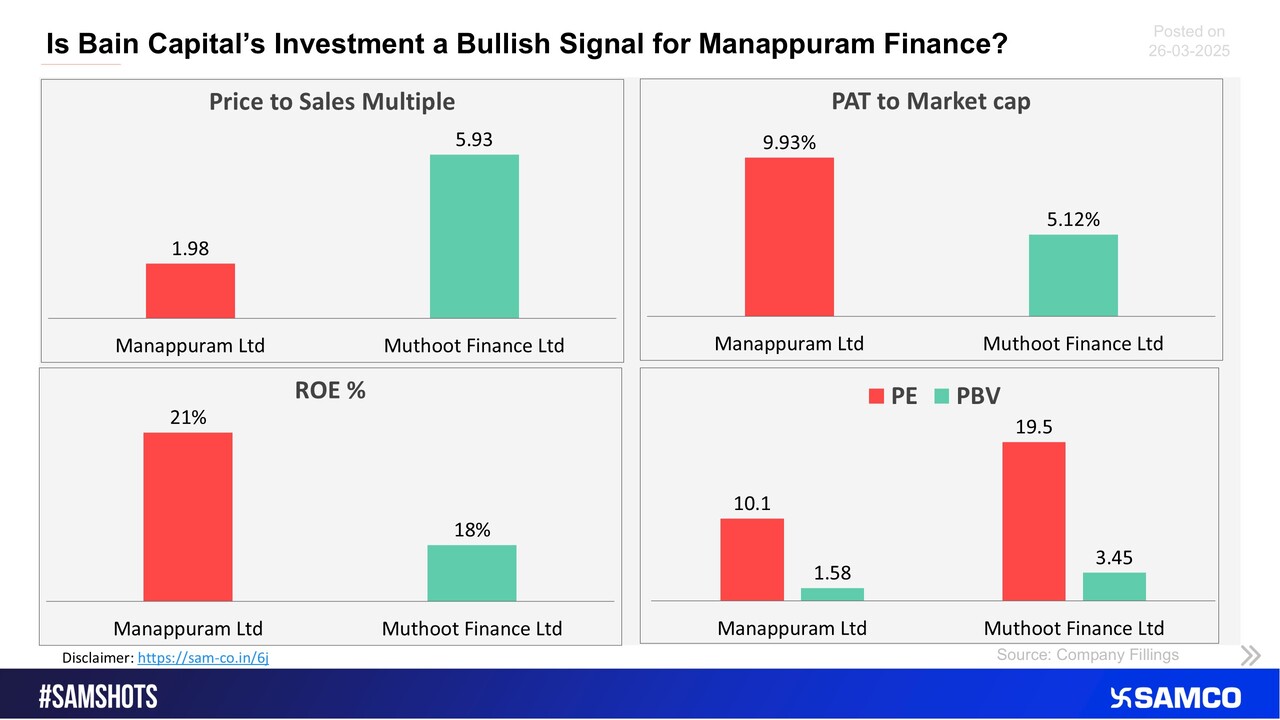
Is Bain capital found the value in Manappuram ahead of its investment deal? here is the peer comparison.
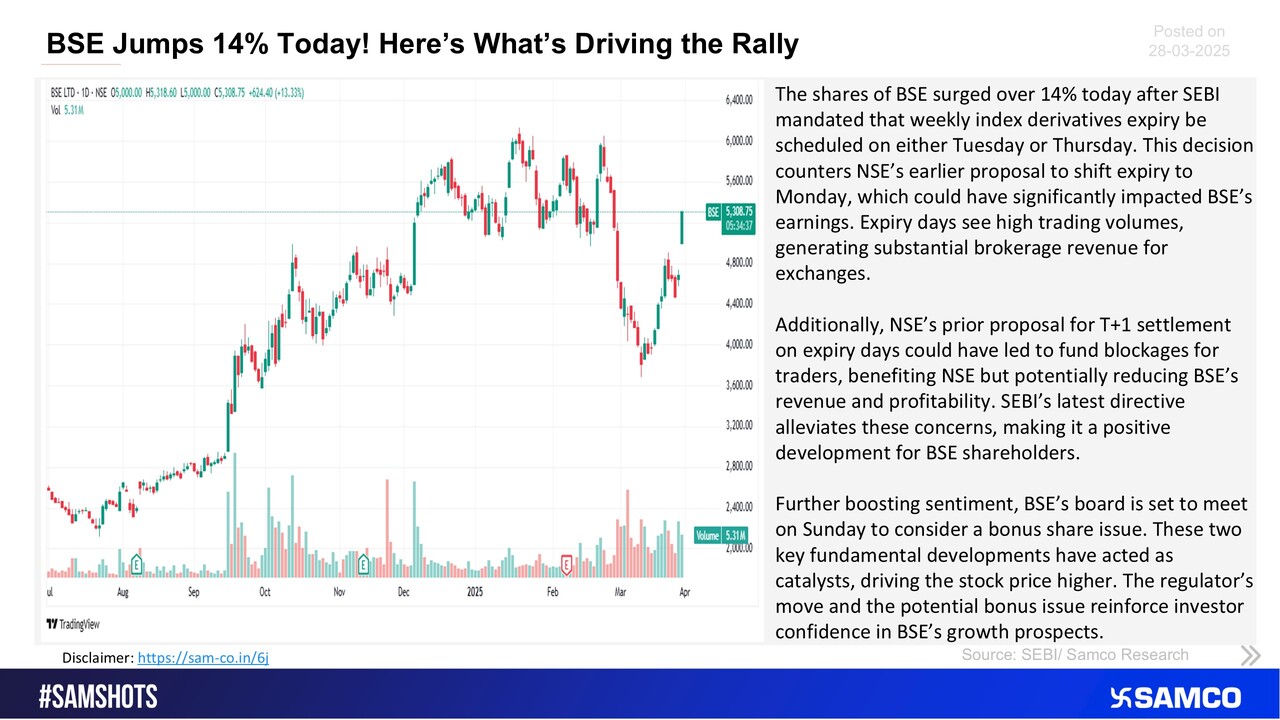
Here’s why BSE surged above 14% today.
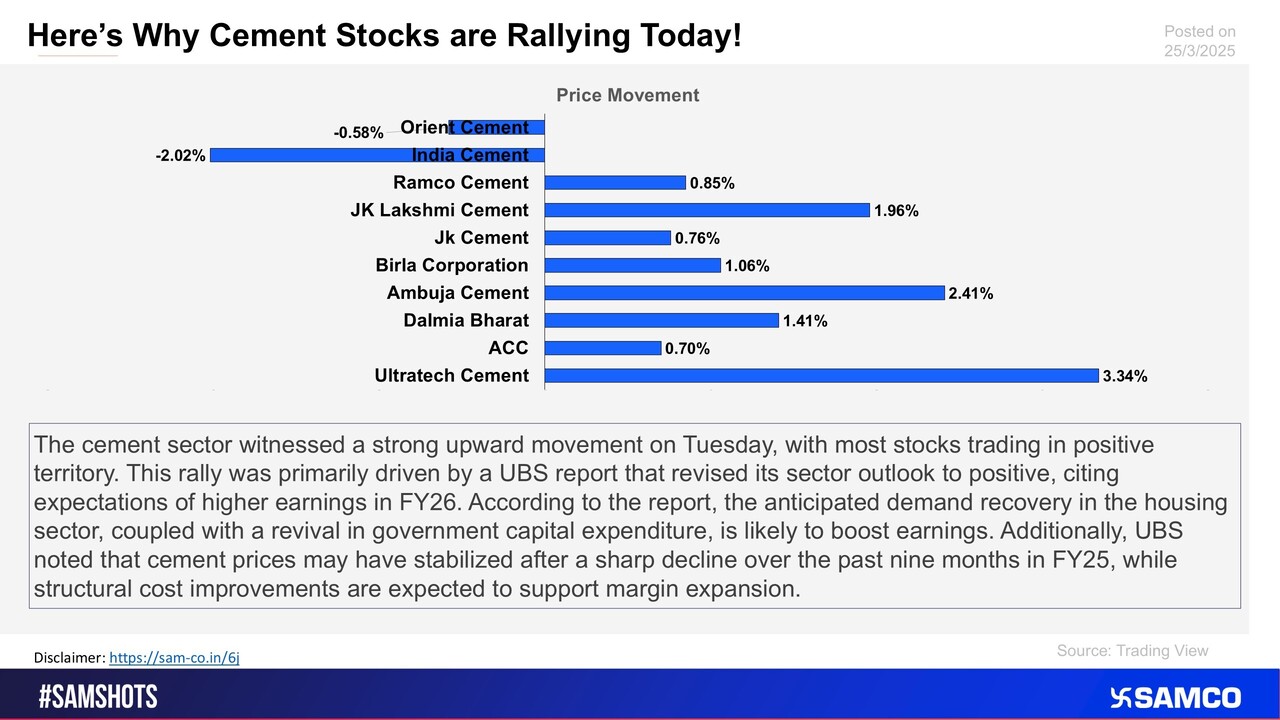
The chart explains the rationale behind the surge in Cement stocks on 25th March,2025
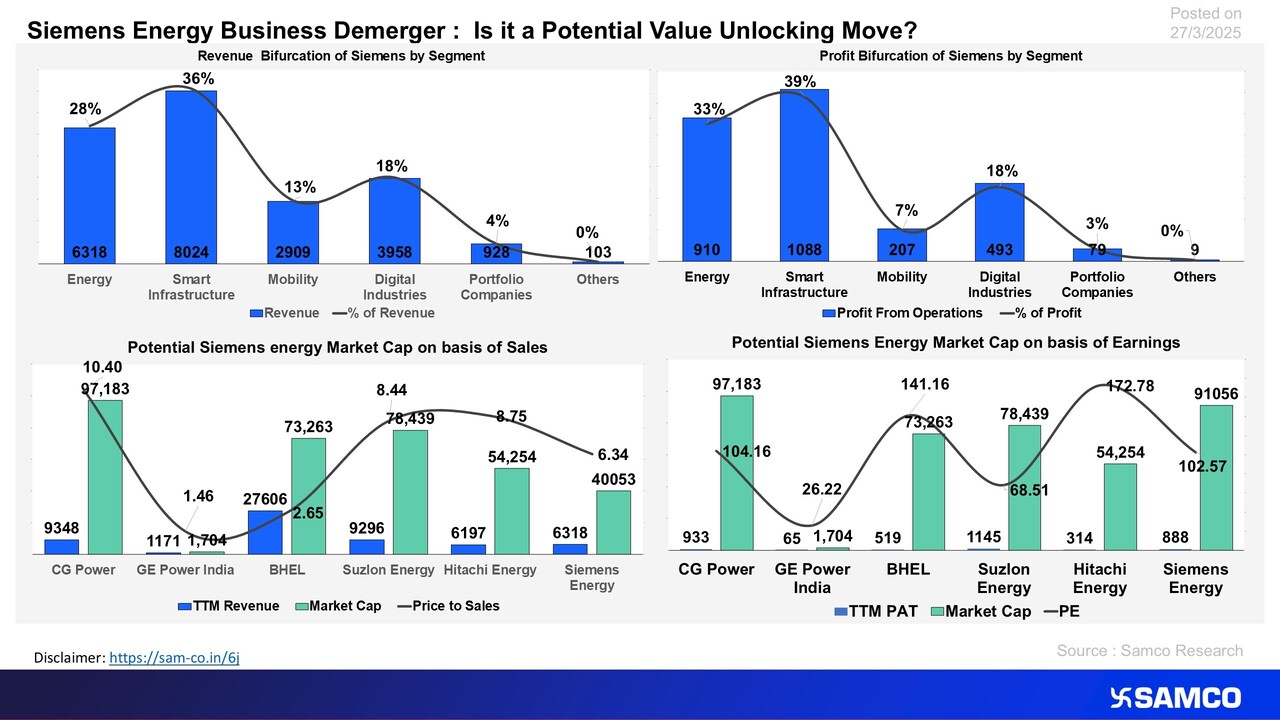
The chart explains the impact of the demerger of Siemens Energy from Siemens
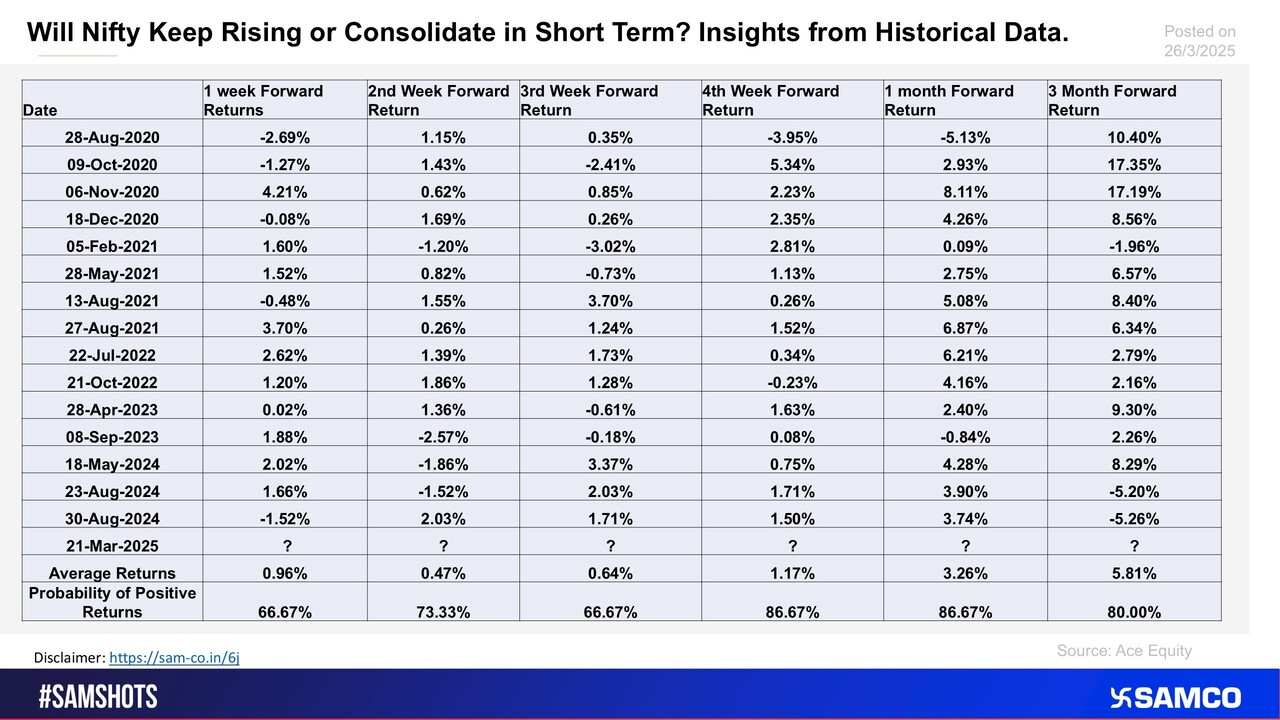
The chart displays the historical performance of Nifty when it has risen for 5 straight trading days in the week
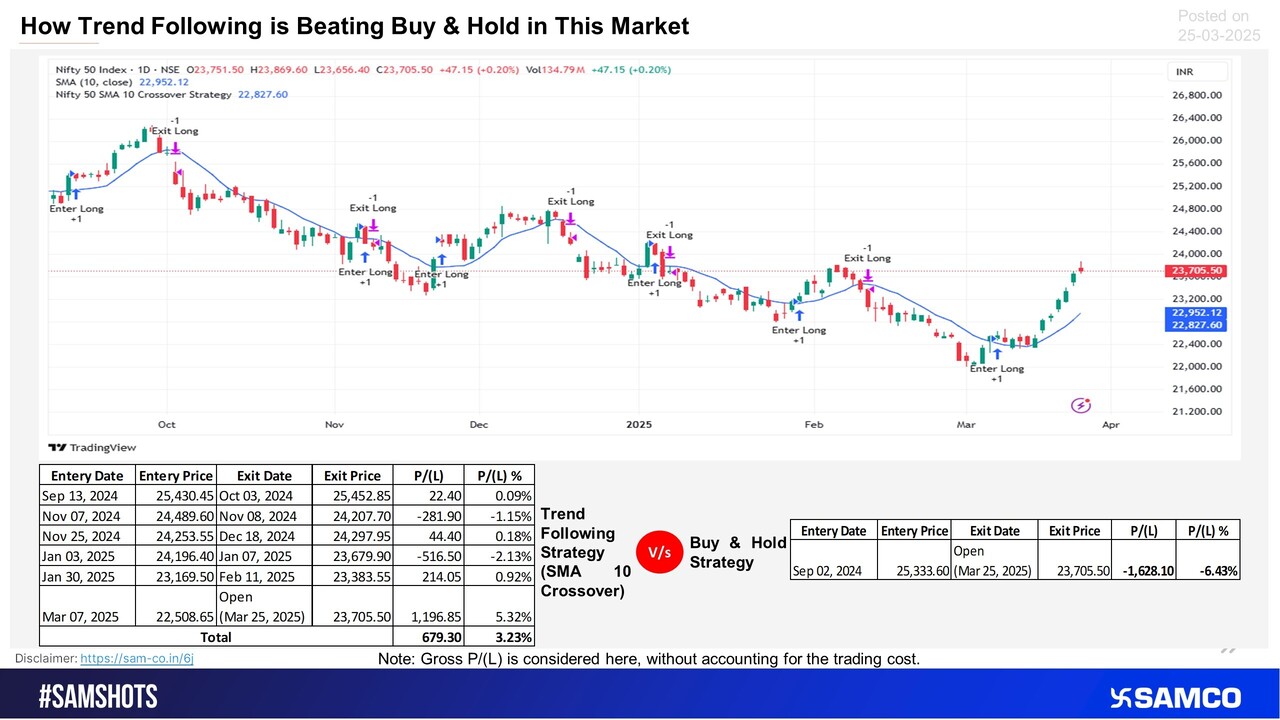
Breaking down the performance of Moving Average Crossover Trend and Buy & Hold strategy in the recent market on Nifty
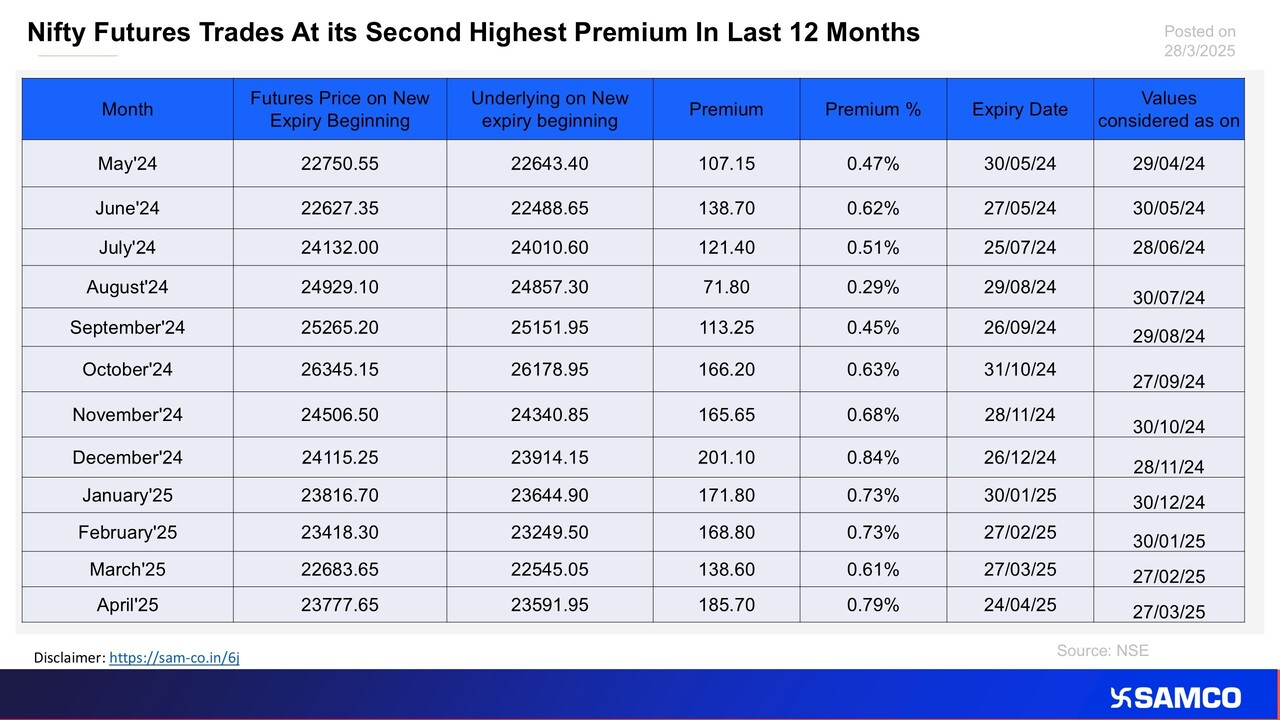
The chart displays the premium of Nifty futures on month expiry in the last 12 months.
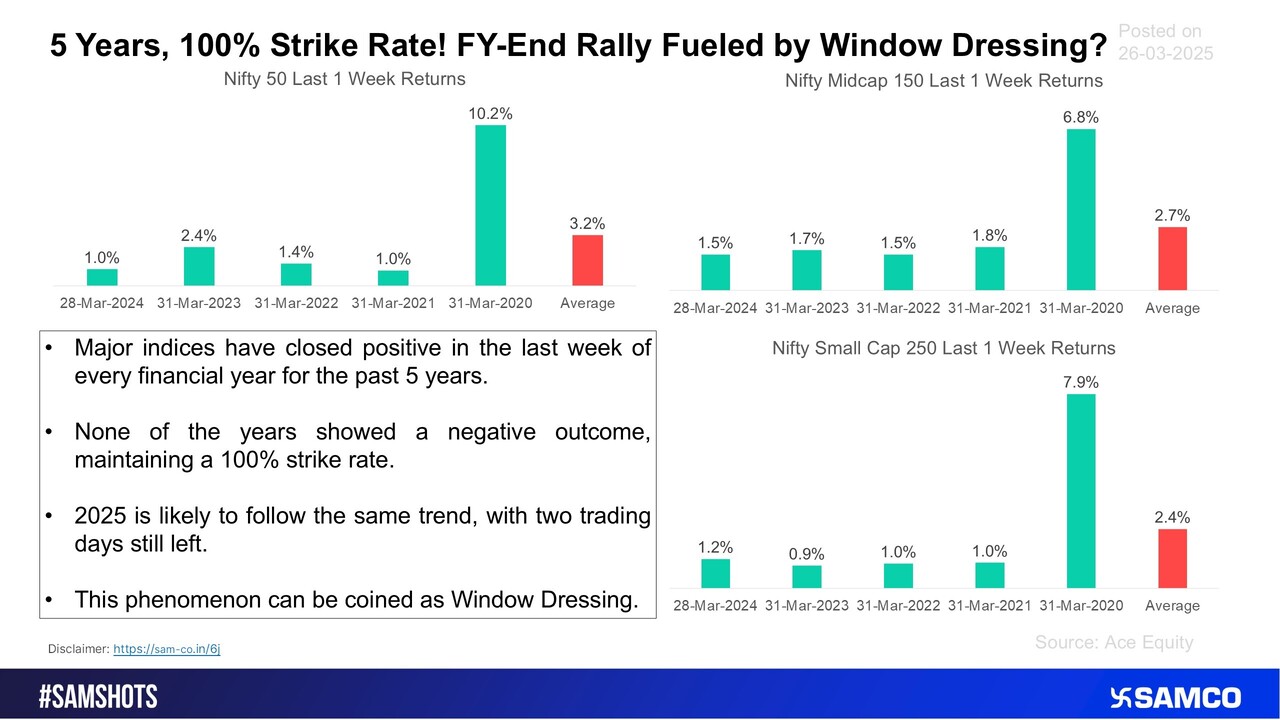
Here’s the performance summary of Major Indices during the last week of each FY.
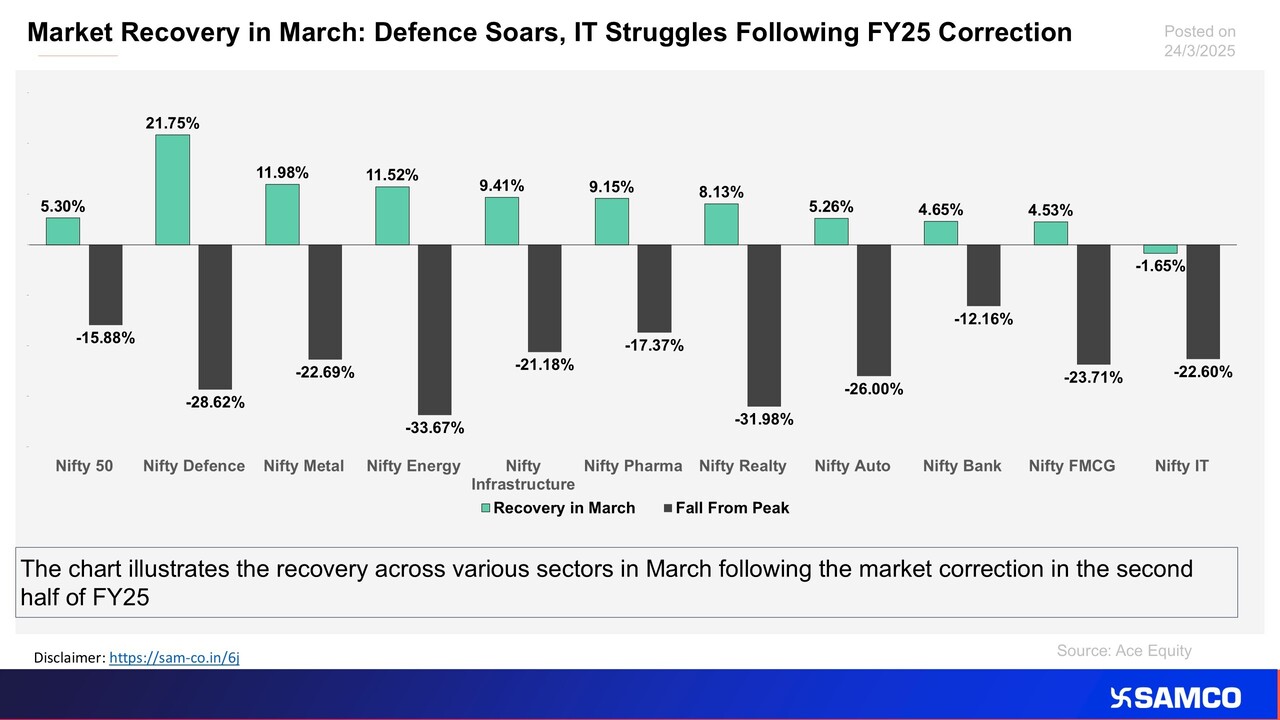
The chart displays the performance of different indices after the steep market correction
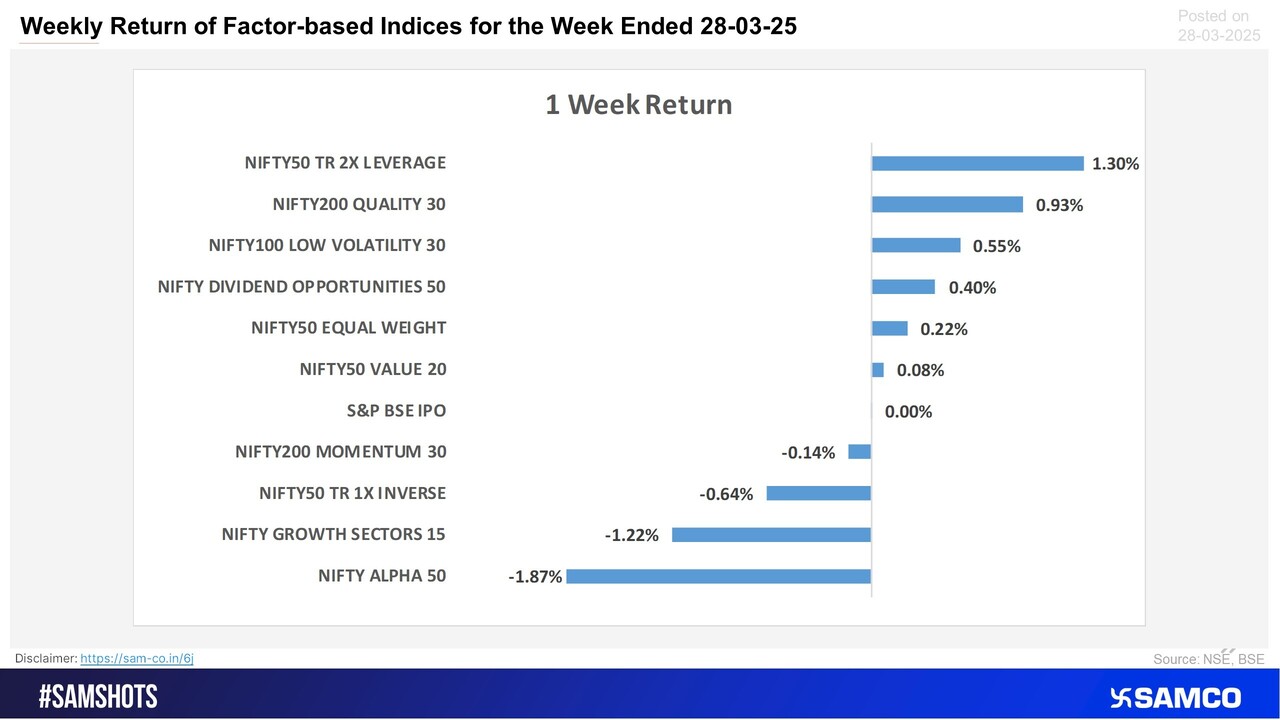
Quality factor outperformed Growth, Momentum and Alpha factors this week
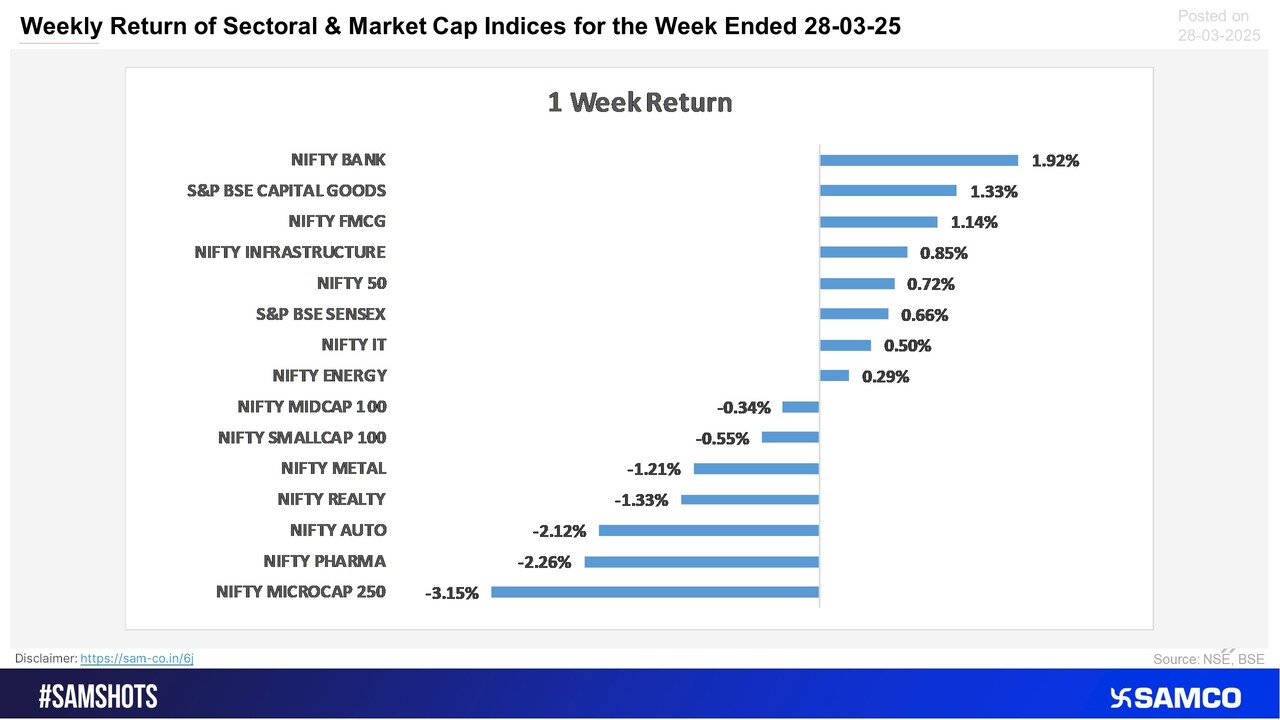
Bank sector led the market gains this week, while micro caps, Pharma and Auto stocks struggled
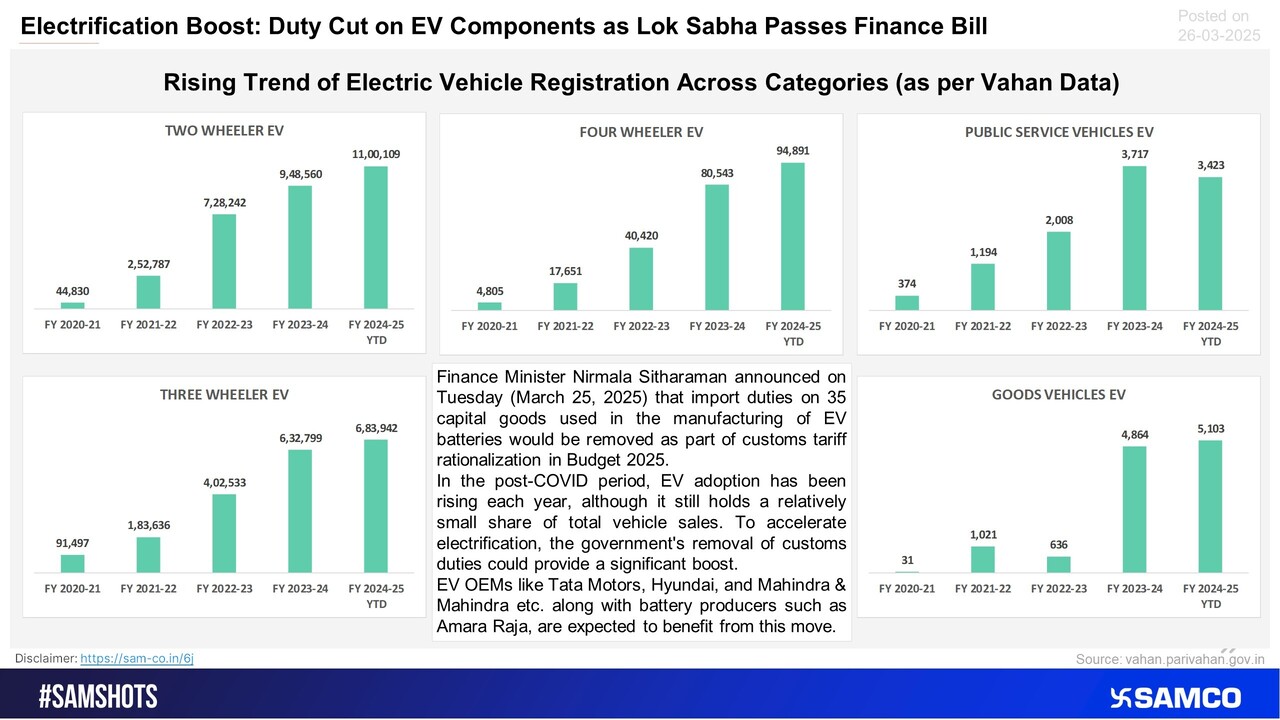
Highlights of rising electrification trend and duty cut by Government to boost the pace.
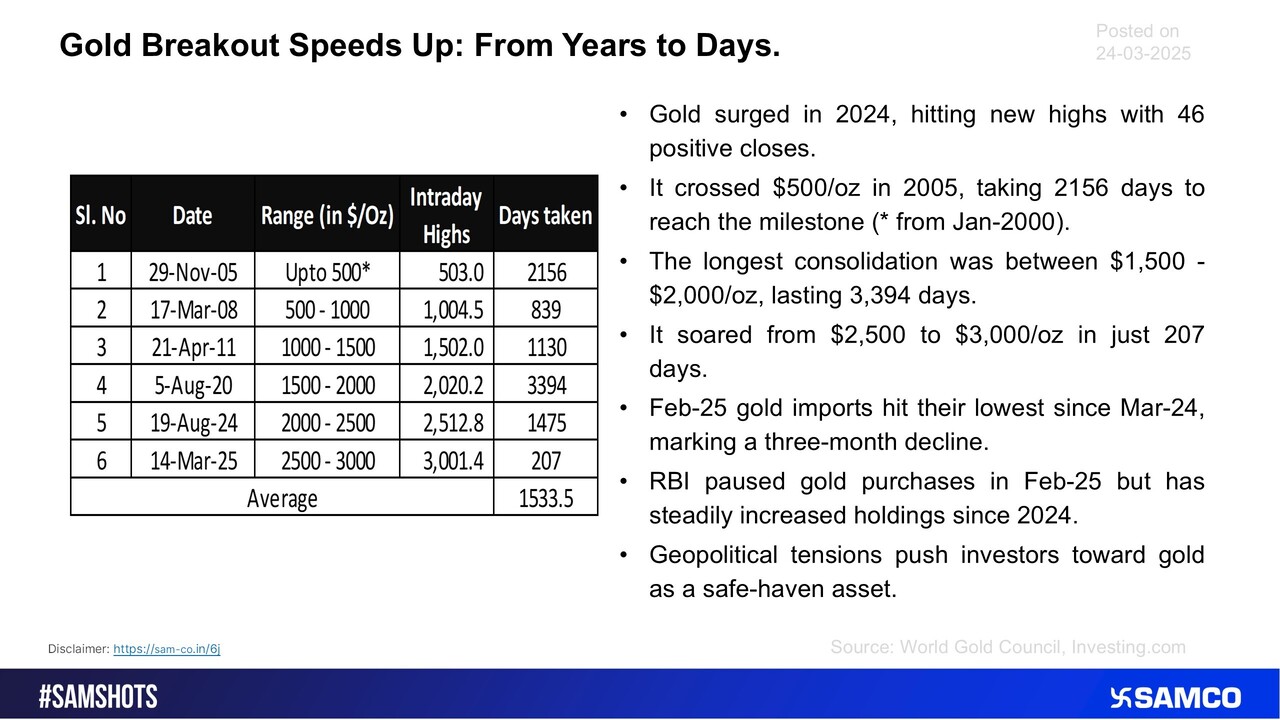
The below table presents the time taken by Gold to break out from each range.
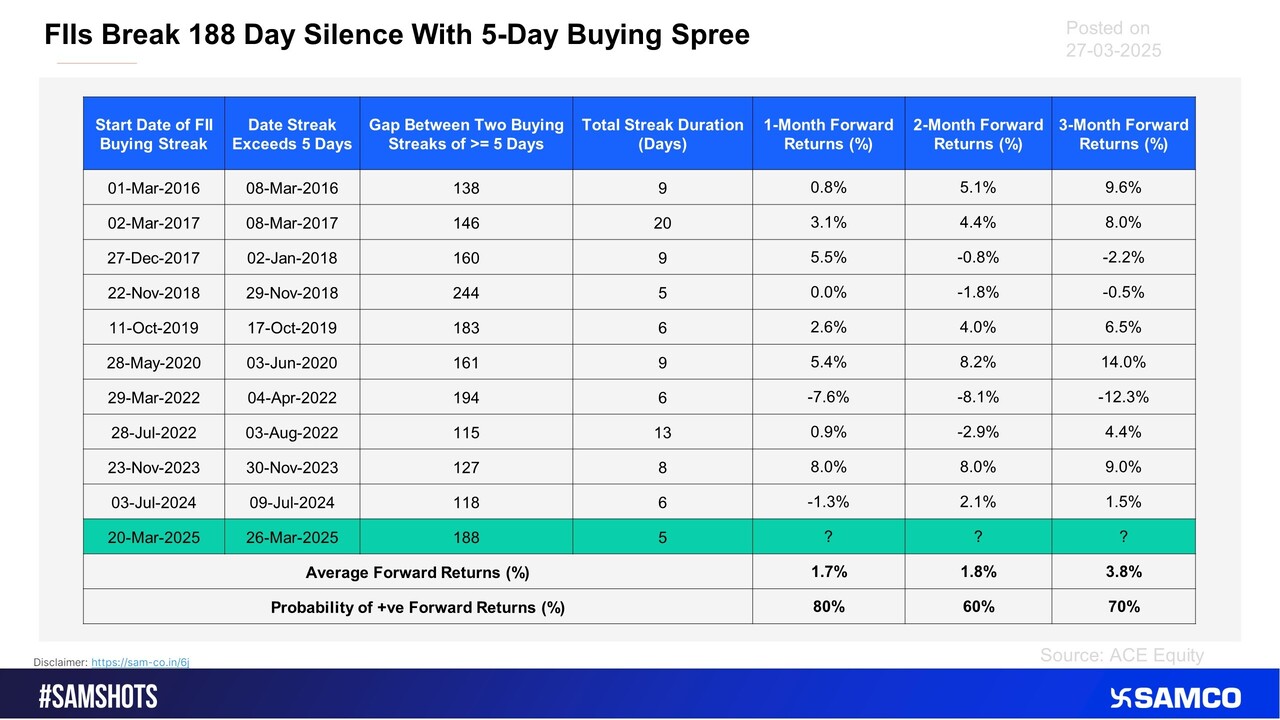
The table highlights instances over the past 10 years where Foreign Institutional Investors (FIIs) have engaged in consecutive net buying for at least five days, with a gap of more than 100 days between two such streaks. FIIs surpassed the 5-day buying st
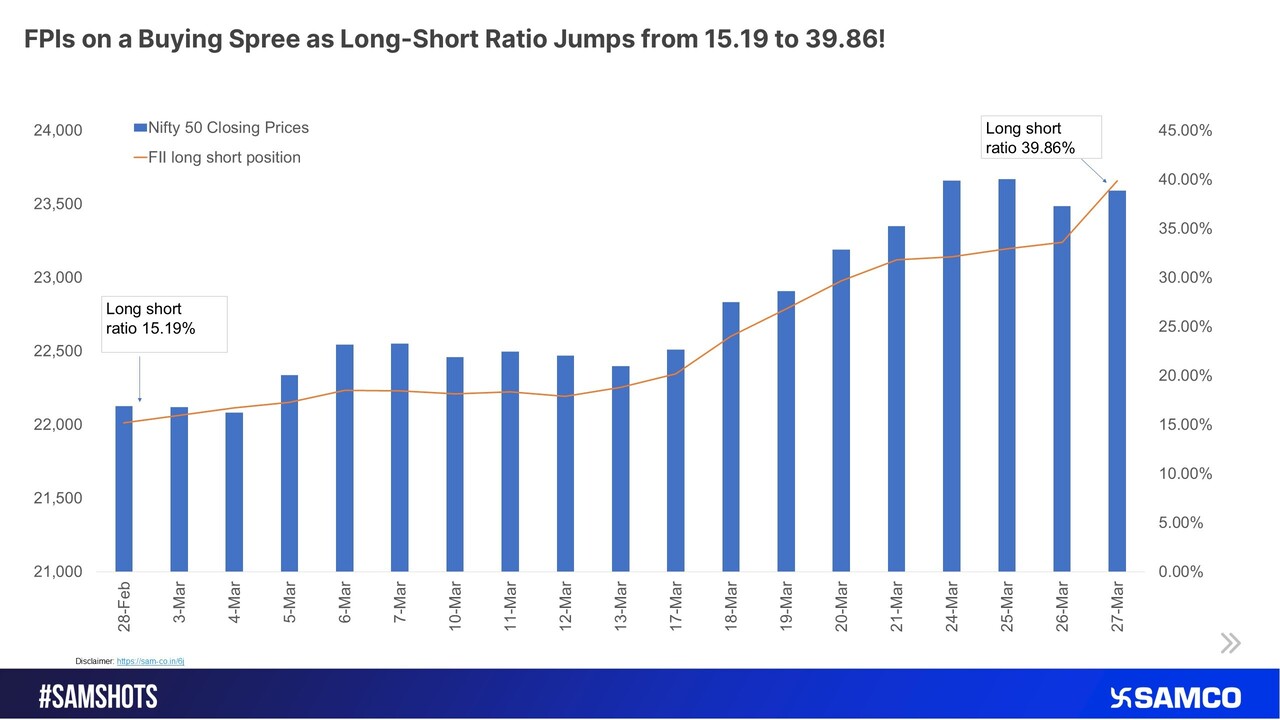
FPI Buying Momentum Strengthens as Long-Short Ratio Sees a Sharp Rise
BHEL Breaks Free—New Rally on the Horizon!
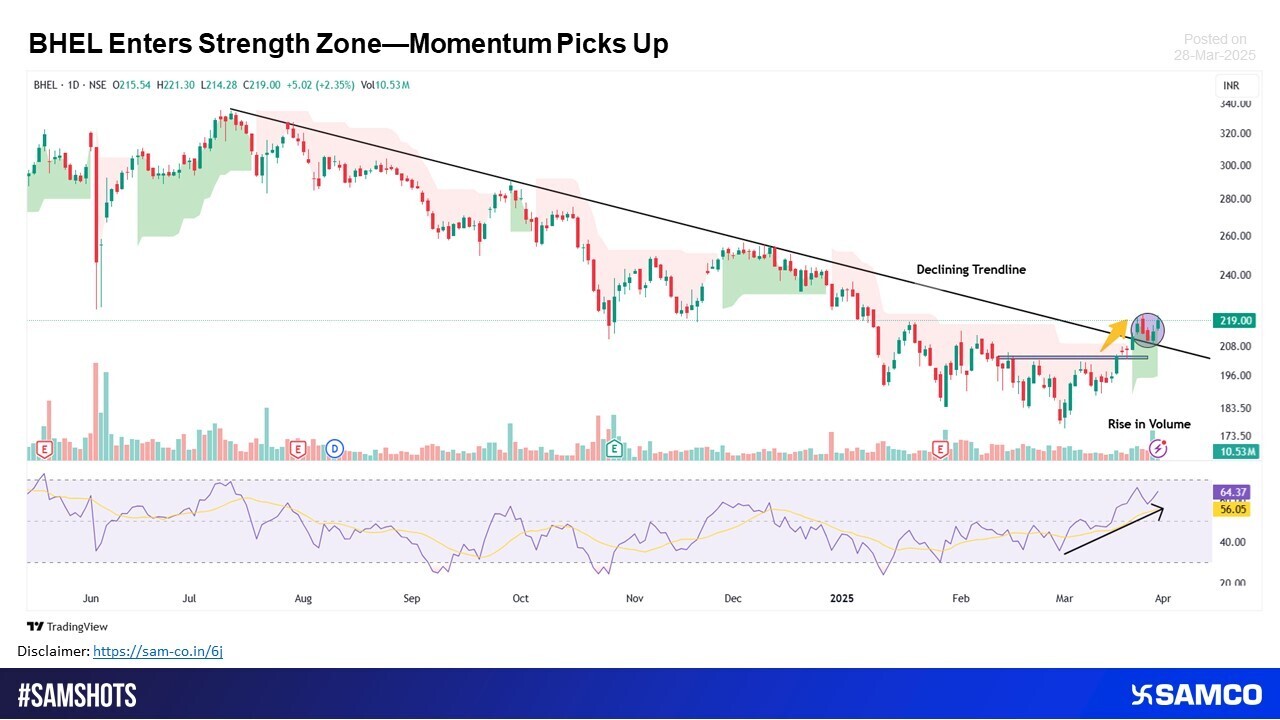
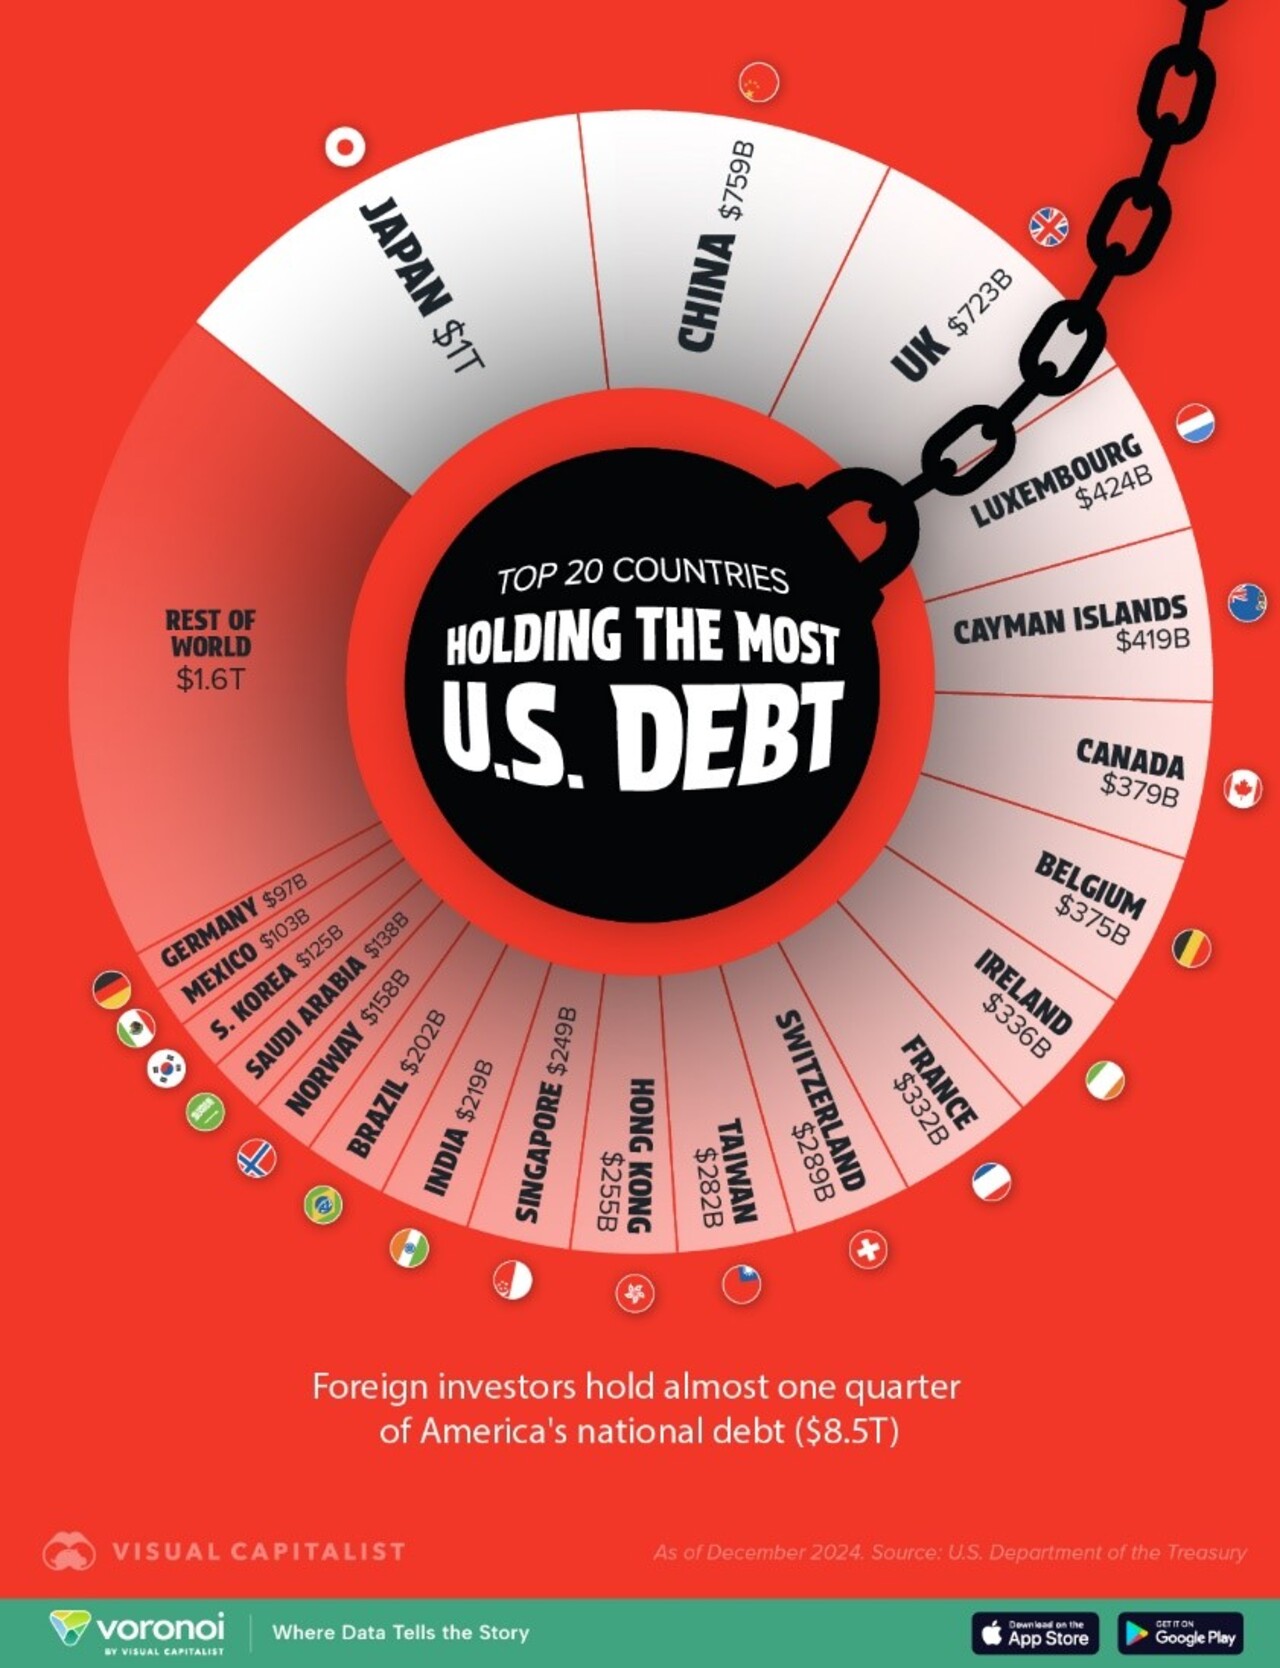
Image Source: @VisualCap (Twitter)
 Easy & quick
1. Register on SCORES portal
2. Mandatory details for filling complaints on SCORES
Name | PAN | Address | Mobile | Number | E-mail ID
3. Benefits
Effective Communication
Speedy redressal of the grievances
