Indian markets witnessed a recovery this week, with the Nifty 50 snapping its 10-day losing streak, the longest in two decades. The rebound came after weeks of selling pressure, bringing some relief to the investors.
Smallcap and midcap stocks took center stage, outpacing largecaps as investors showed renewed interest after the recent sharp correction. However, volatility persisted in export-oriented sectors such as pharma, EMS, auto, and steel amid uncertainty around the US tariff policy.
Among commodities, silver outshined gold, ending the week near its all-time high on the back of robust global demand.
While the bounce has improved market sentiment, investors are likely to remain cautious and assess whether the recovery is sustainable.
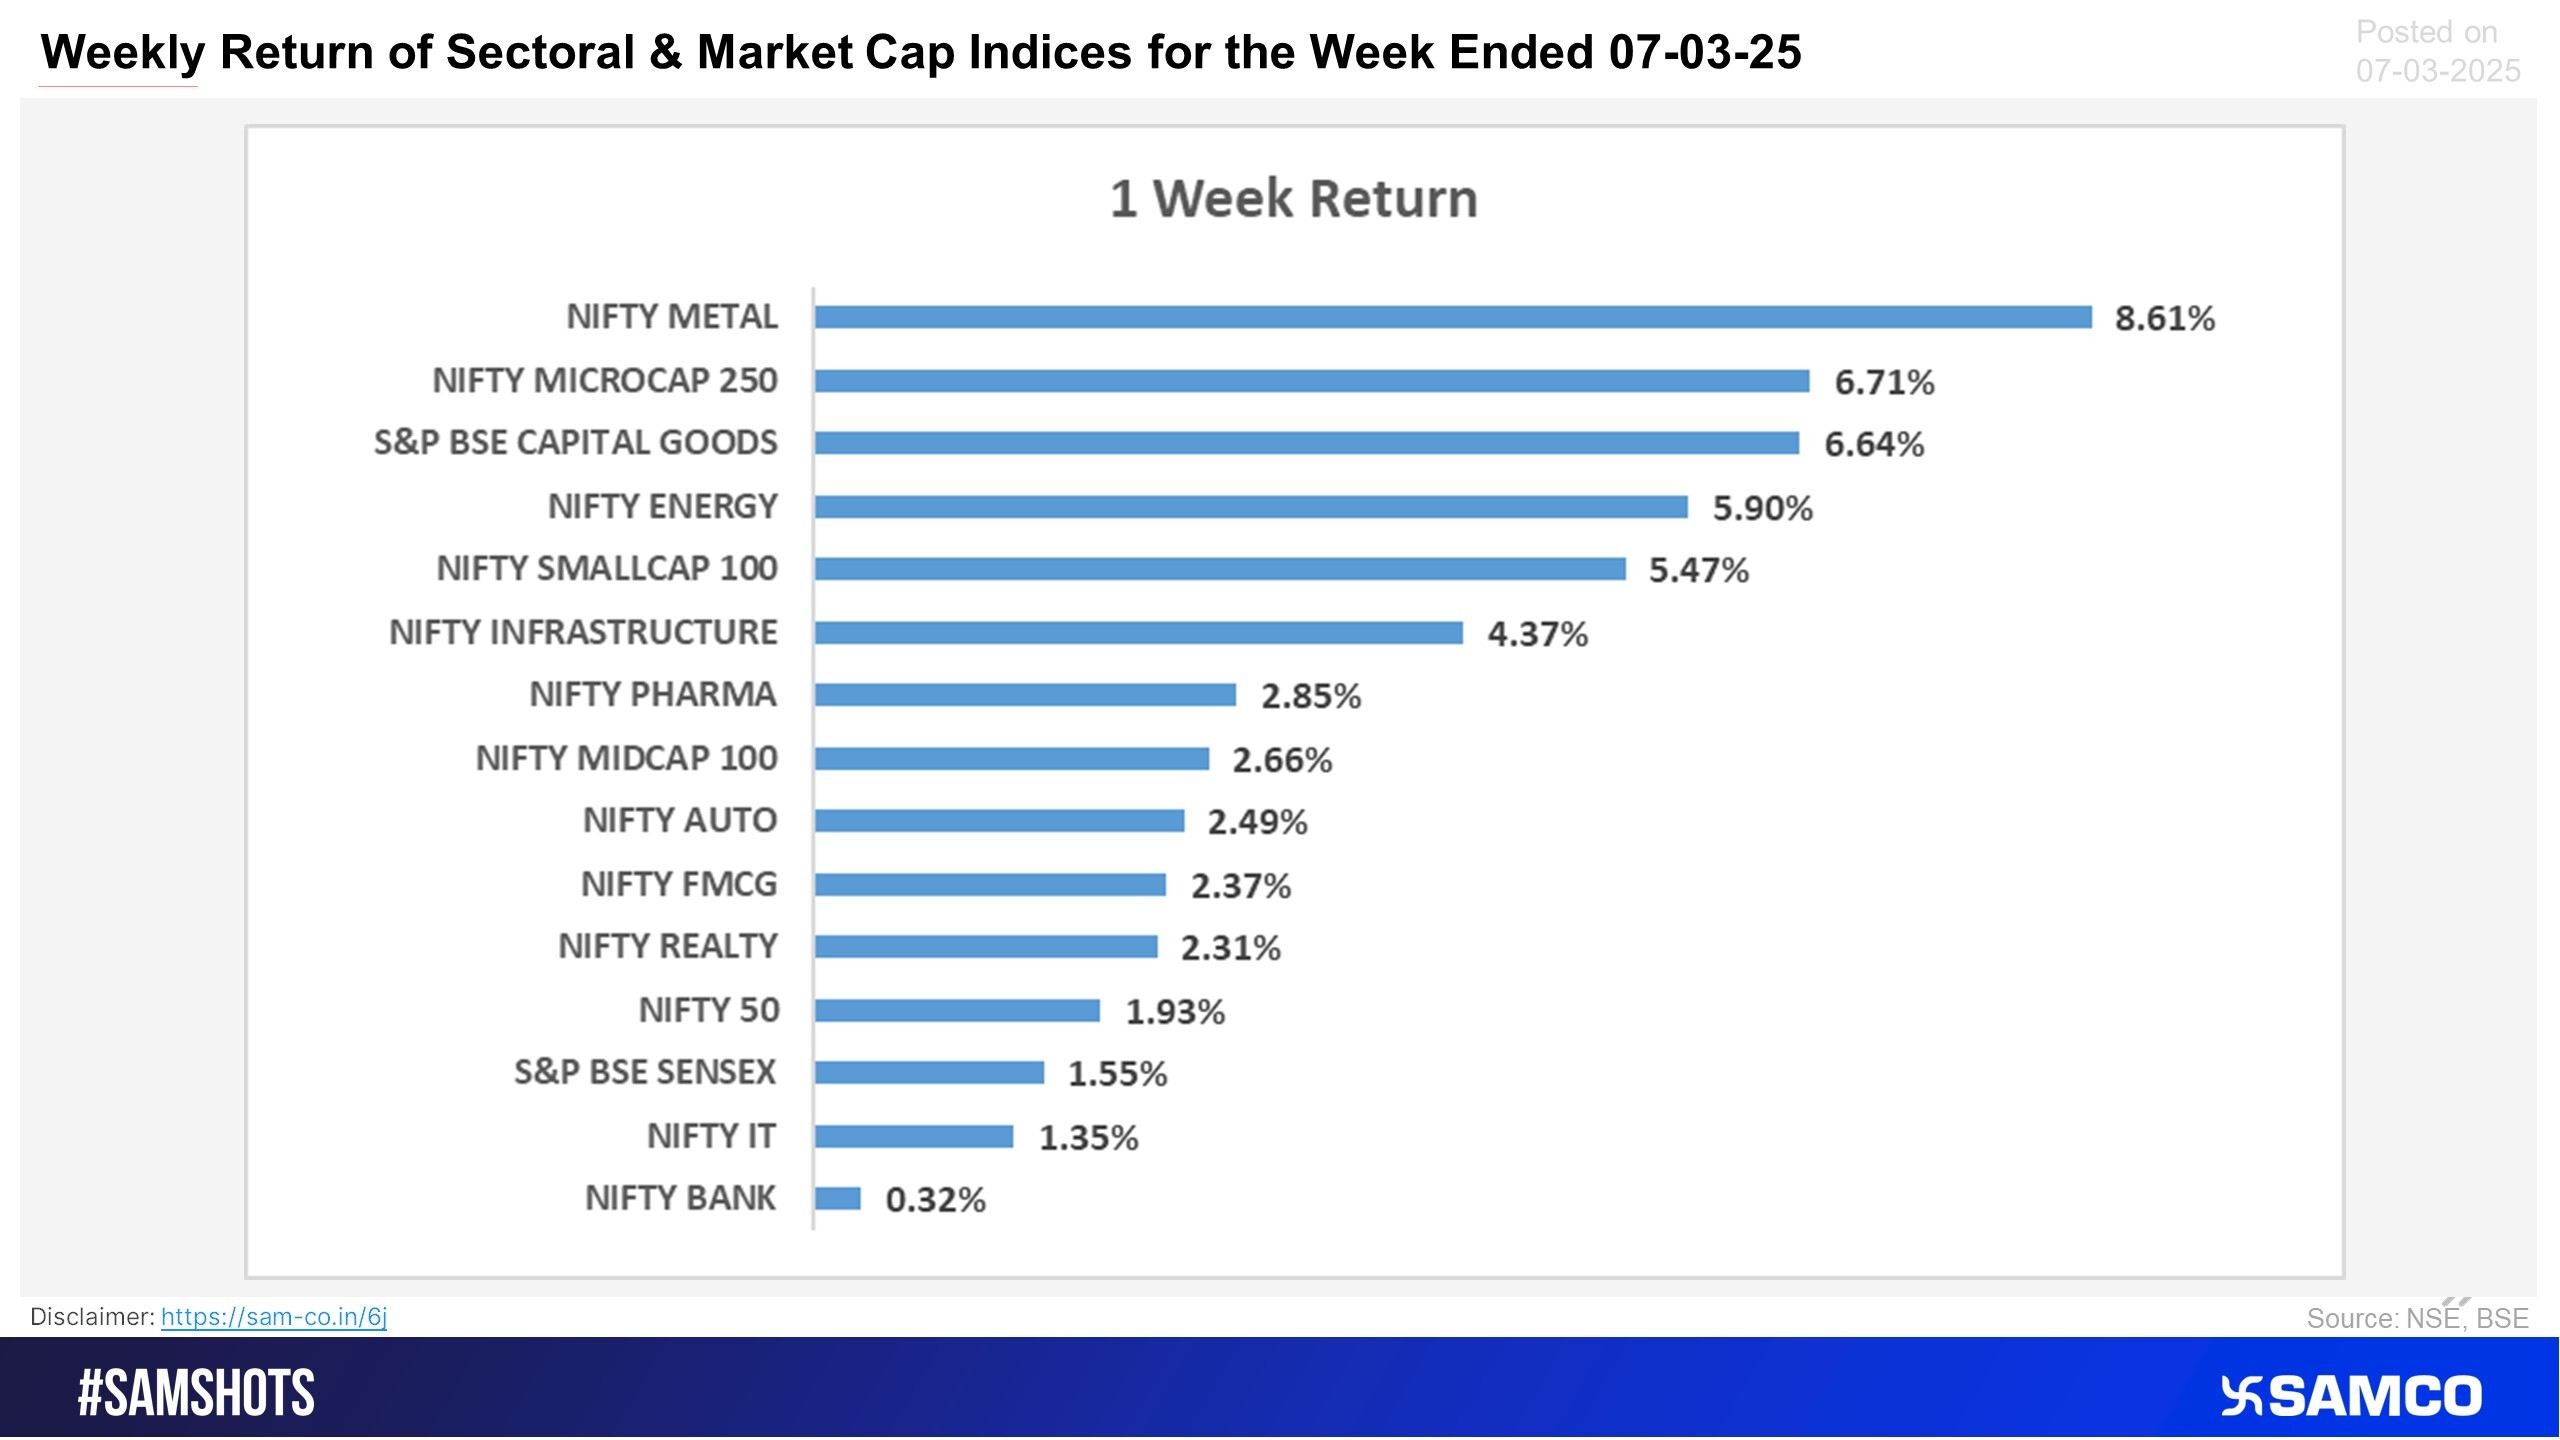
The Nifty 50 ended the week 1.93% higher at 22,553. Nifty Metal led the rally surging by 8.61%.
Scroll down to understand more of such market news and perspectives for the week gone by in easily understandable charts.
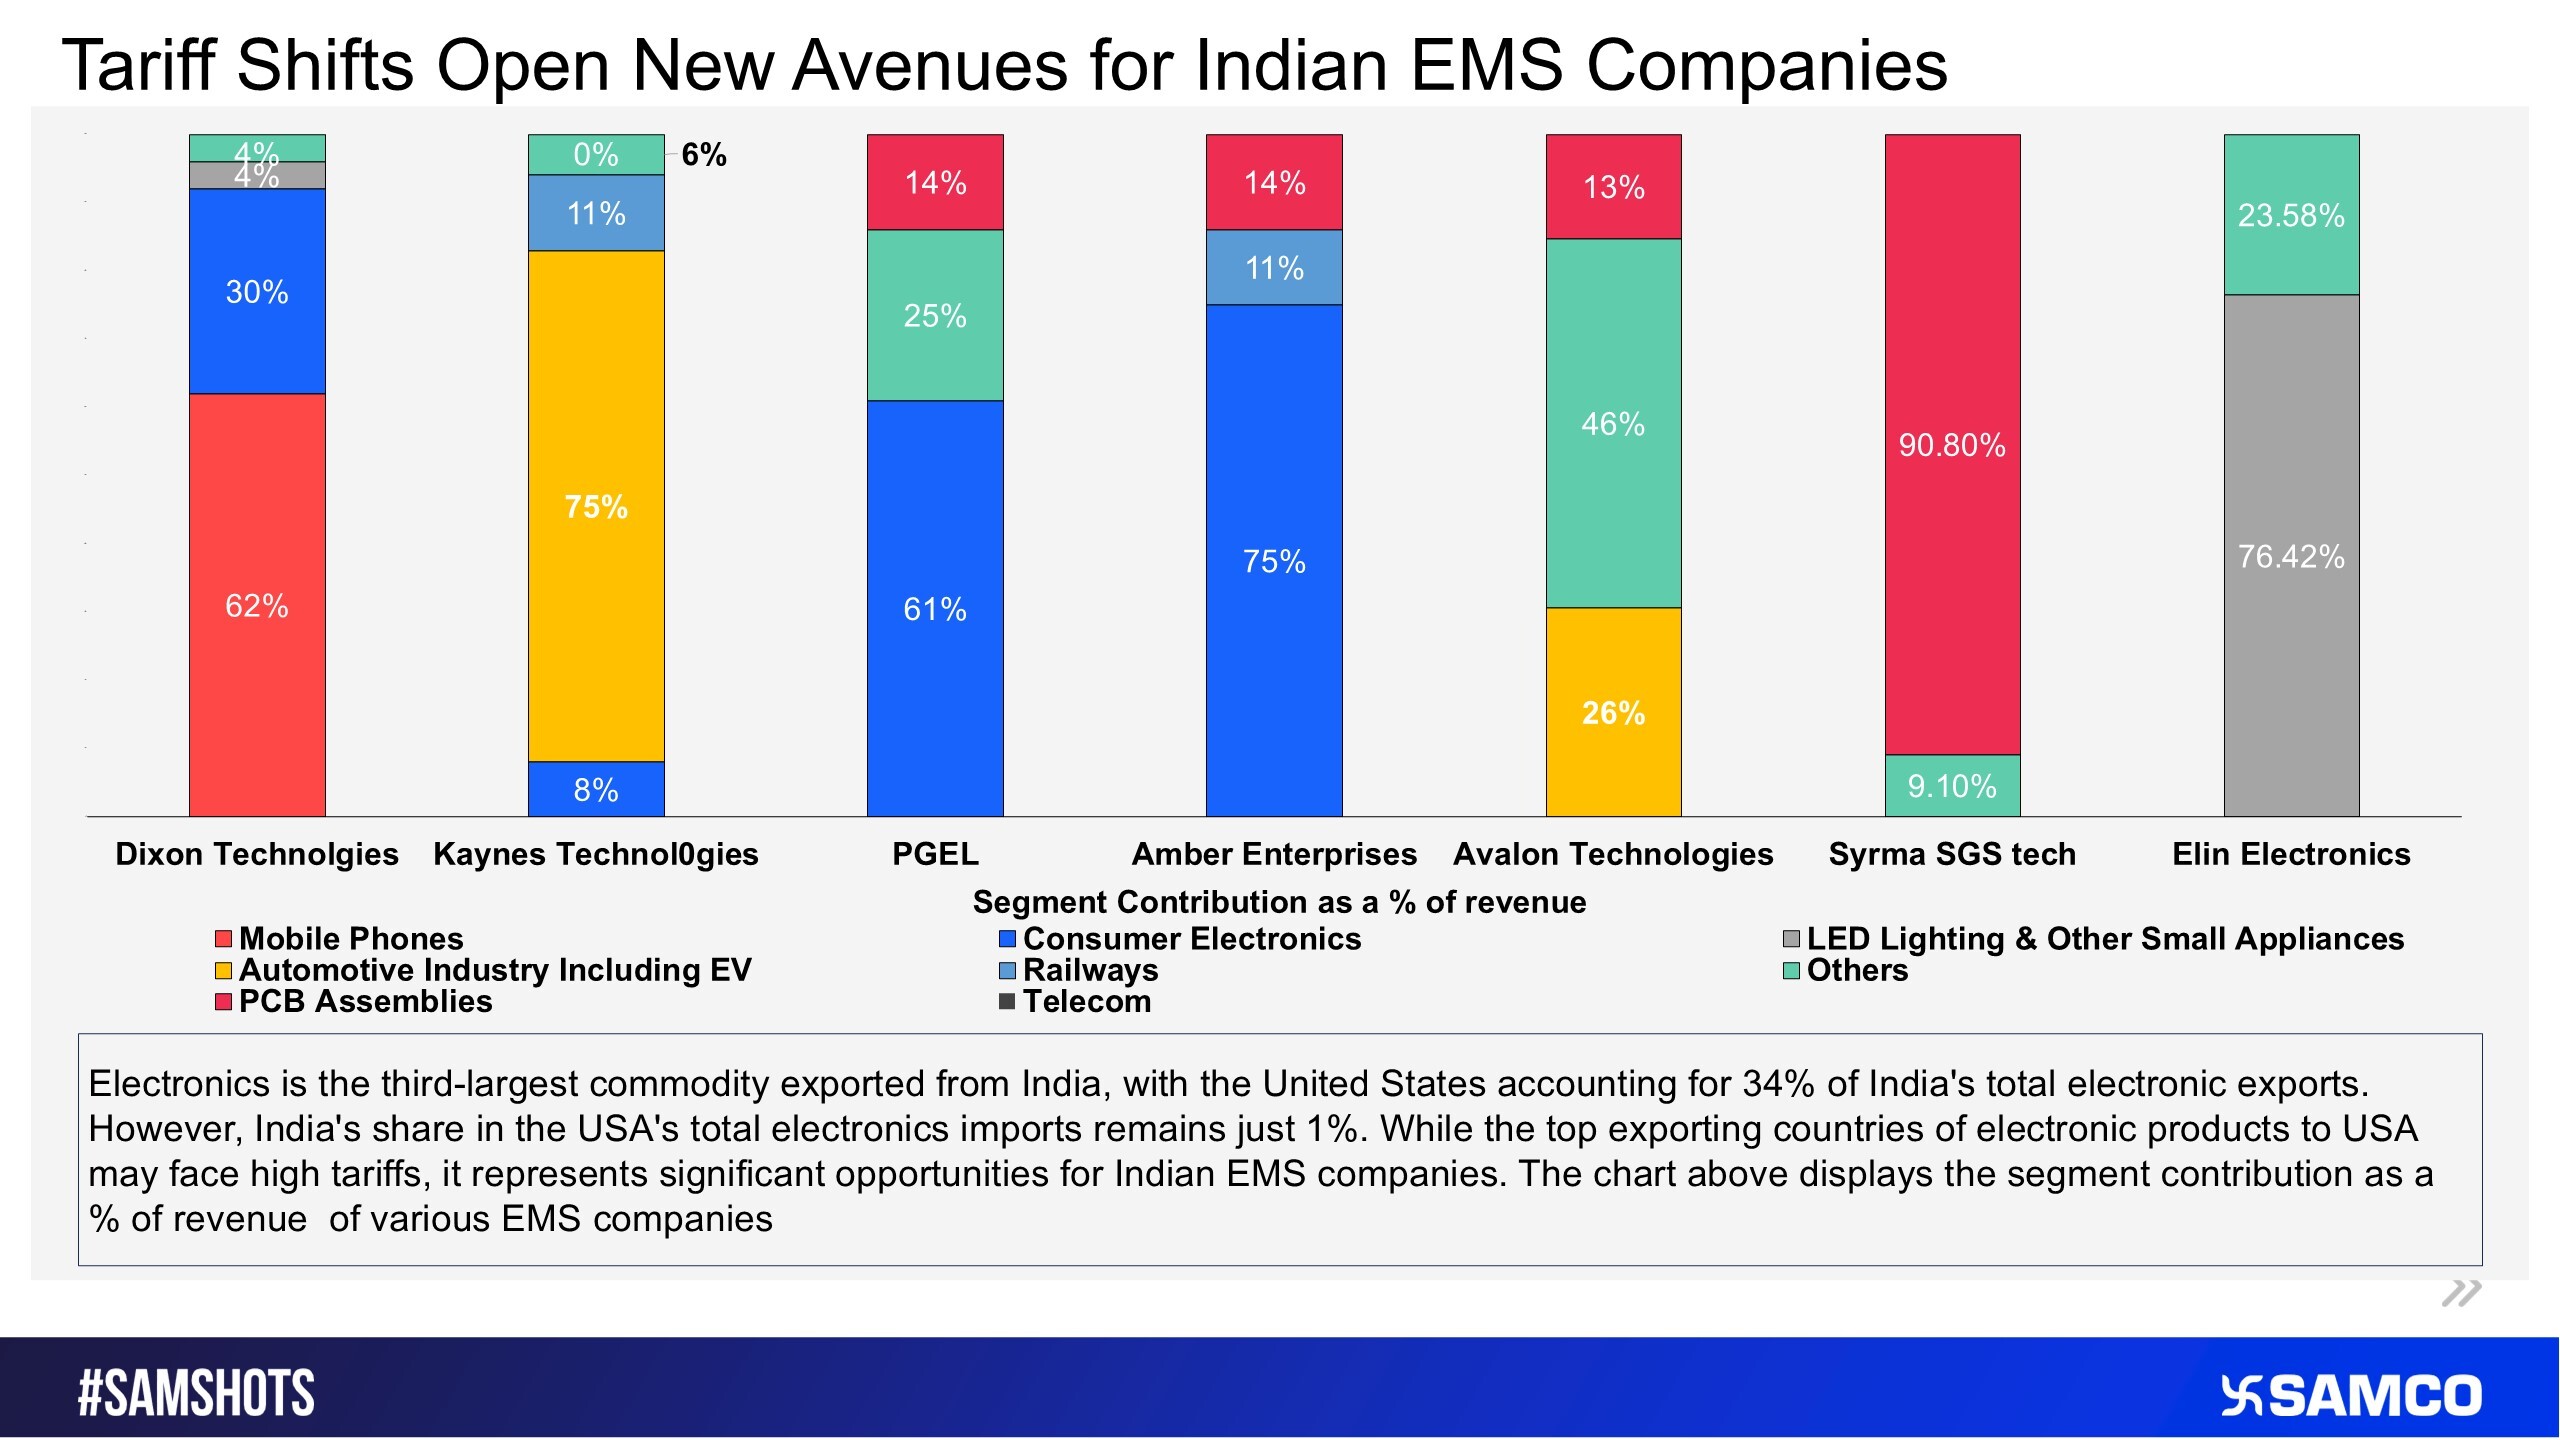
The chart displays the potential impact of tariff on electronic products for Indian EMS Companies.


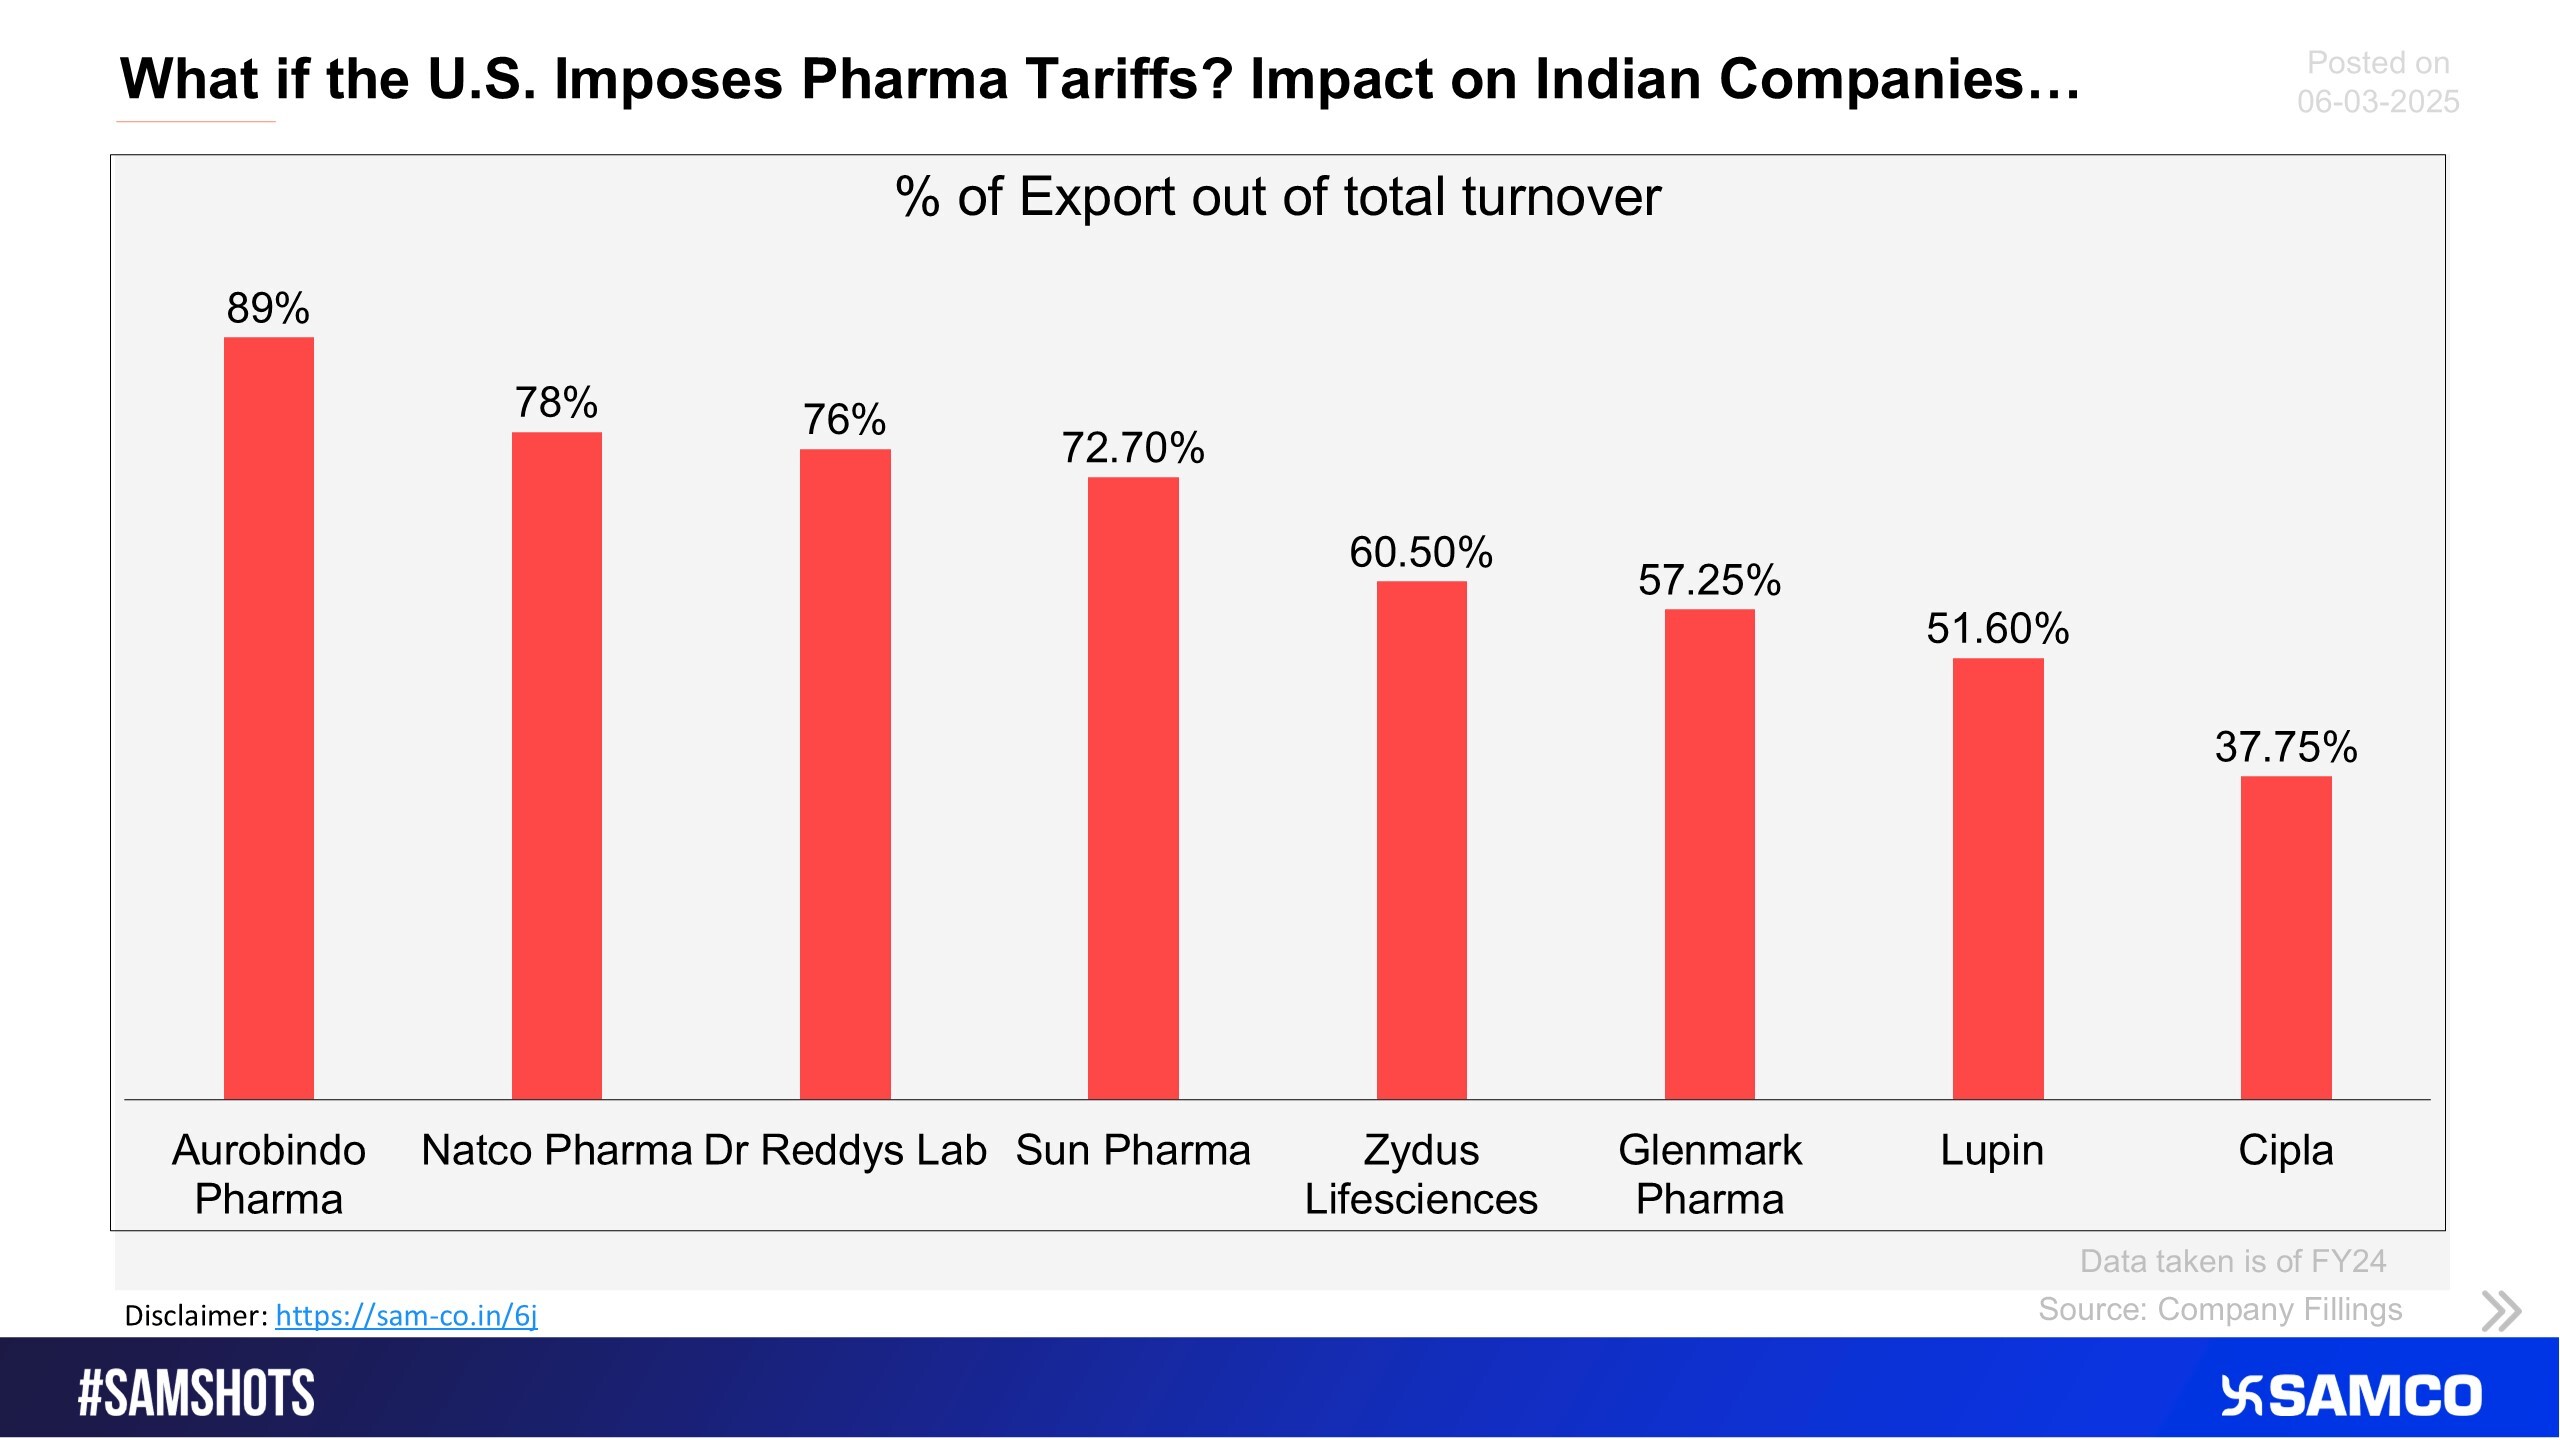
The below chart shows the export data of major Indian pharma companies.
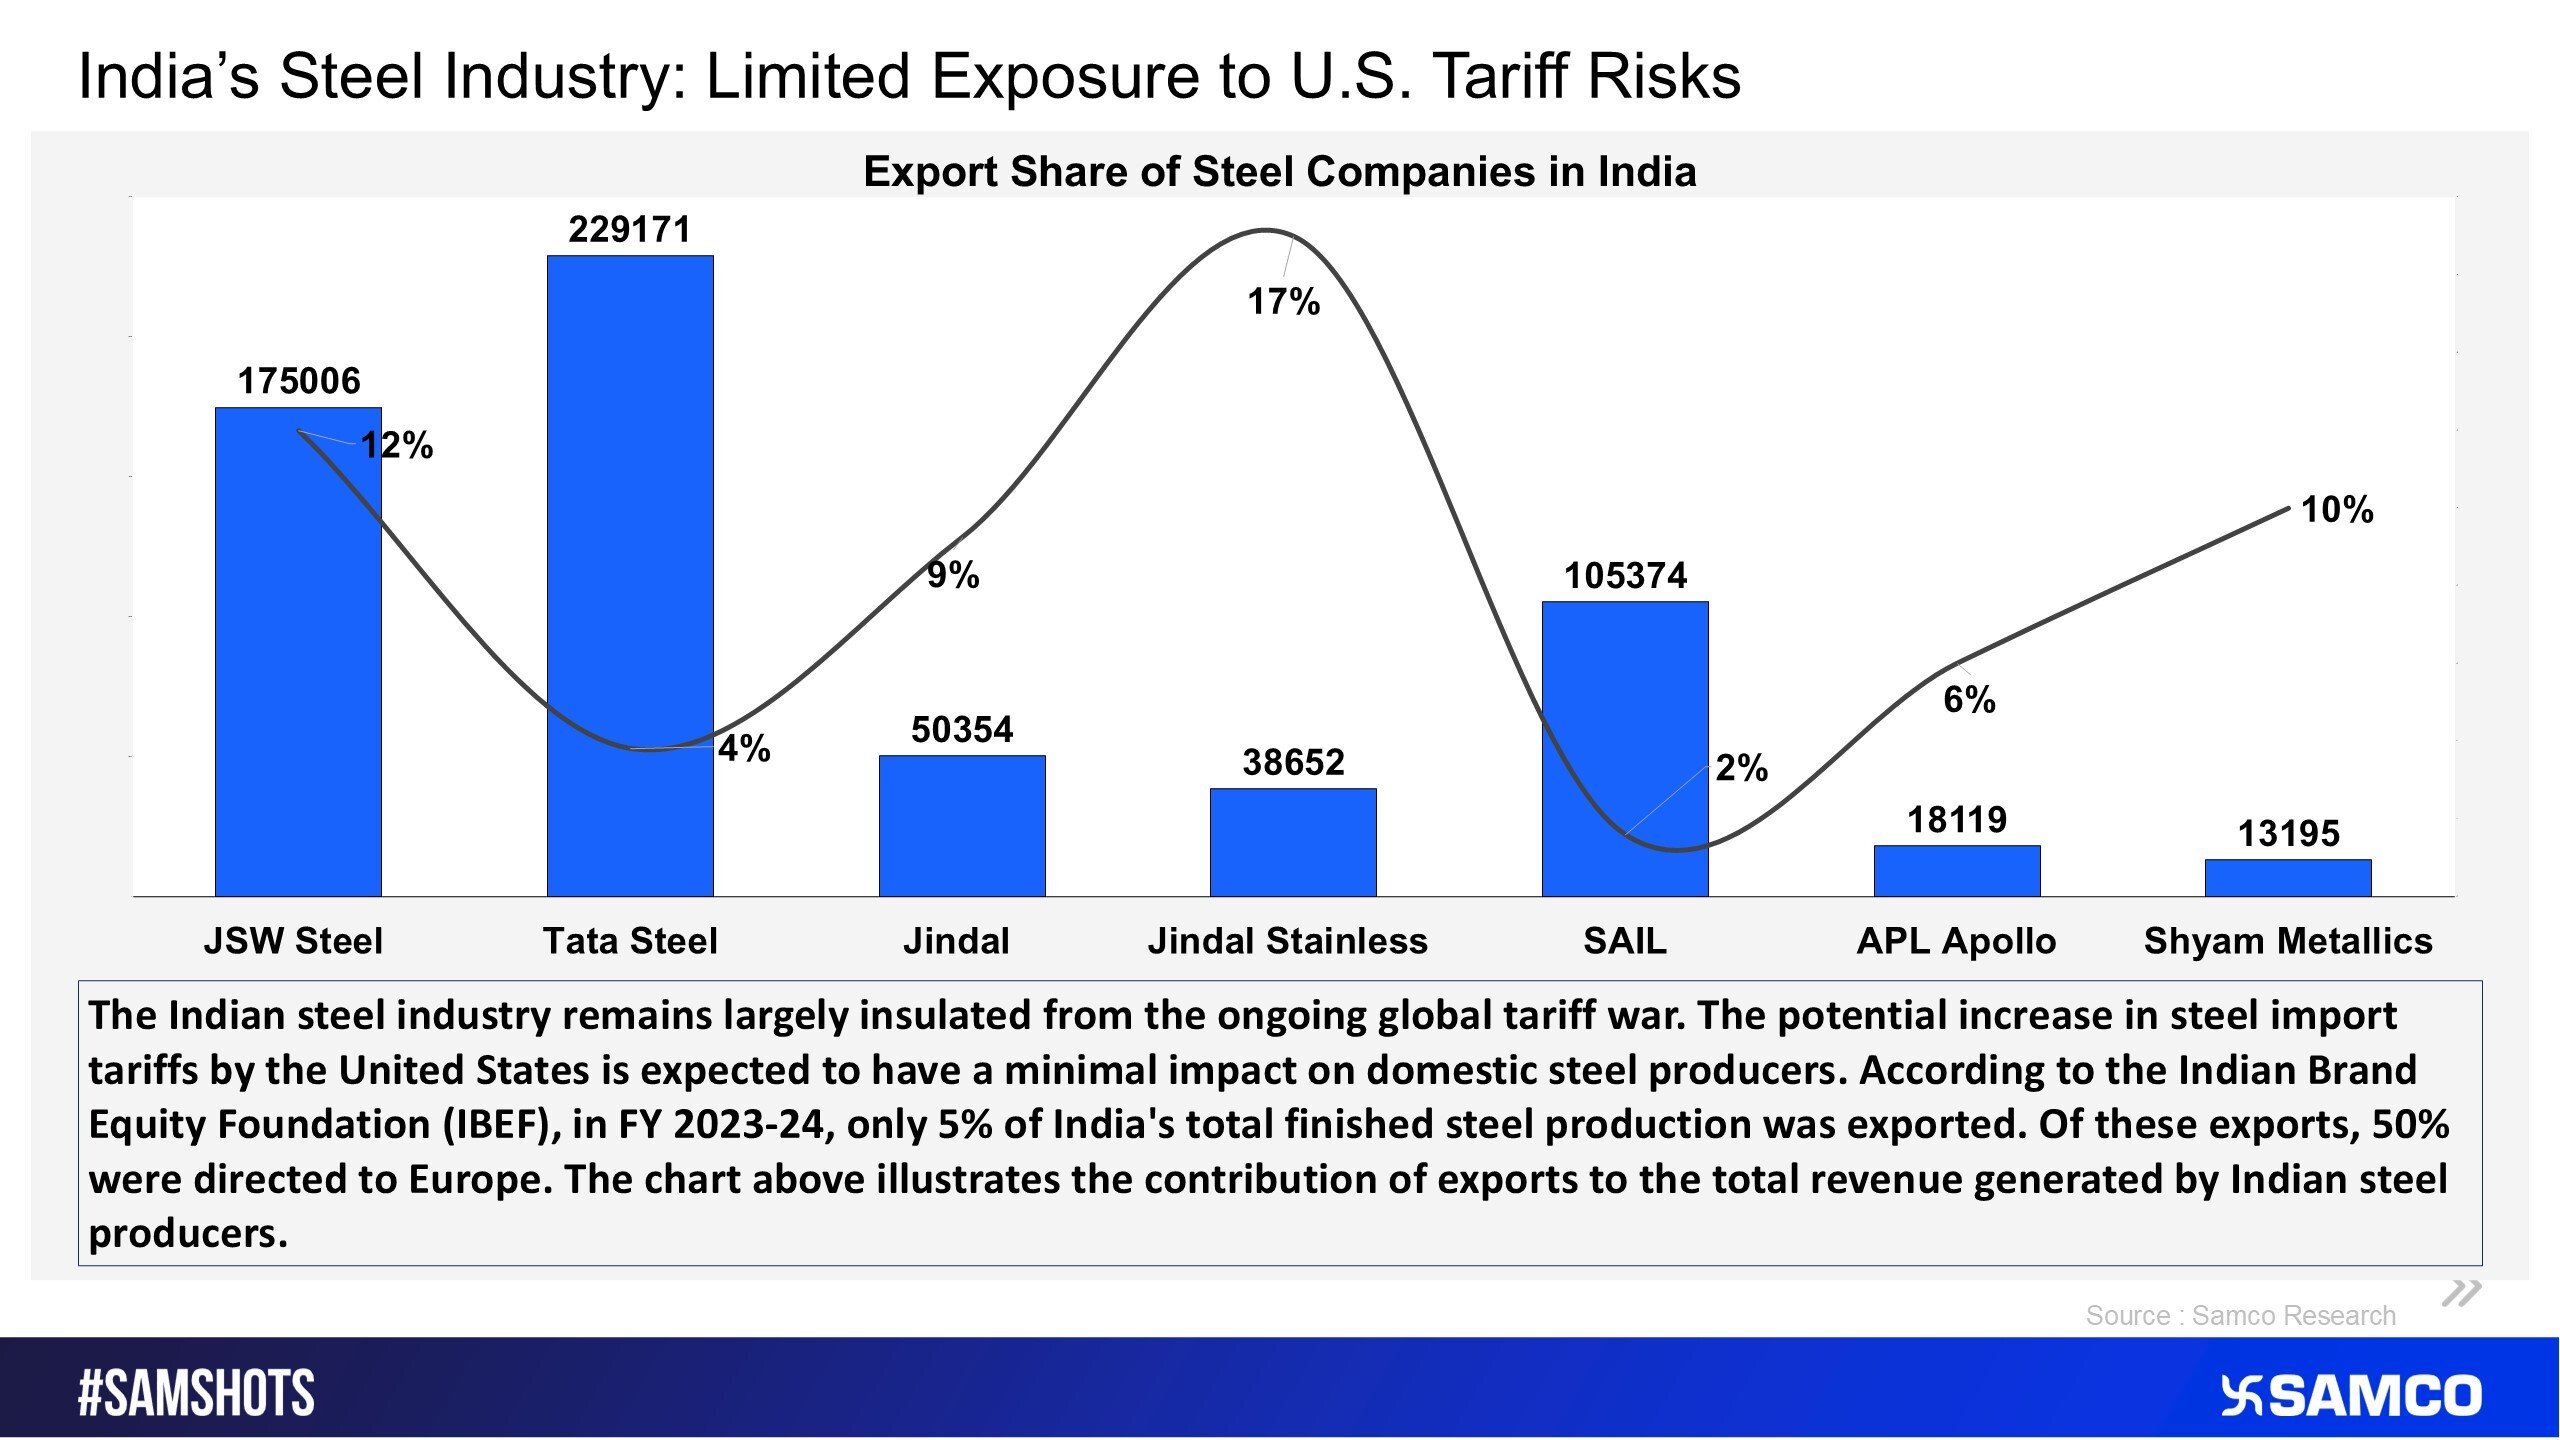
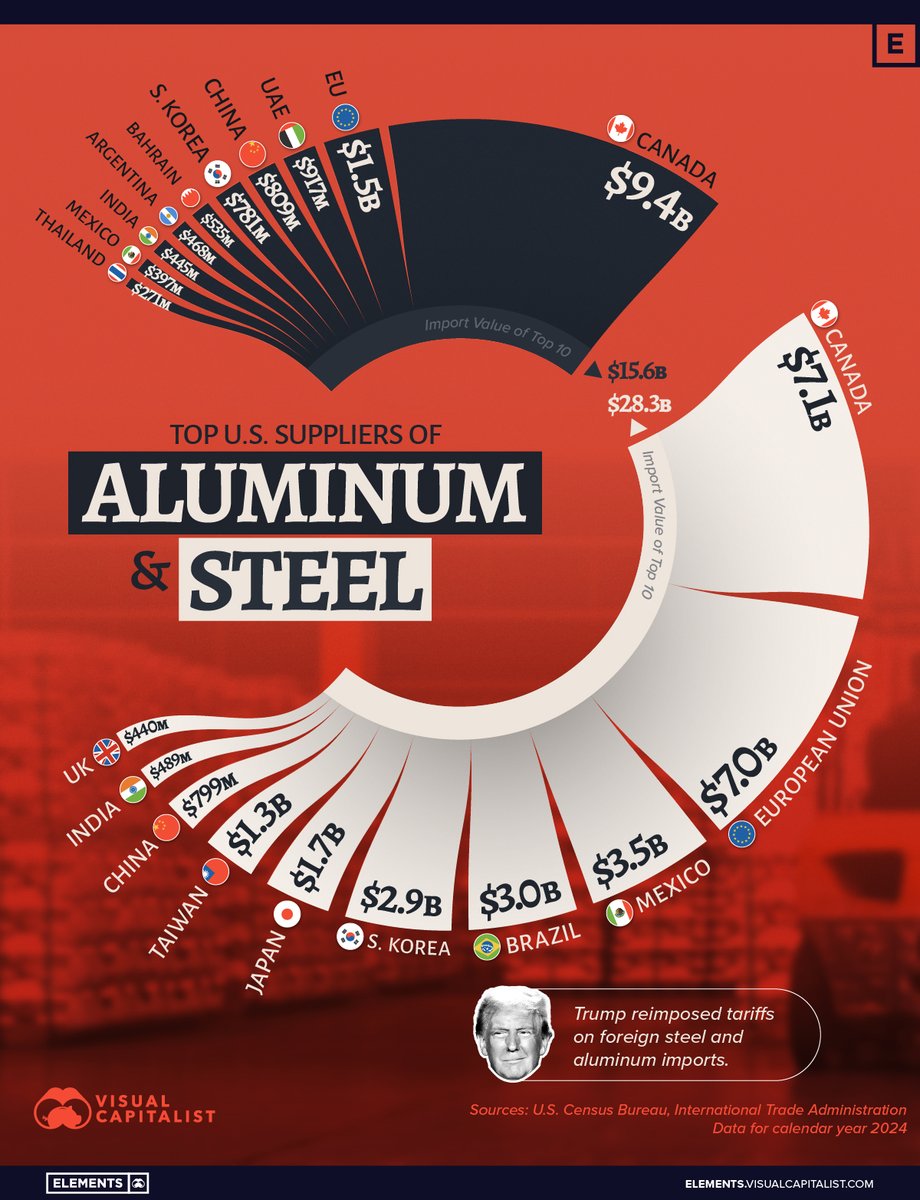
The chart explains how Indian steel players are insulated from US tariff policy.
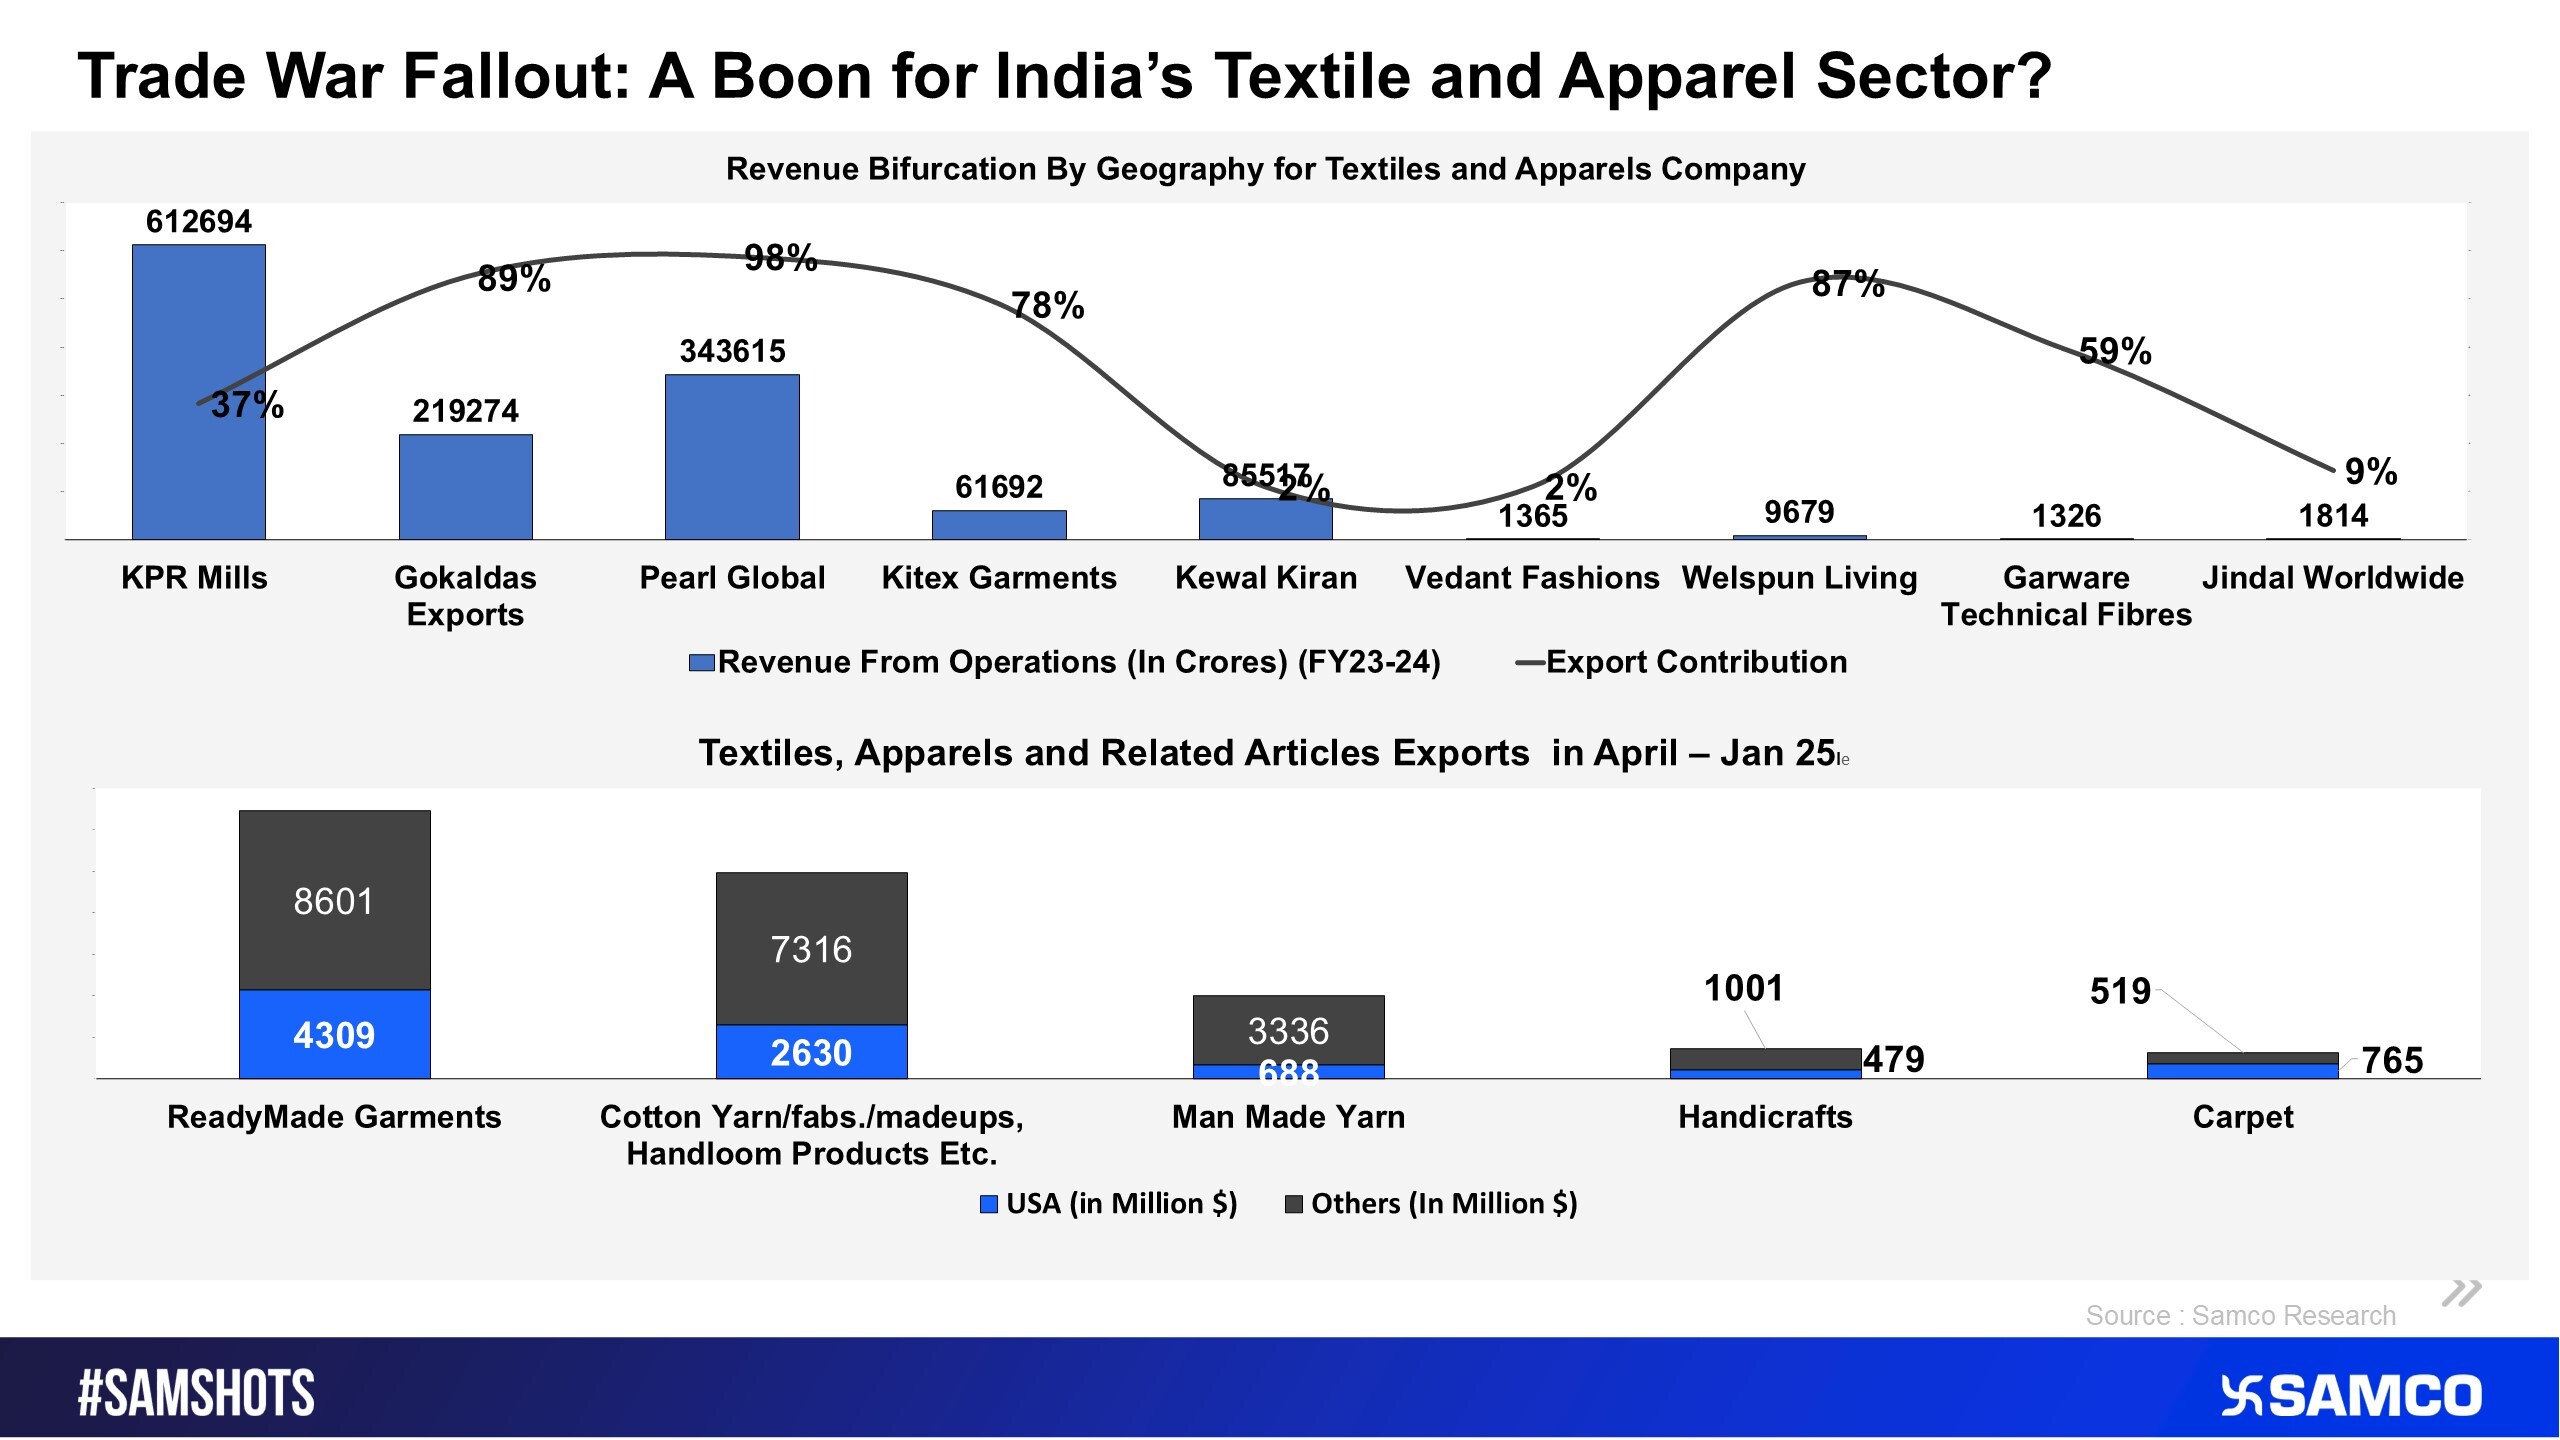
The chart explains how trade war could benefit the textile sector of Indian companies.
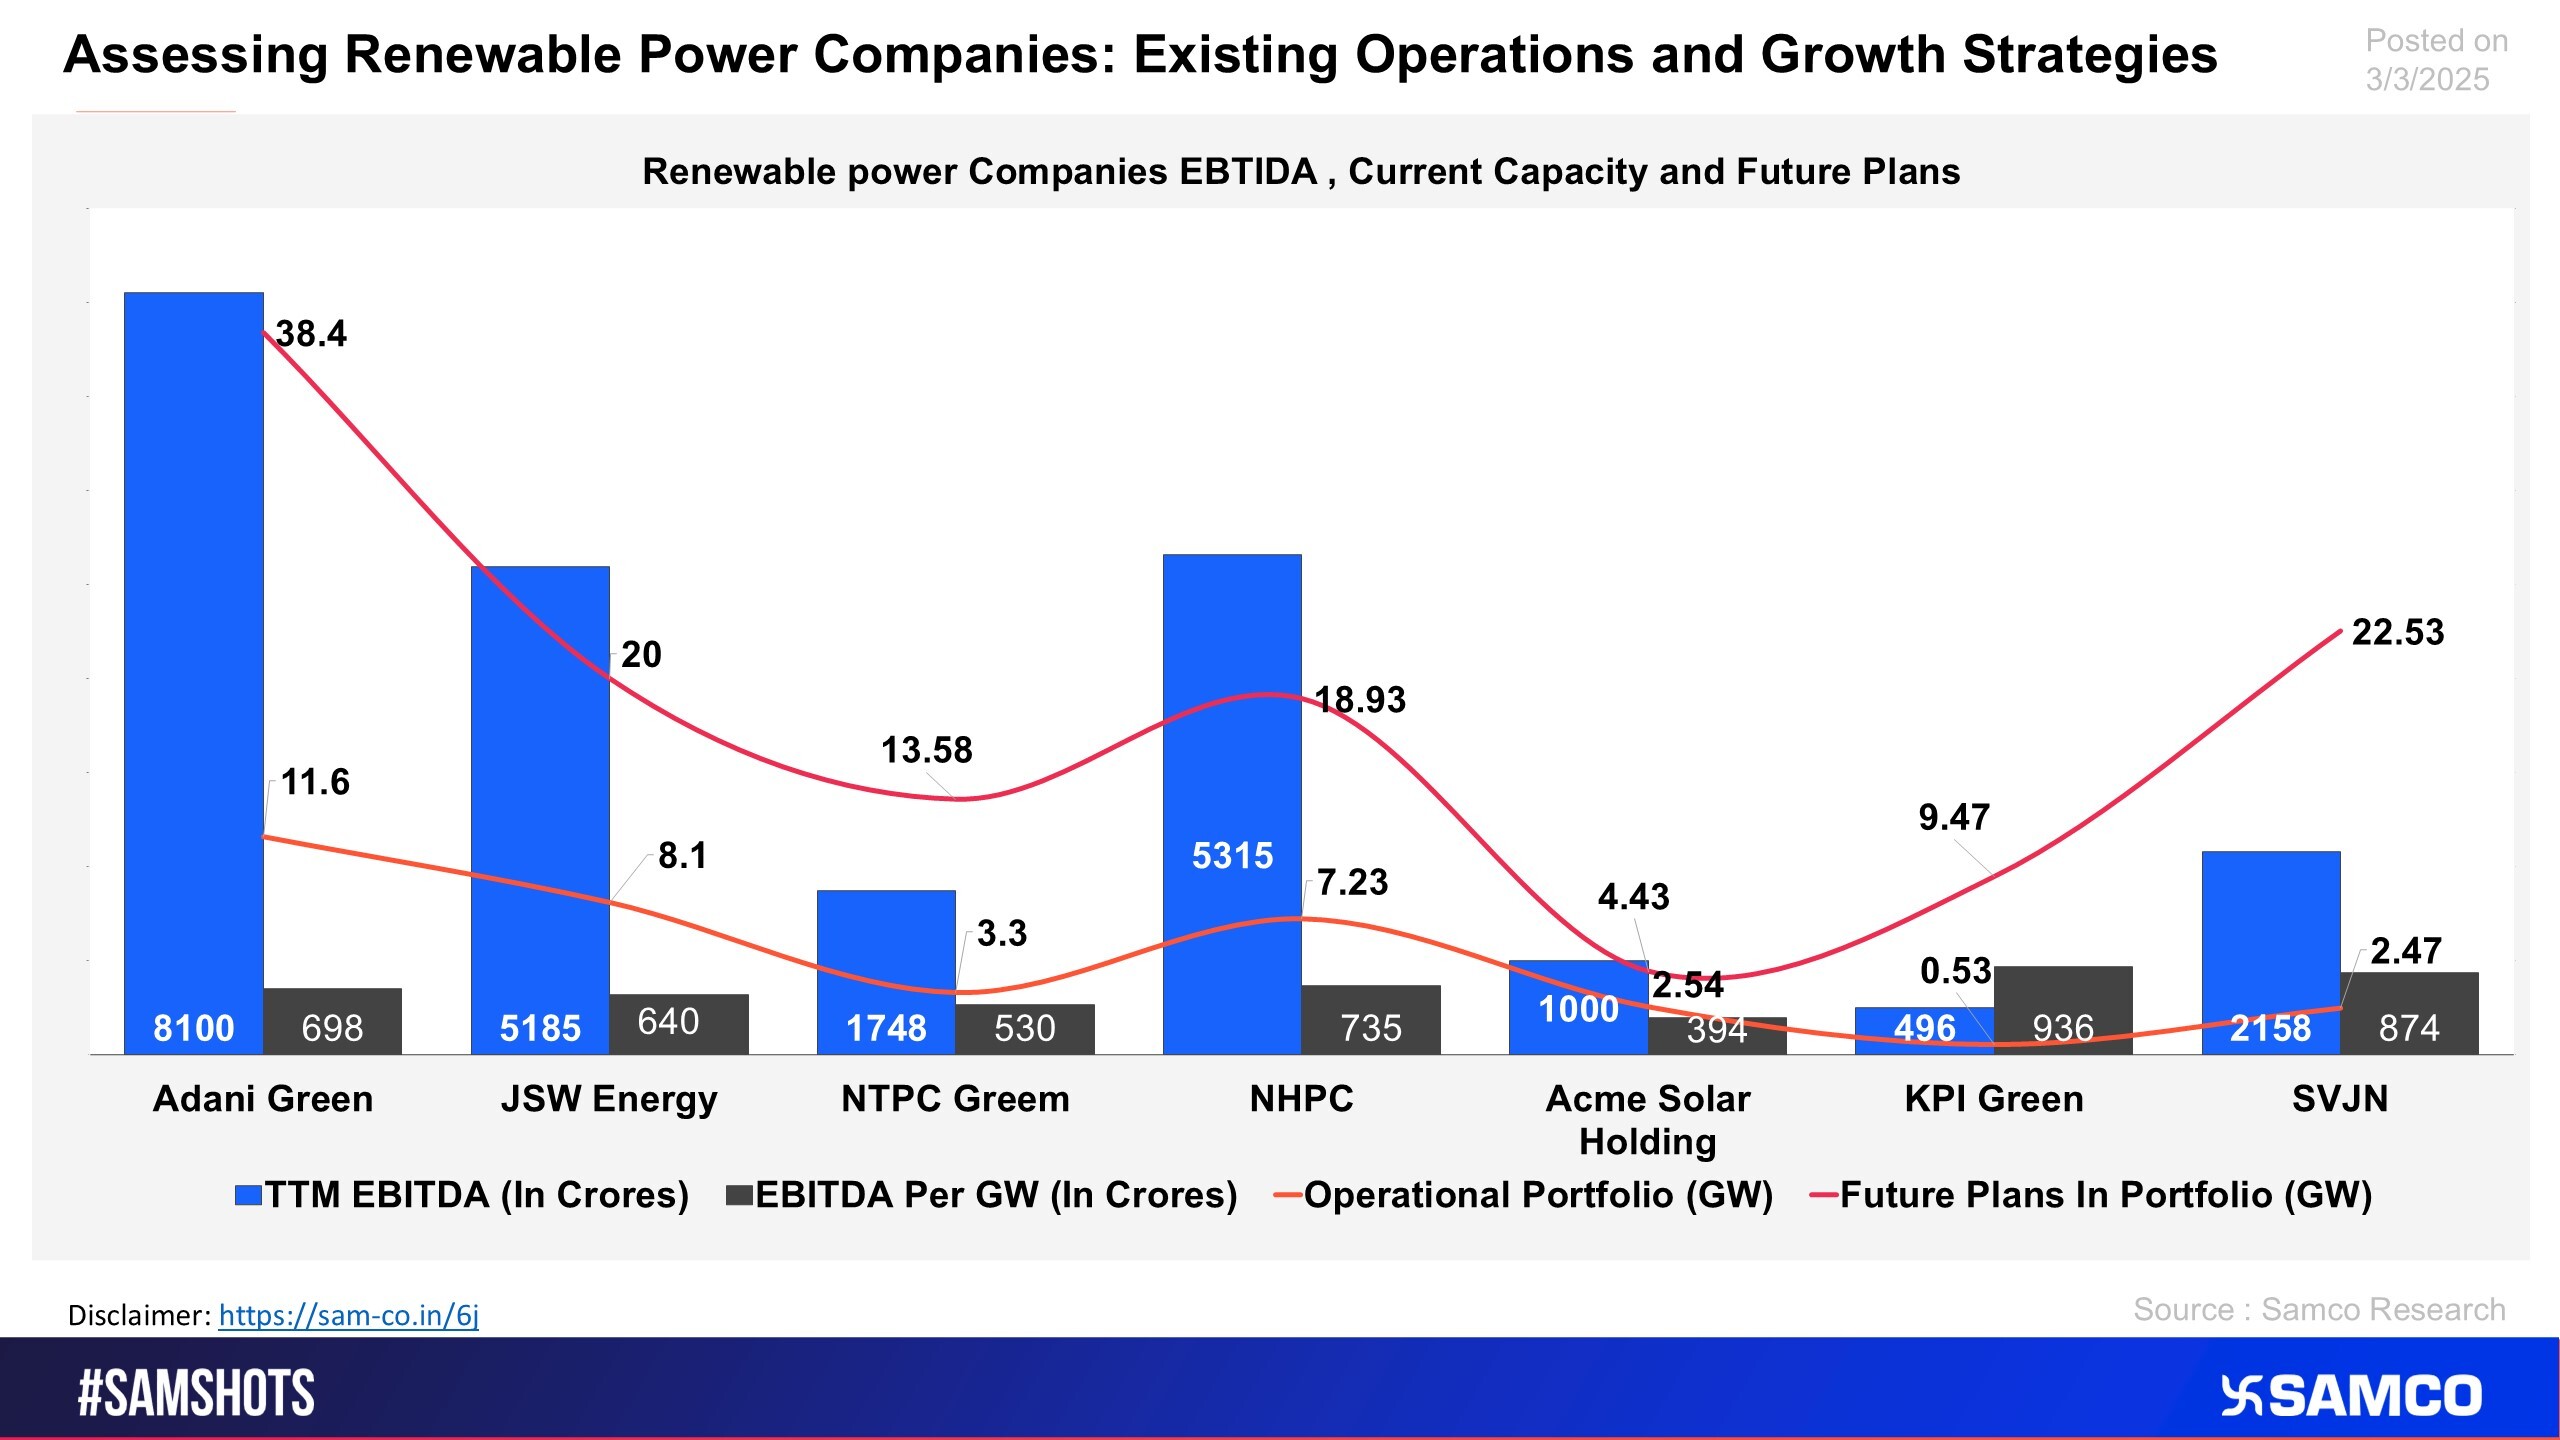
The chart analyses the existing operational capabilities and growth strategy of renewable energy companies.
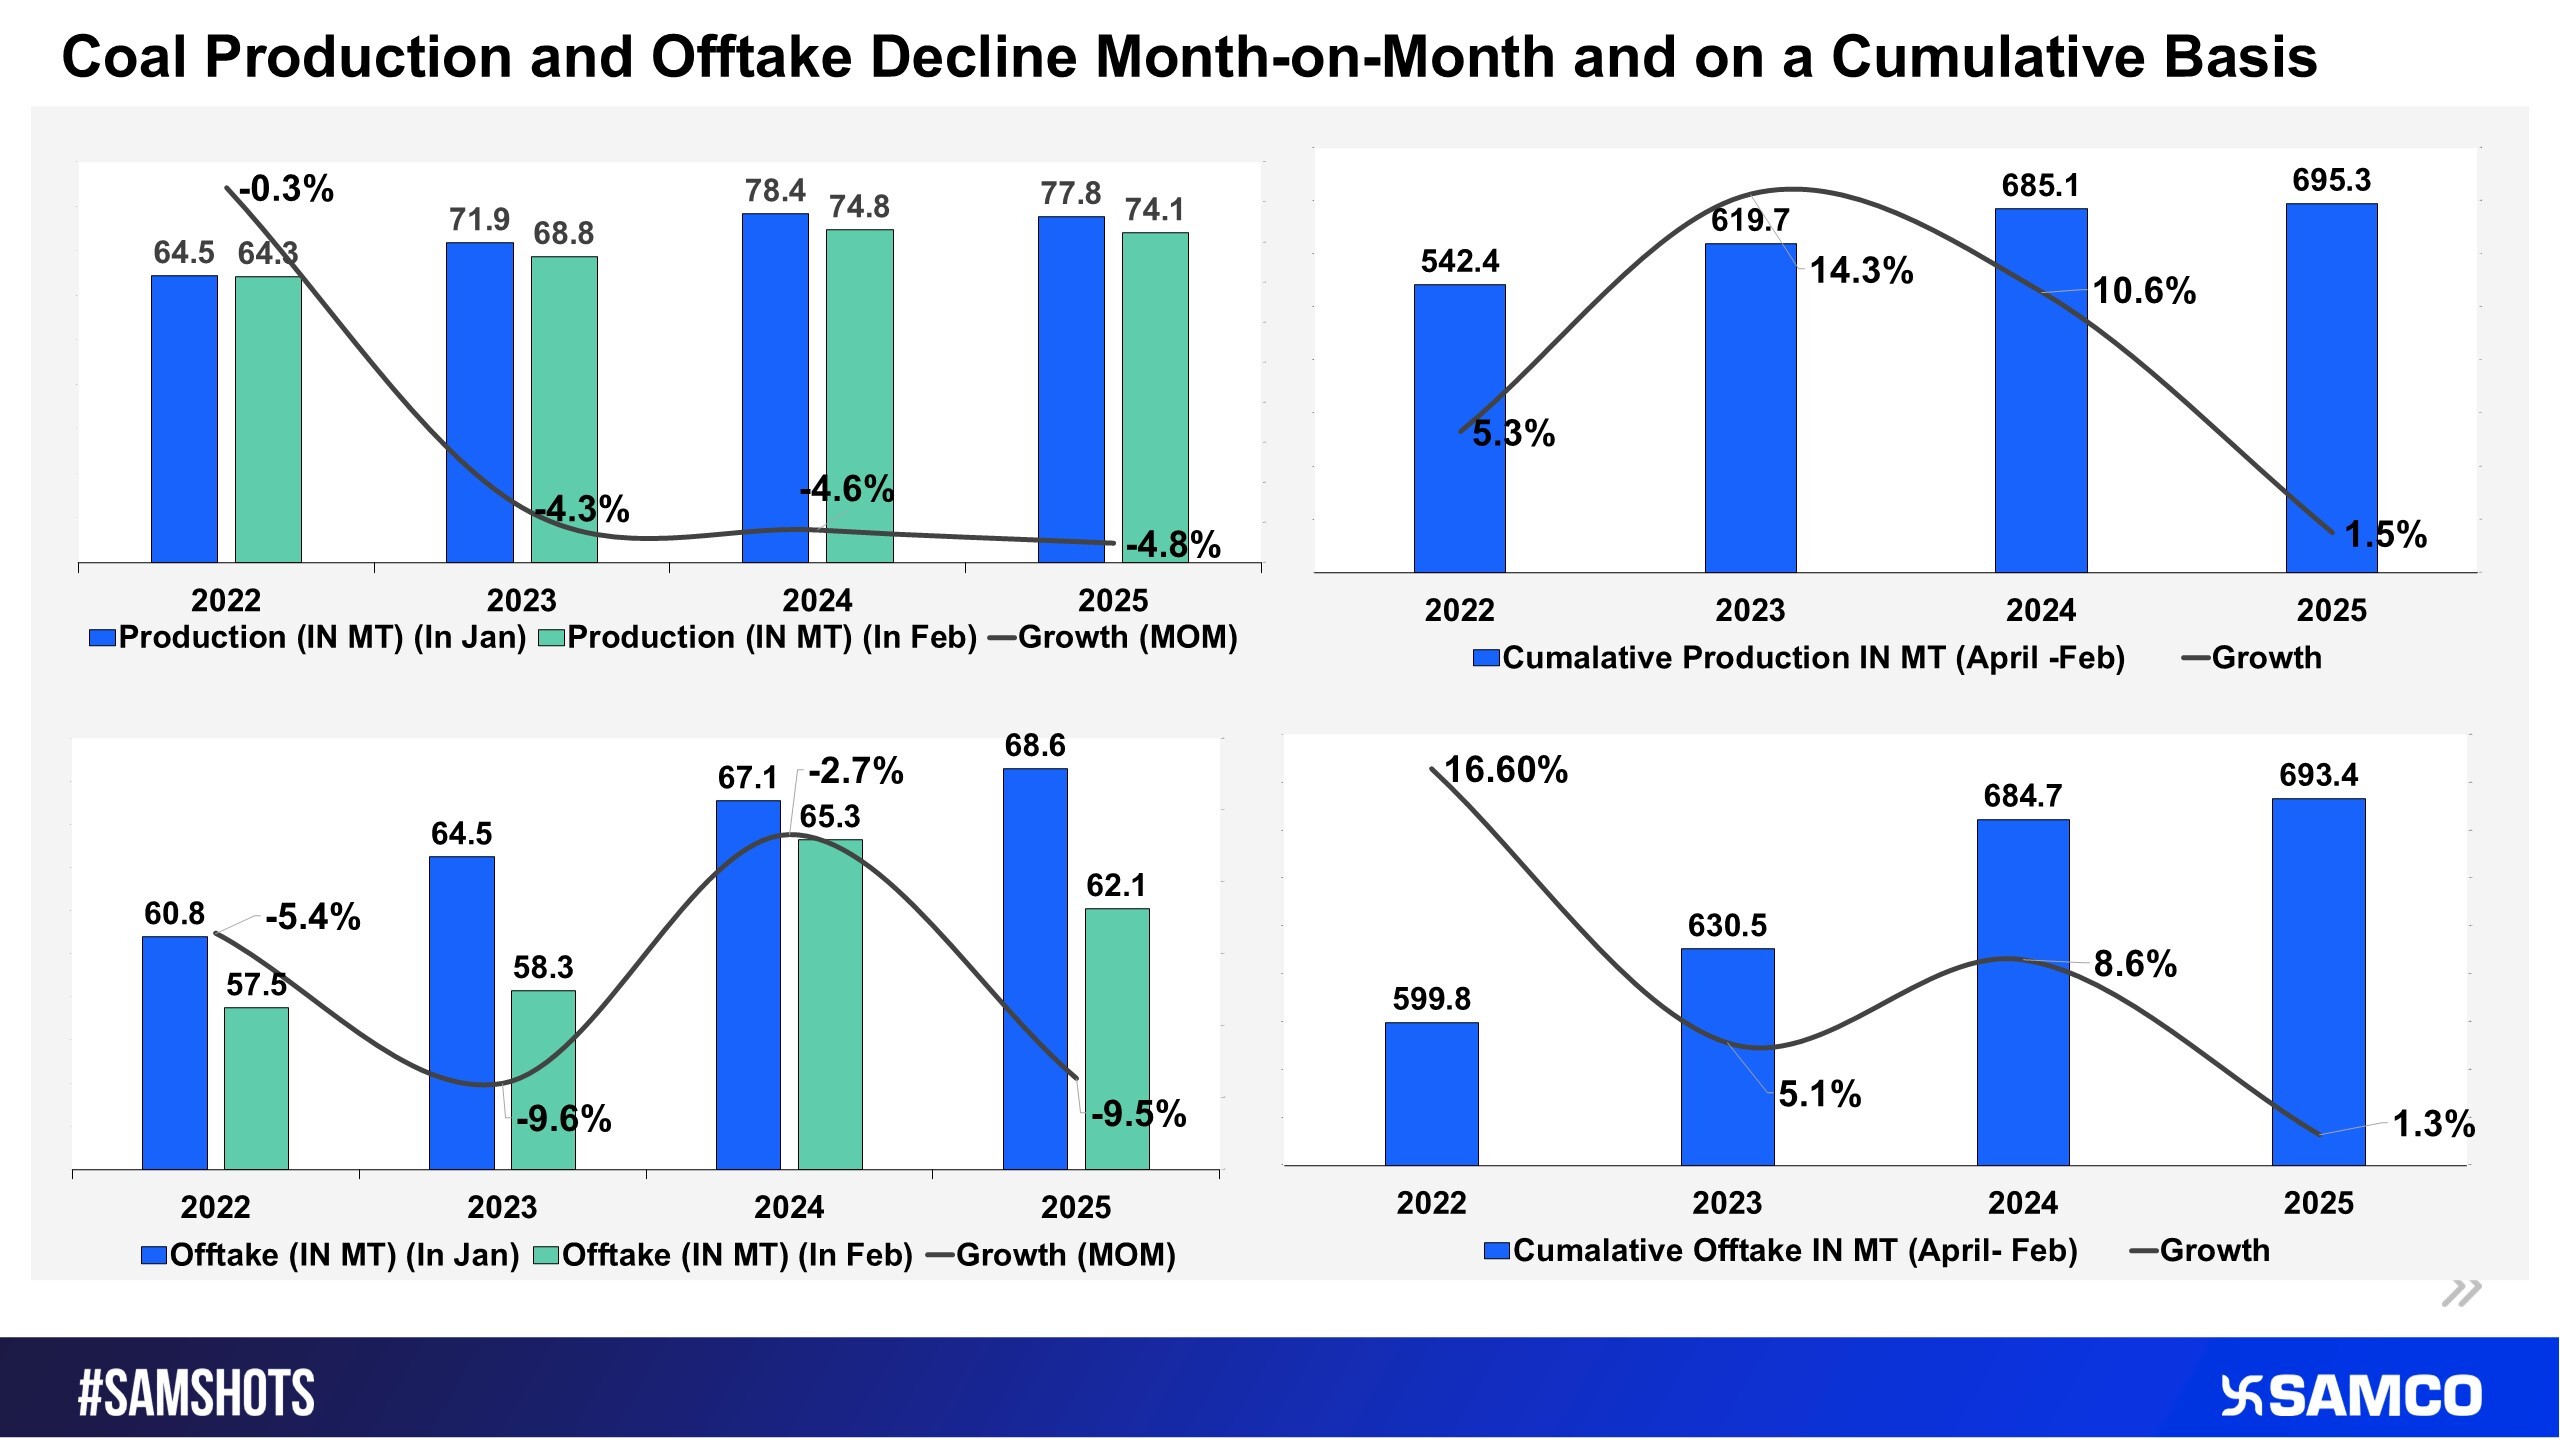
The chart displays the operational performance of Coal India for February.
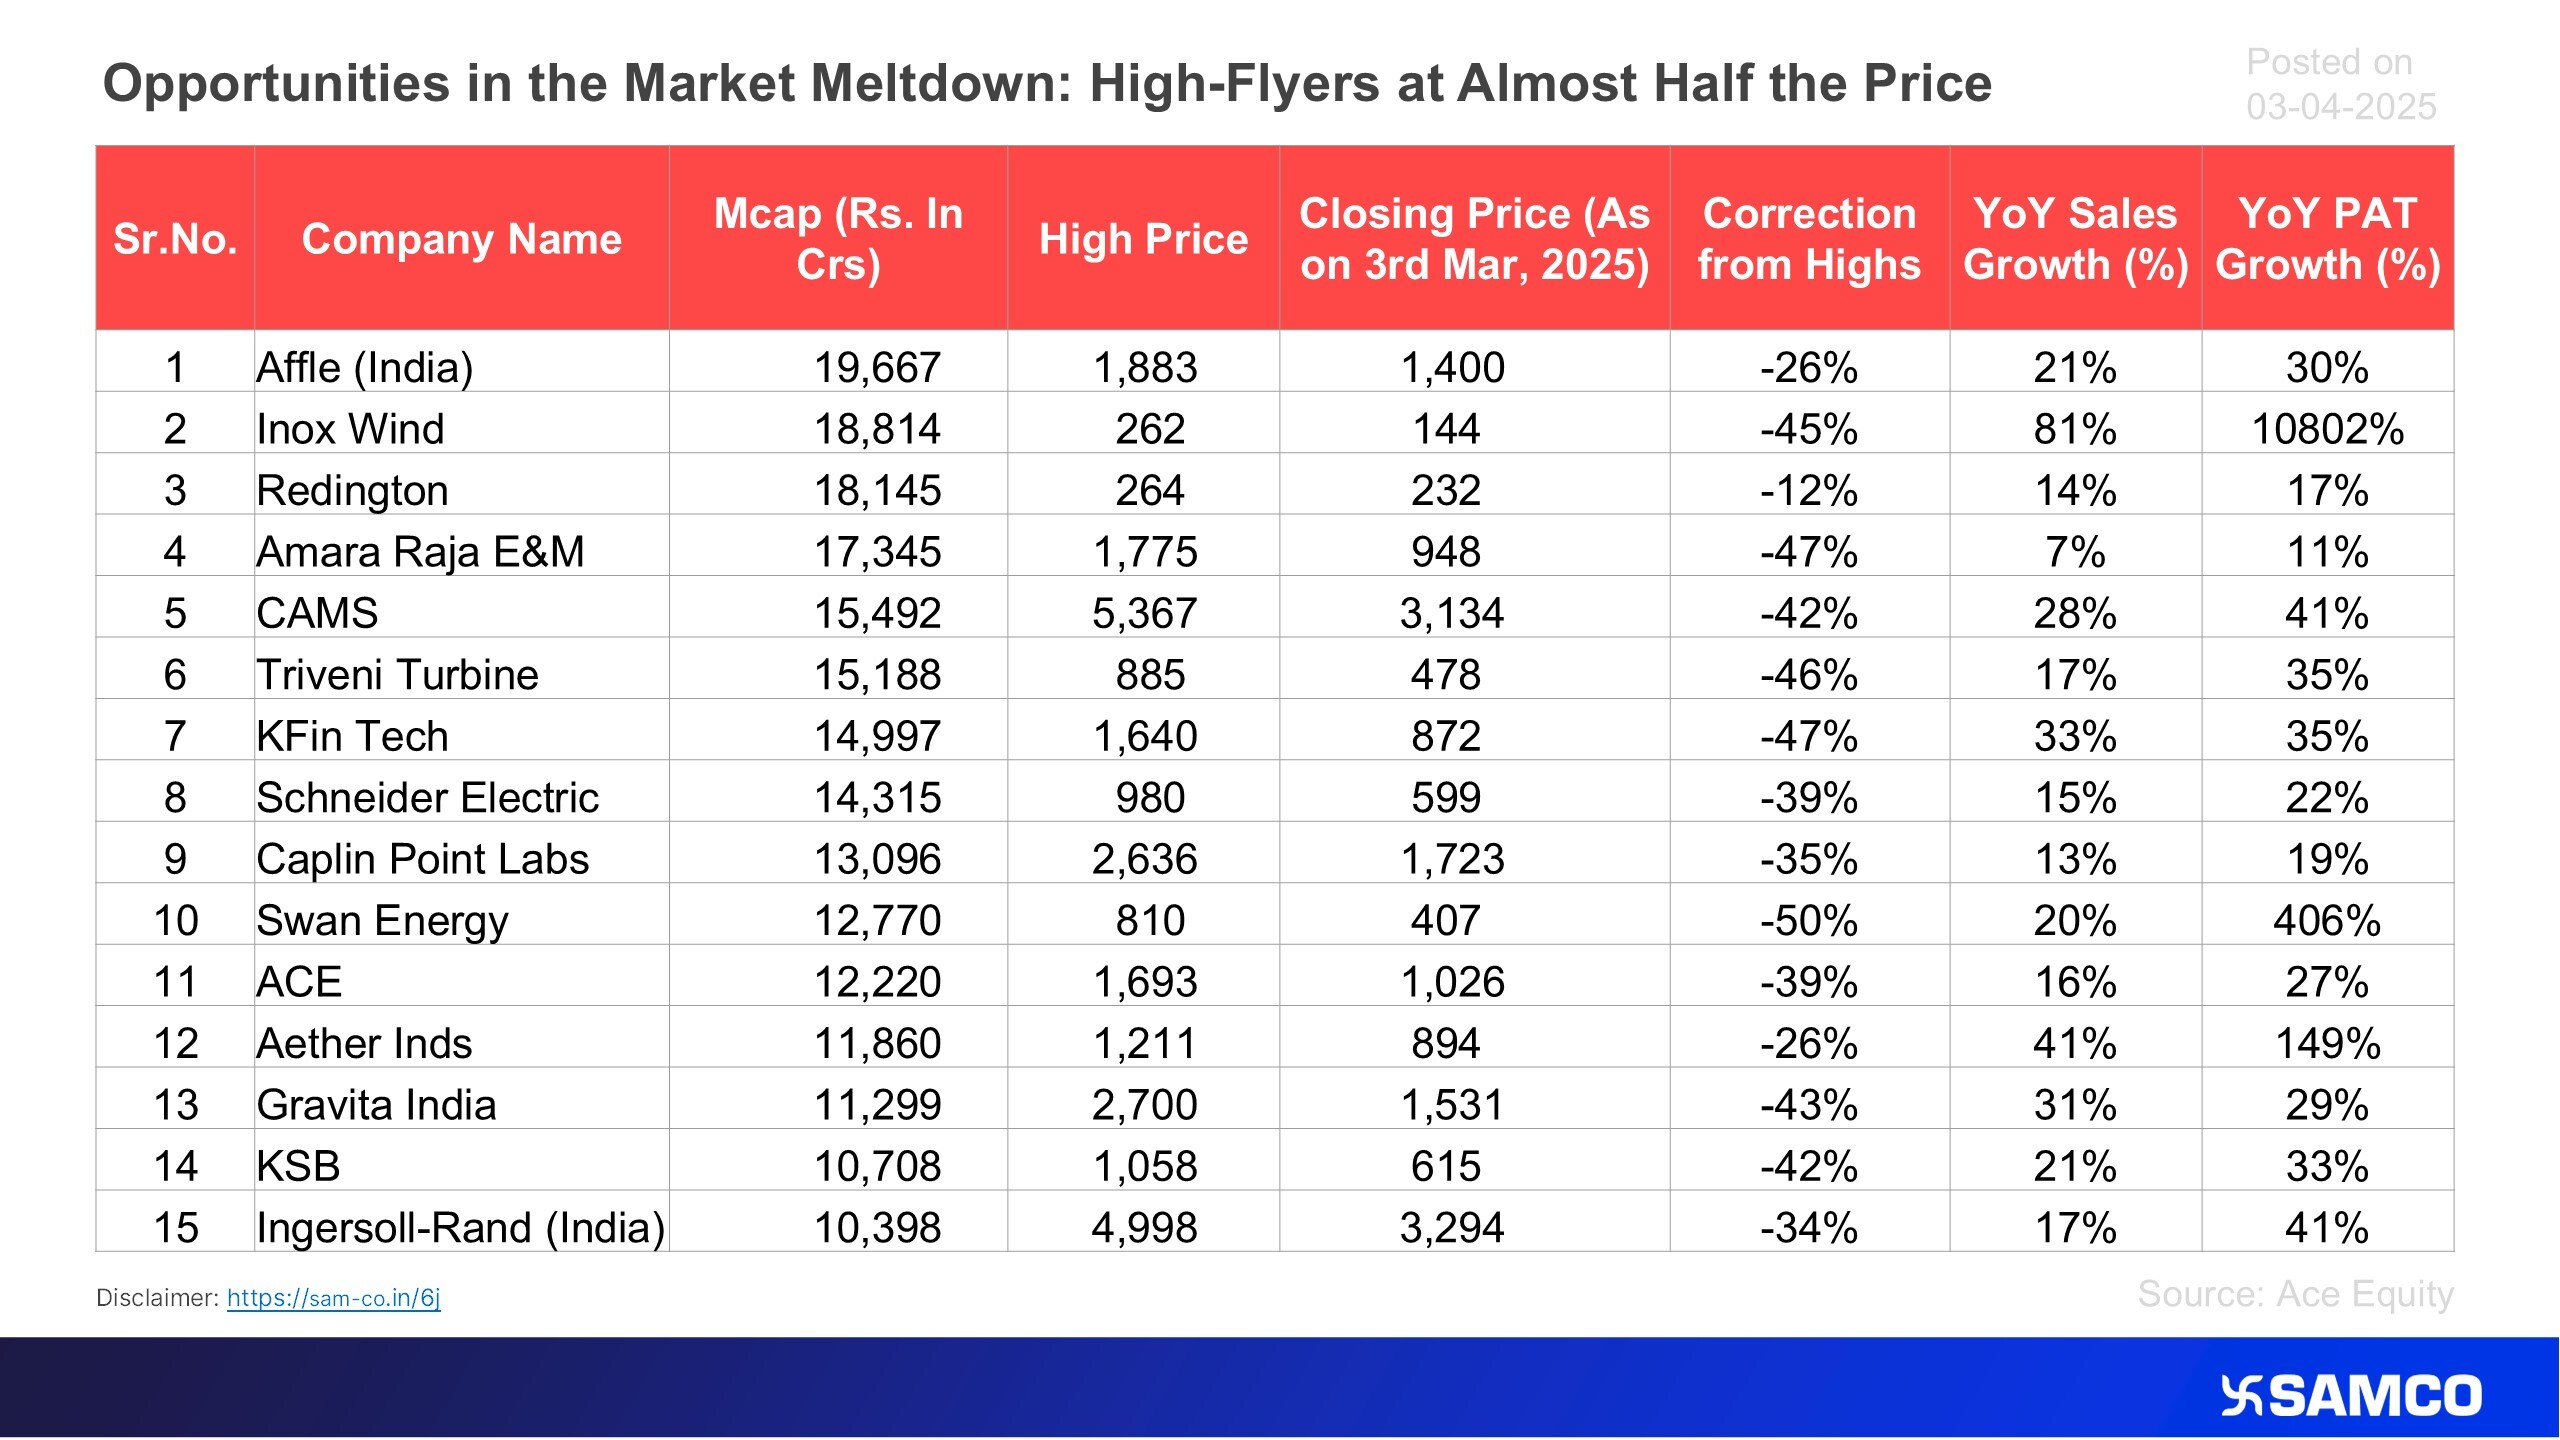
The accompanying chart presents the investment opportunities that are trading at almost half the price.
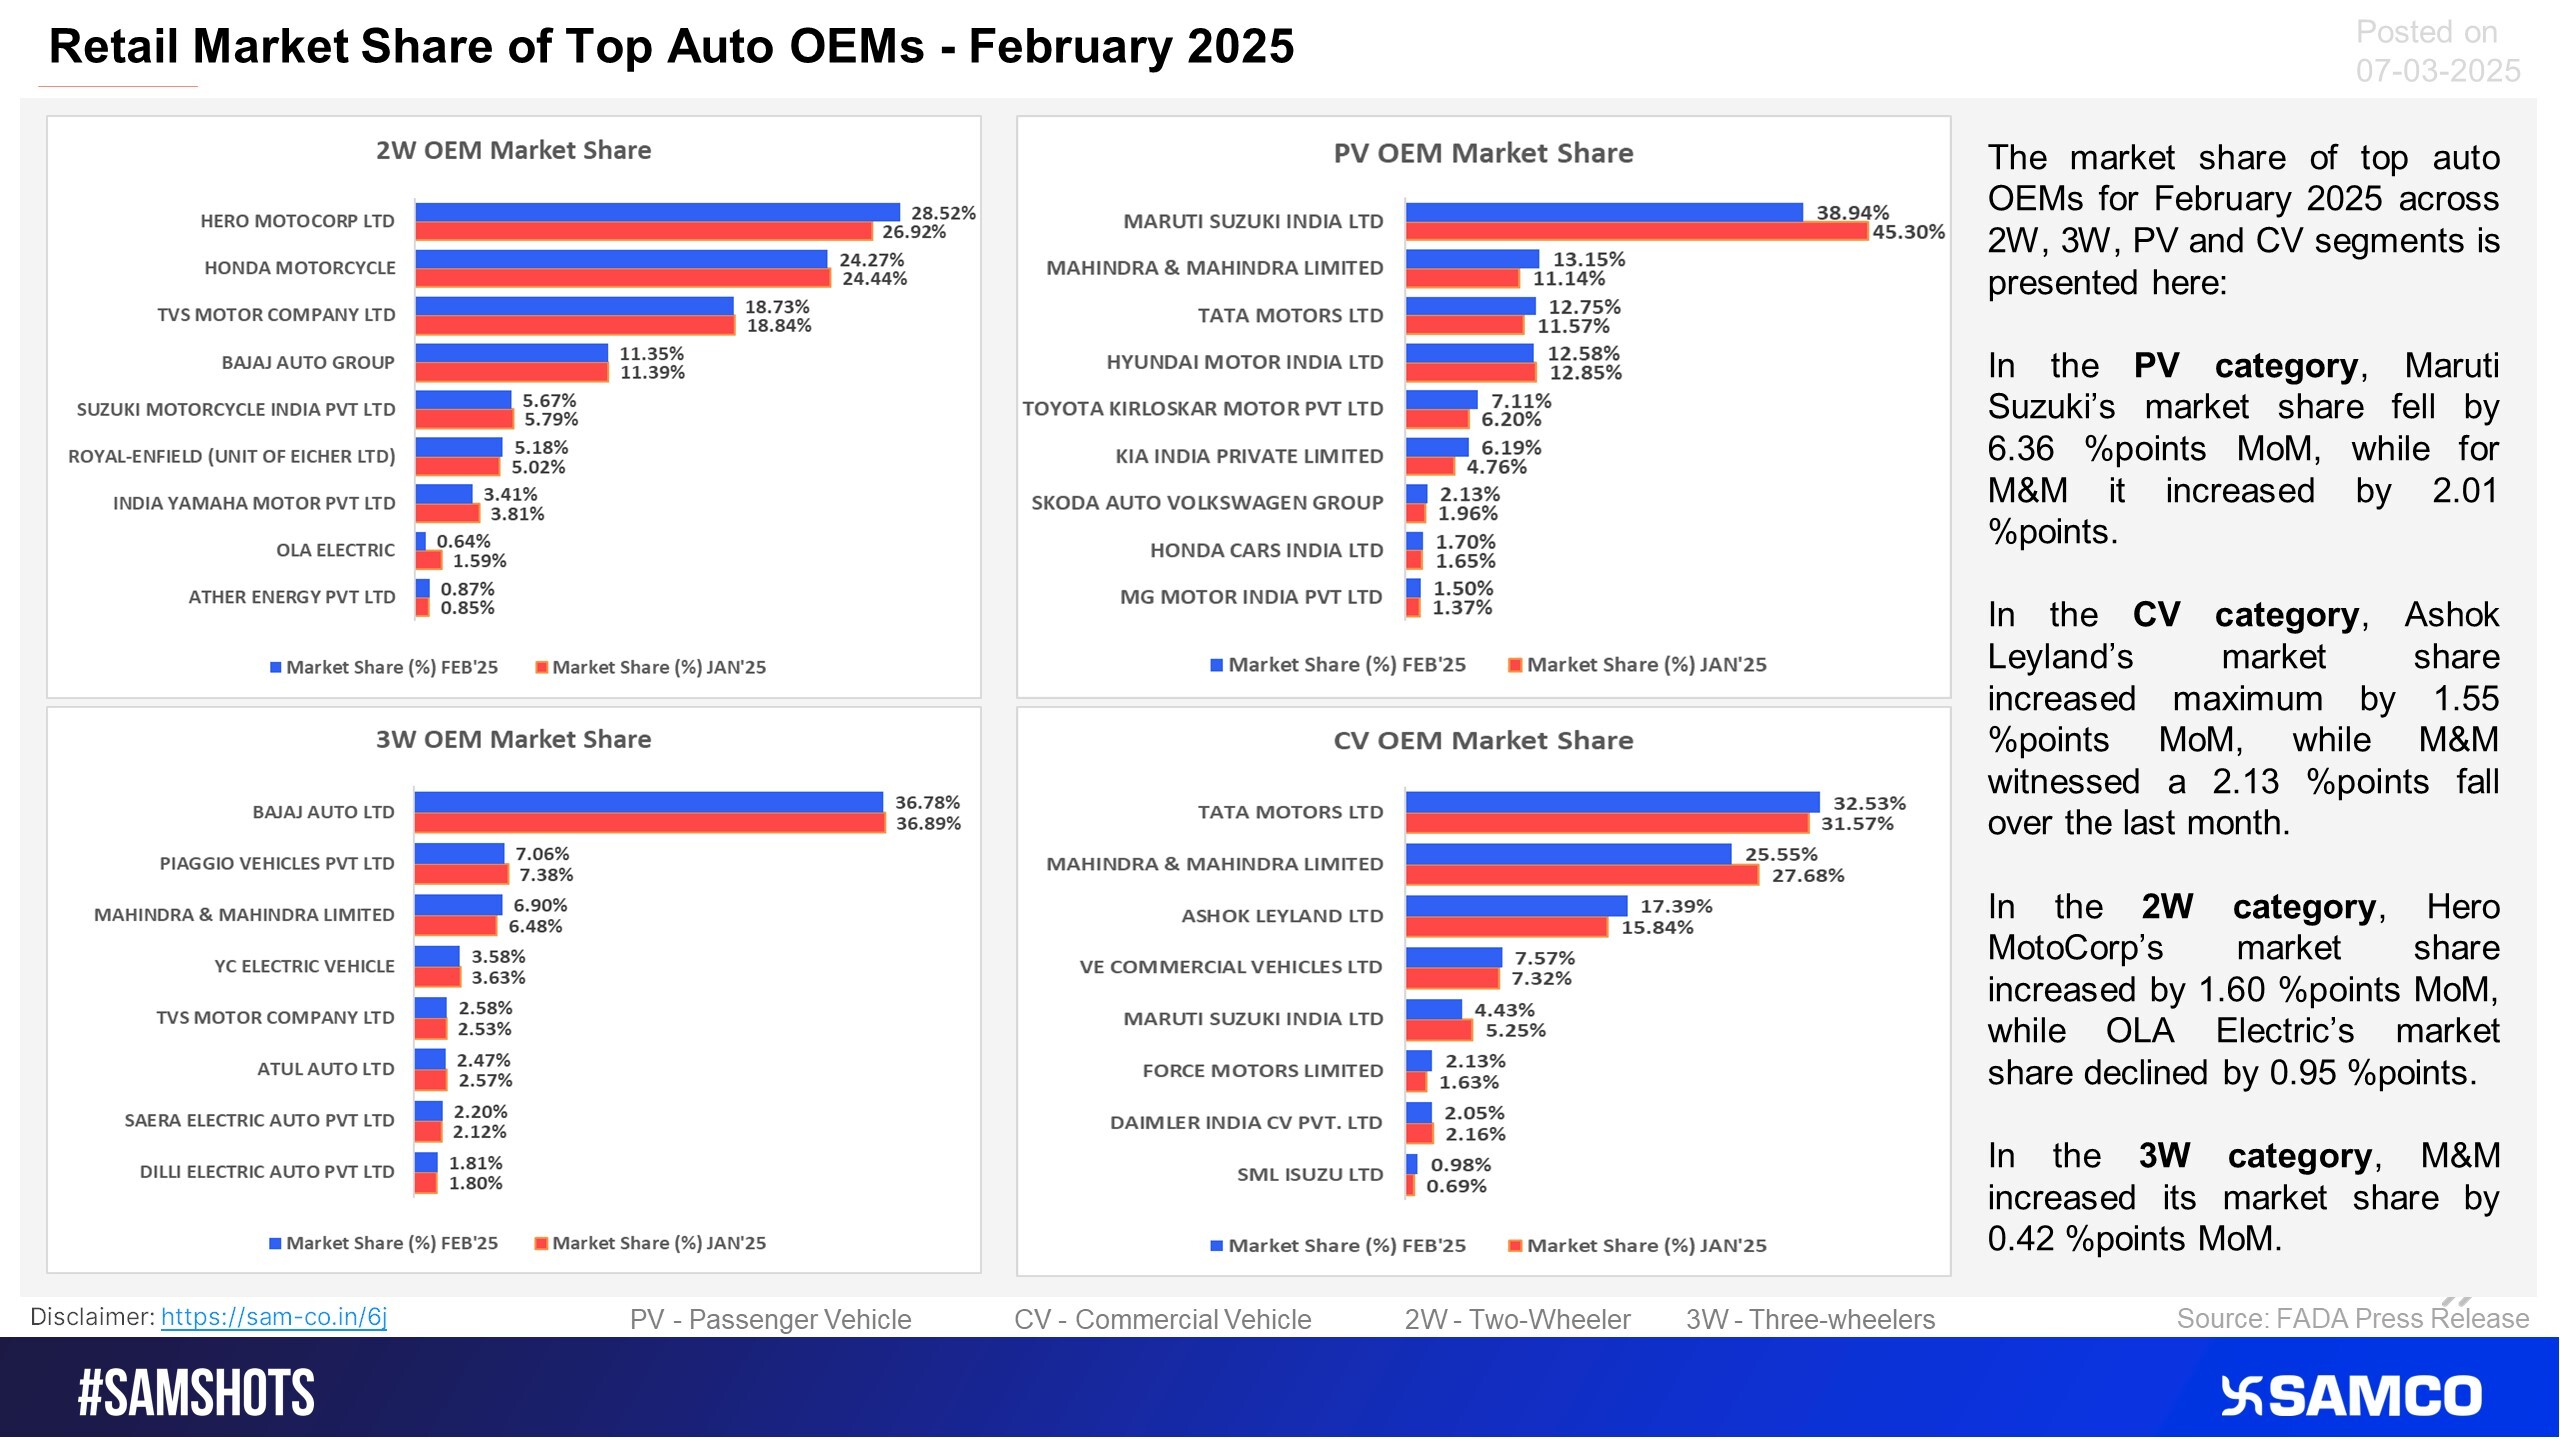
Automobile OEMs’ February operating performance is compared below:
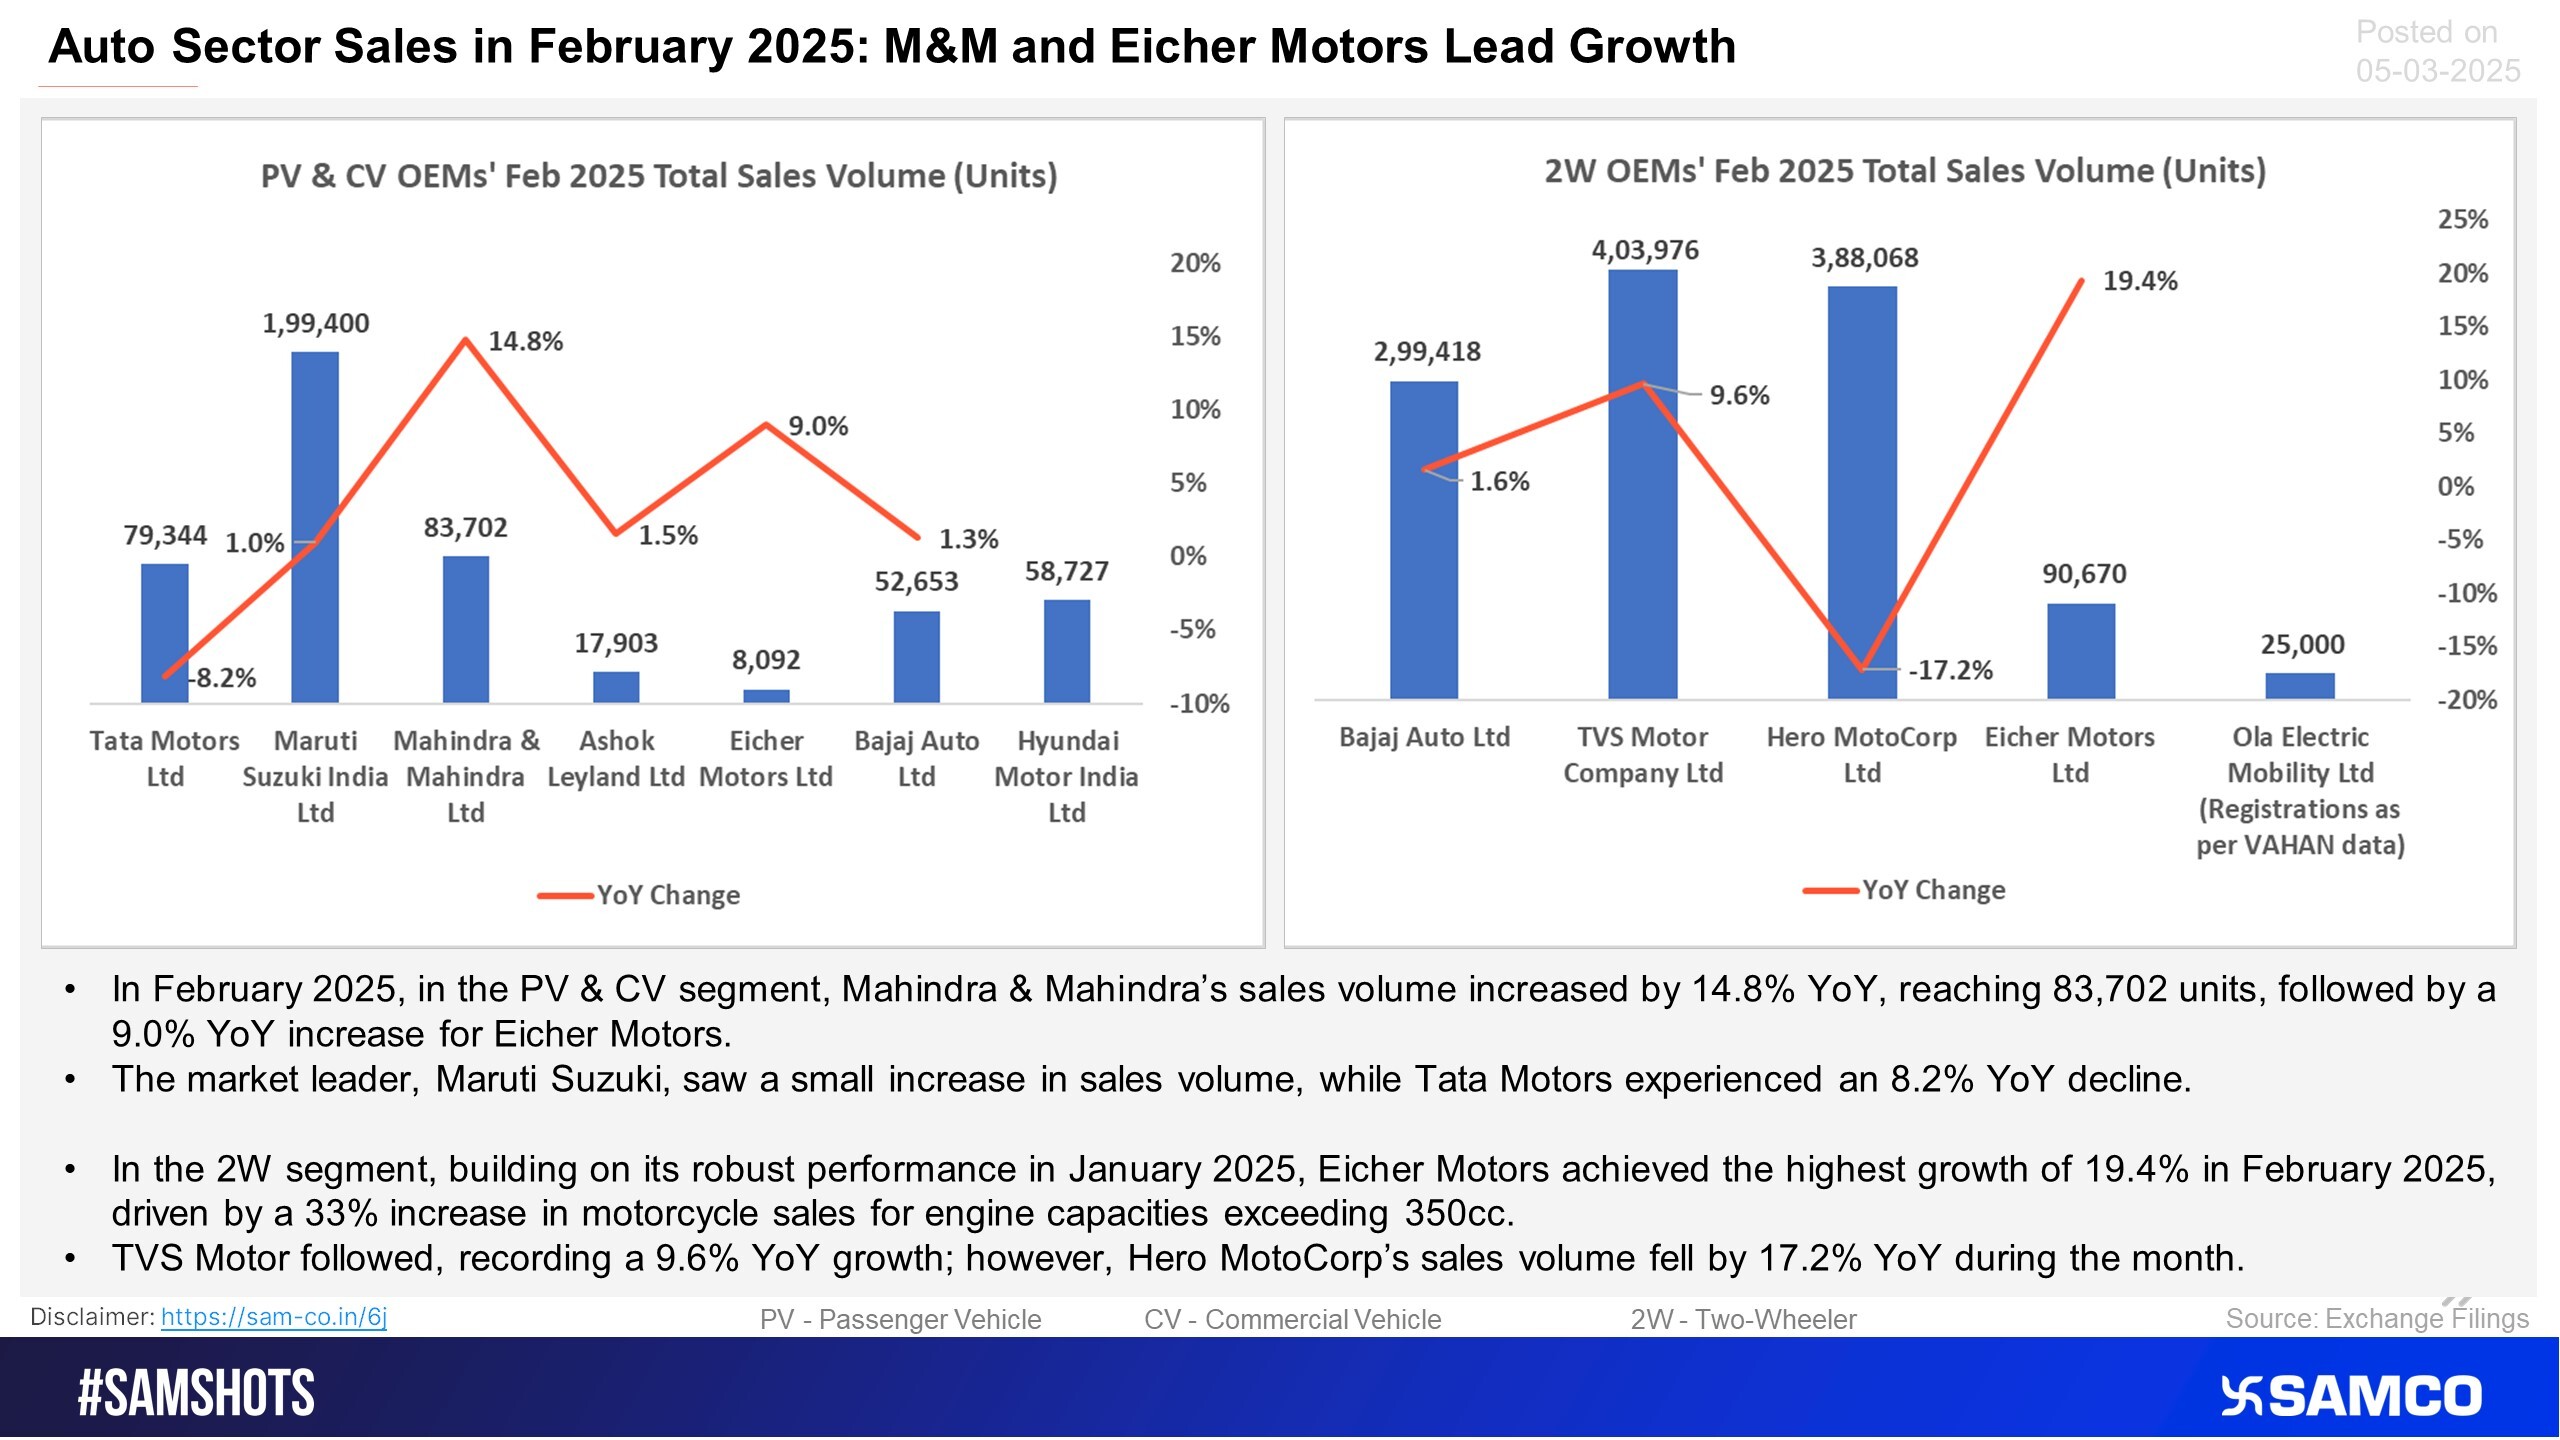
Take a look at which OEM gained market share and which lagged in the competition in February:
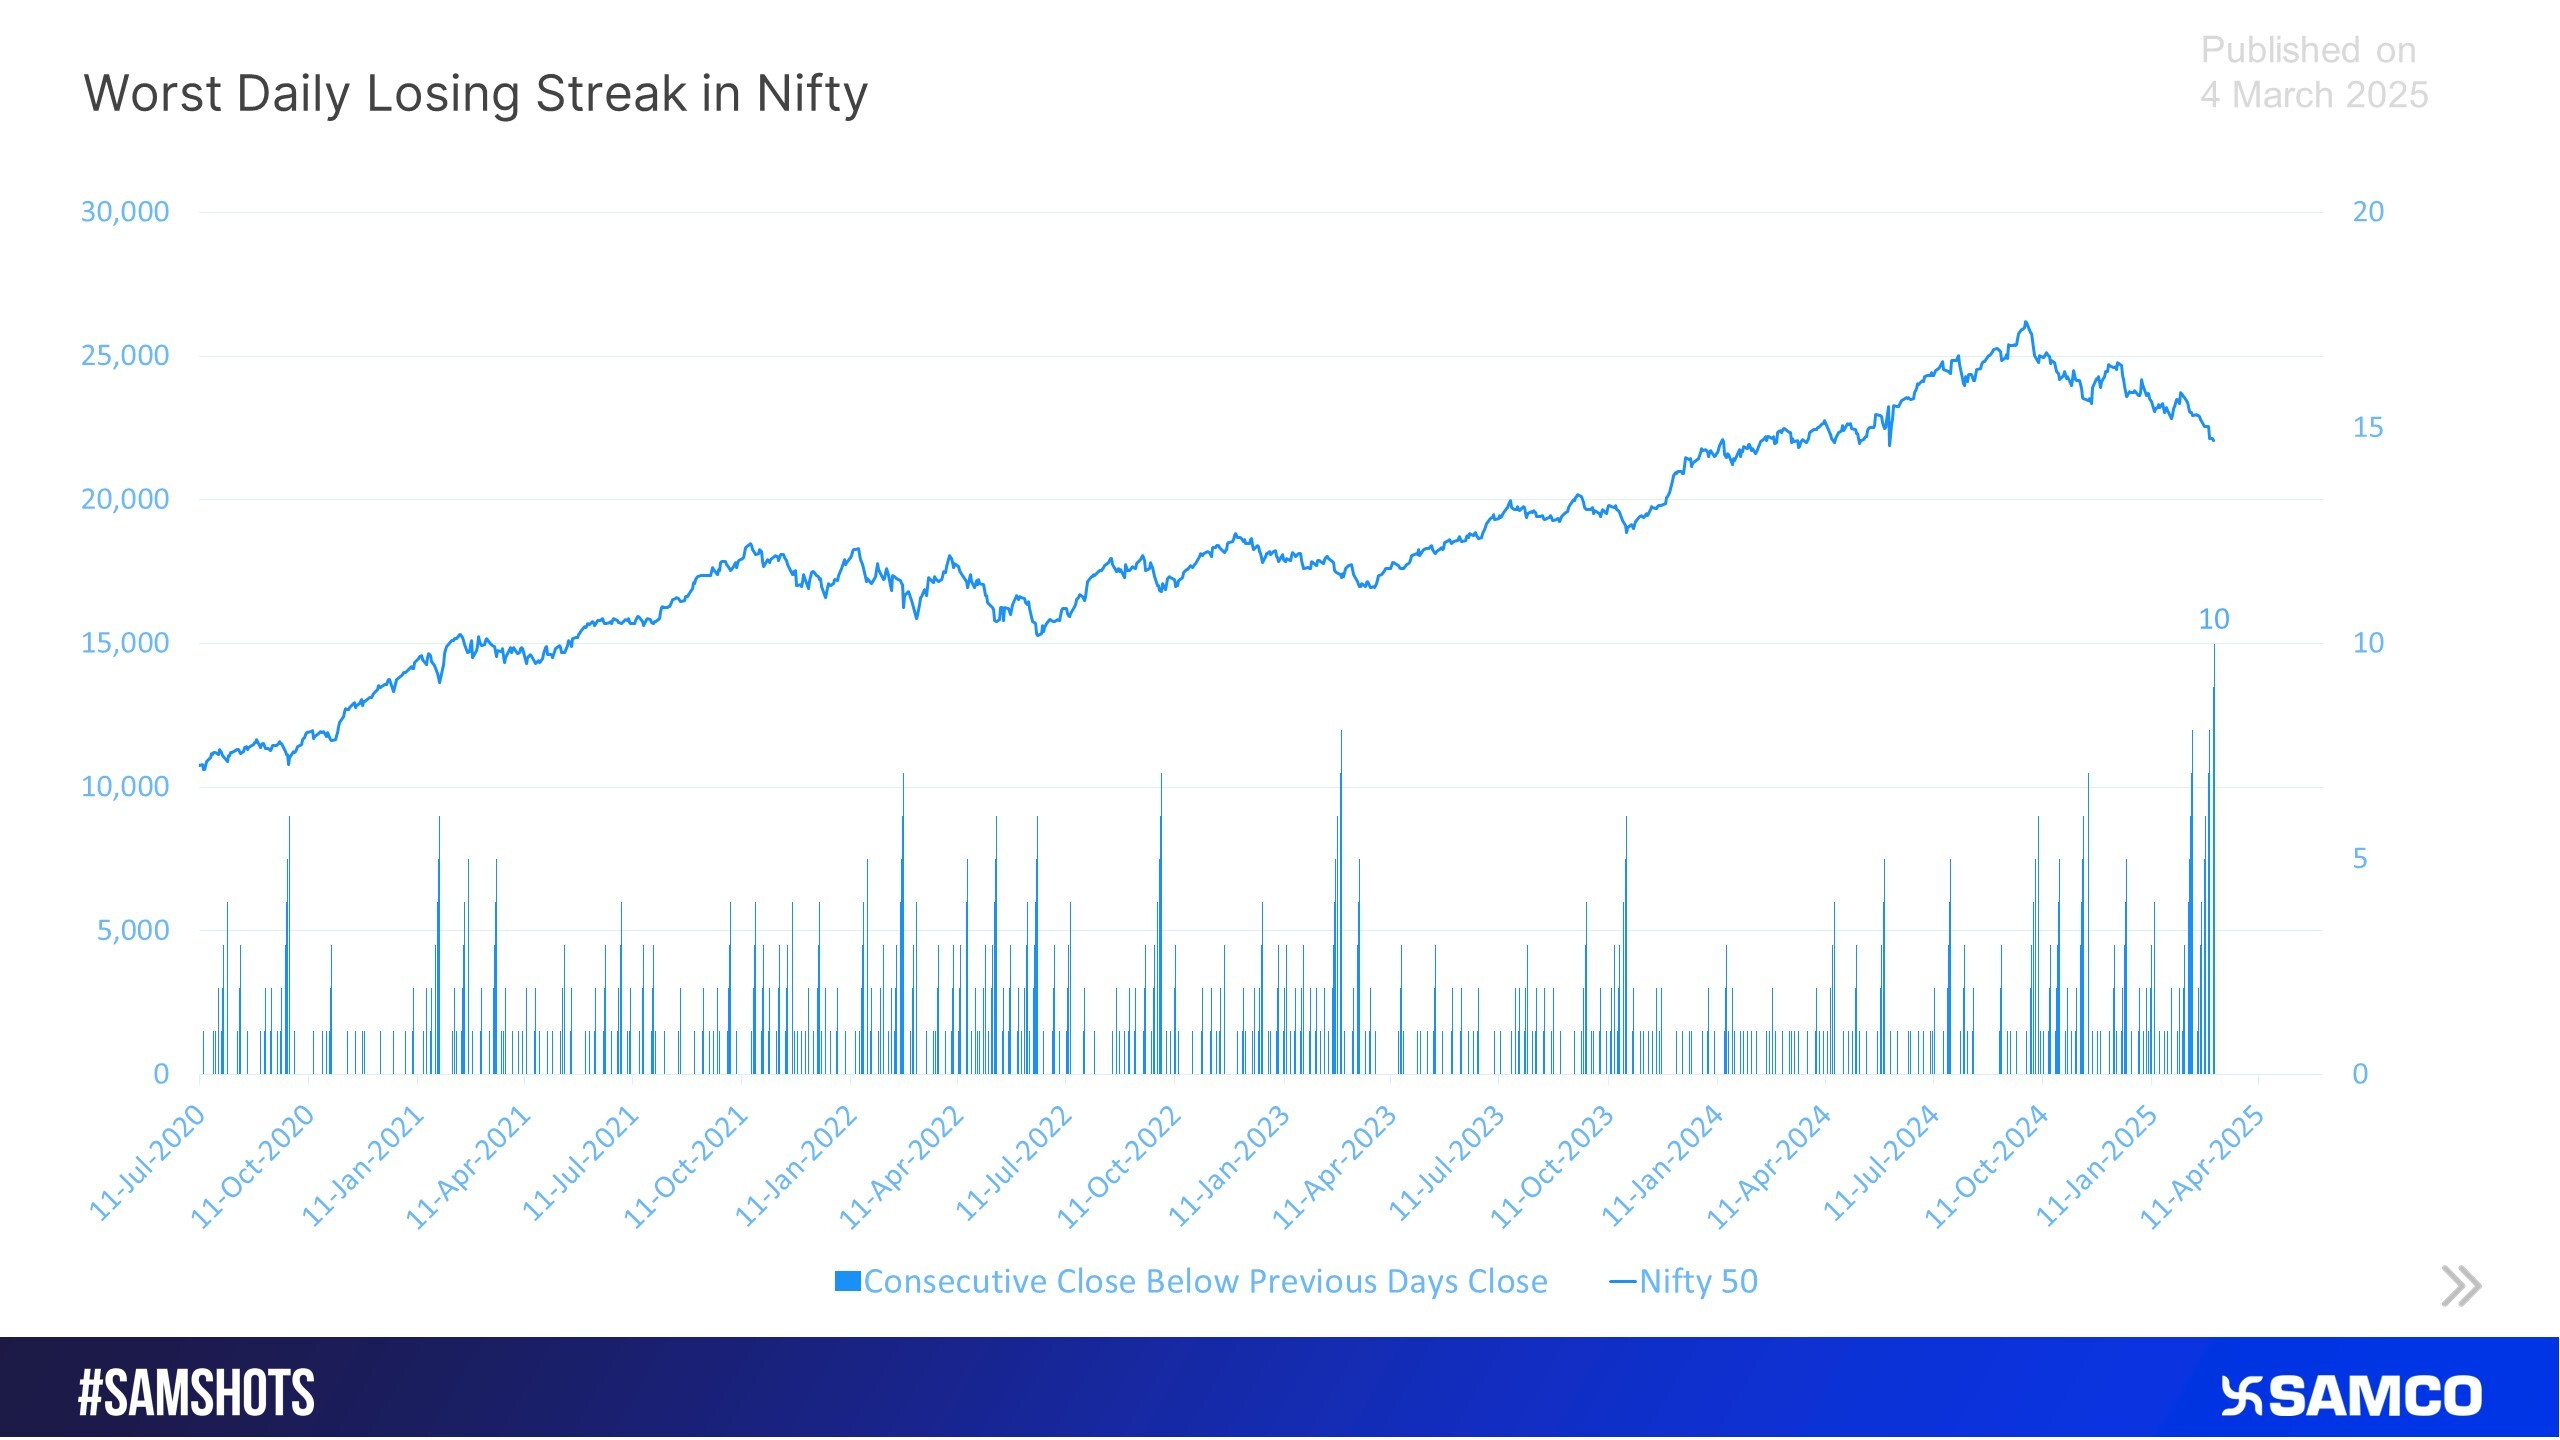
Since 2002, the Nifty 50 has witnessed nine instances of eight or more consecutive days of negative closing. In six out of these nine instances, the index delivered positive returns over the following one month.
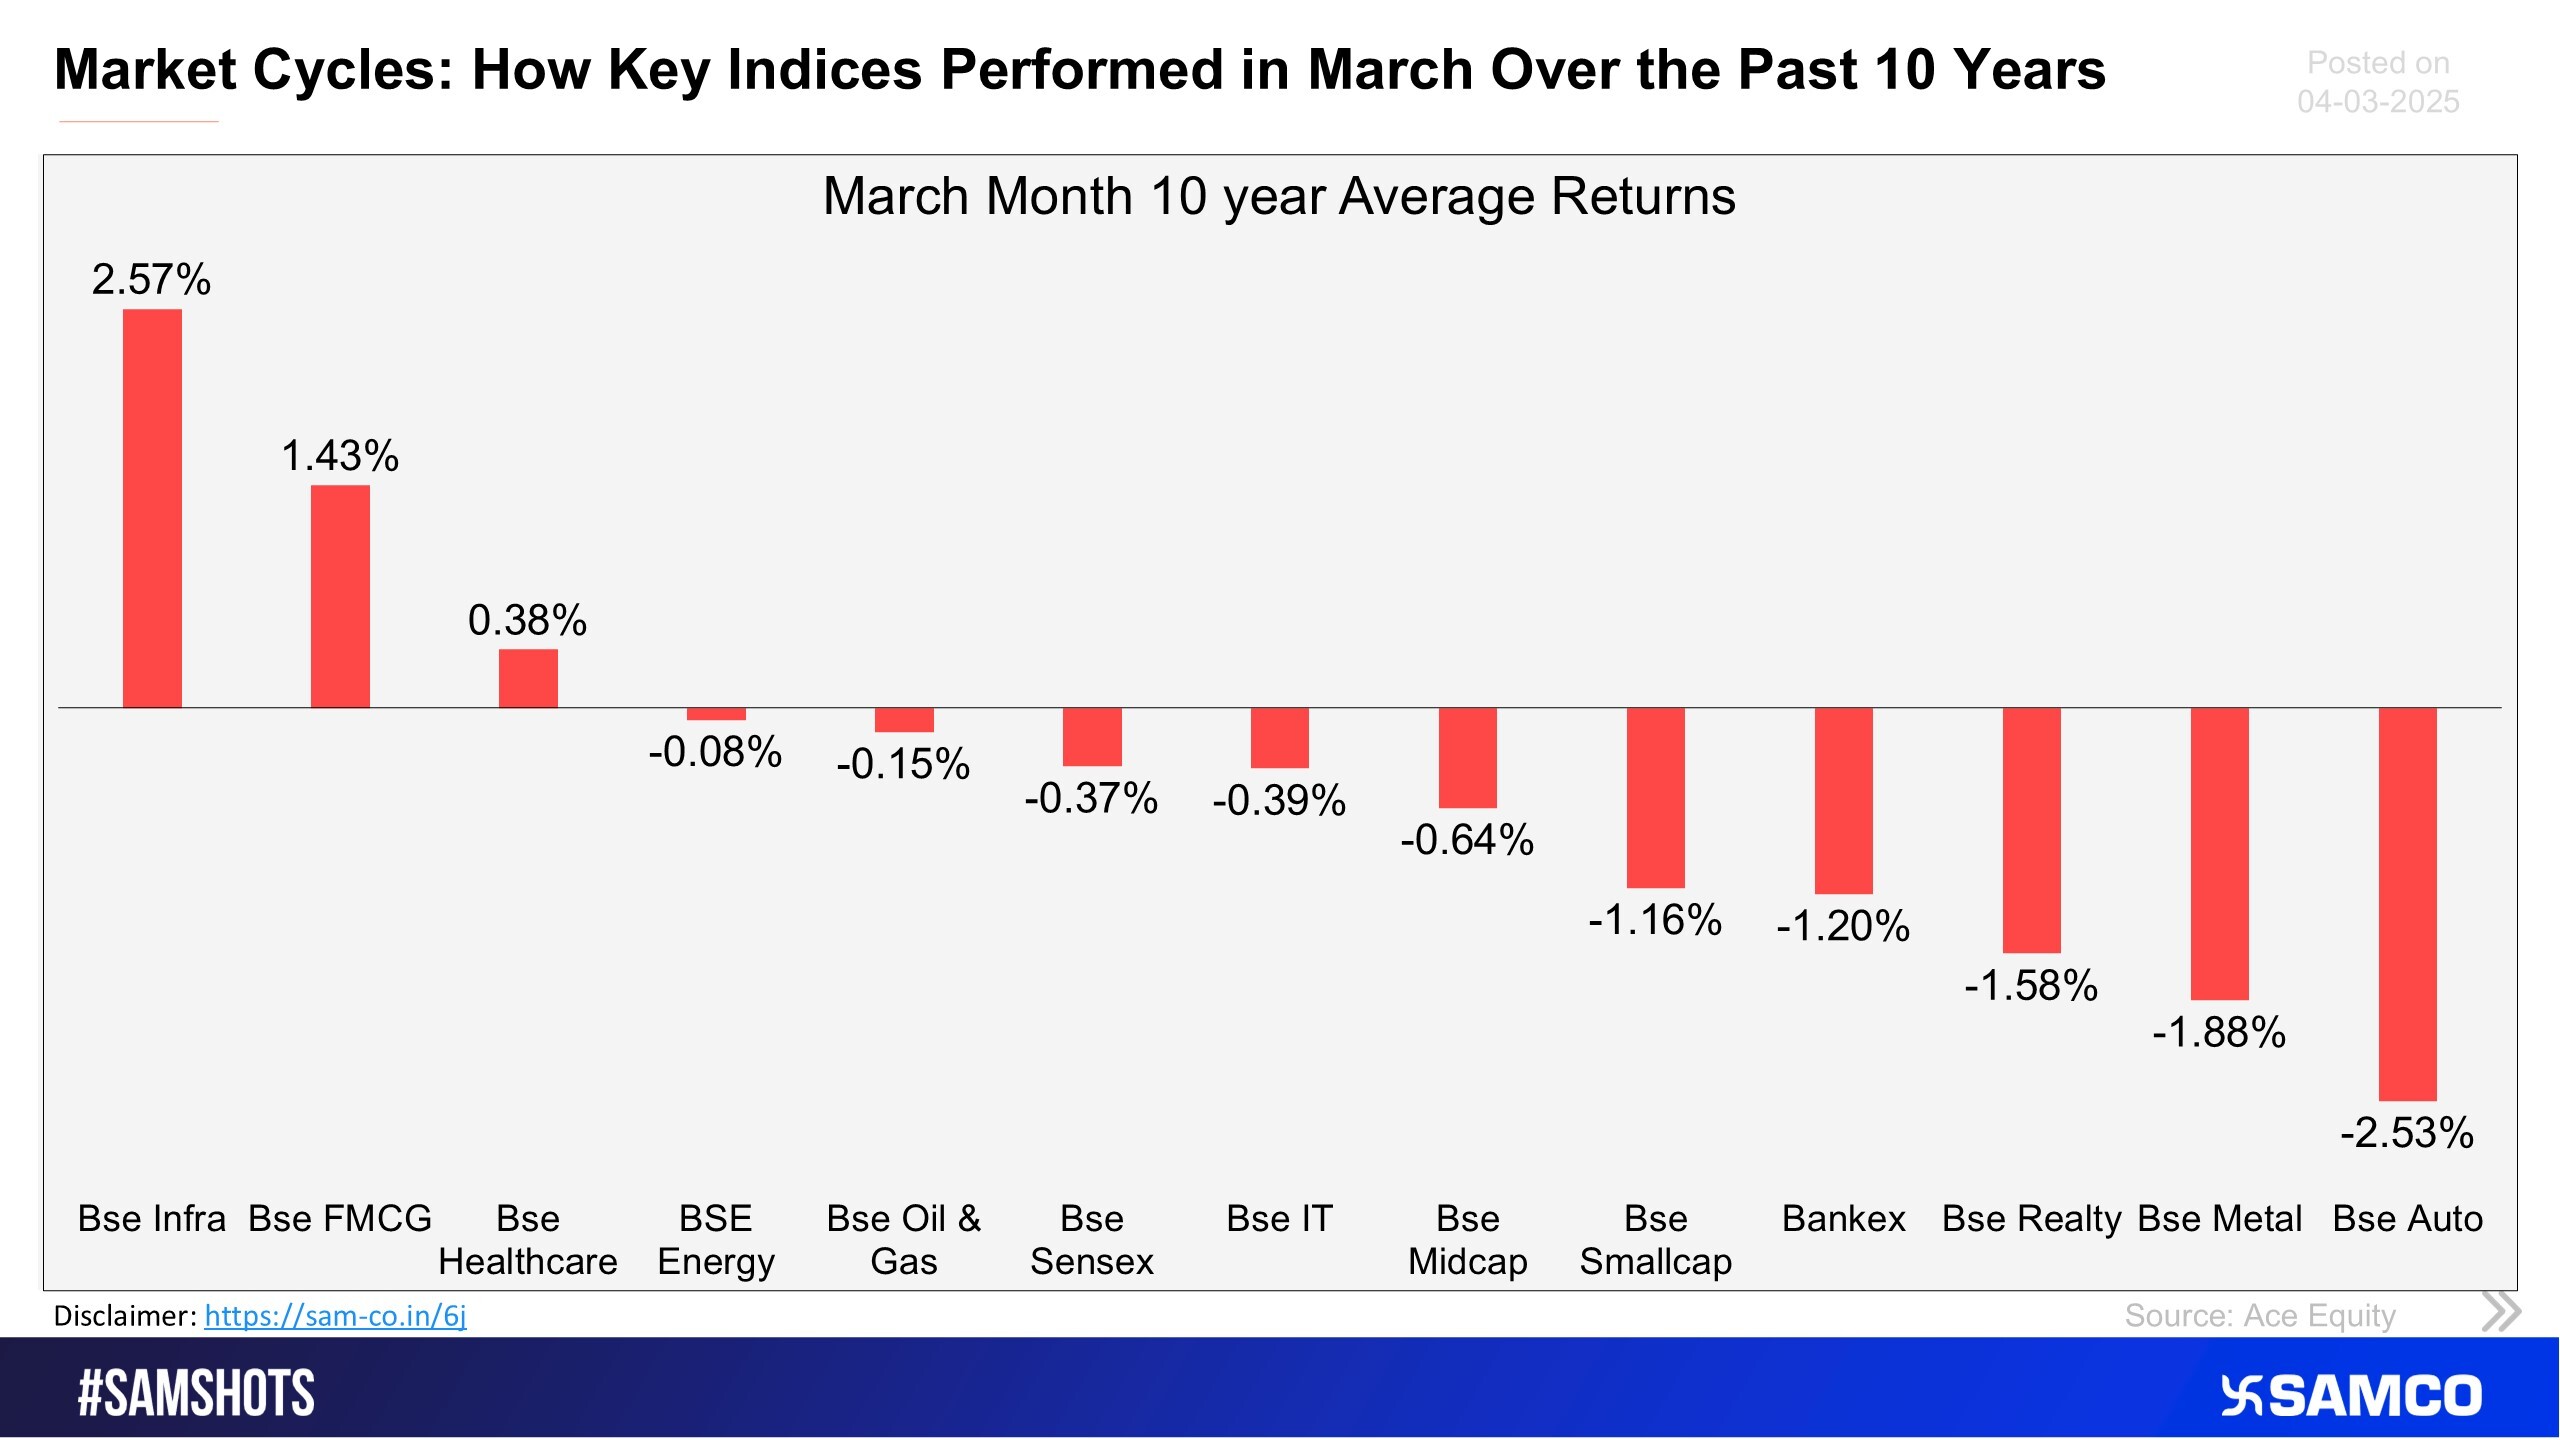
Here’s how major indices performed in March month in the past 10 years.
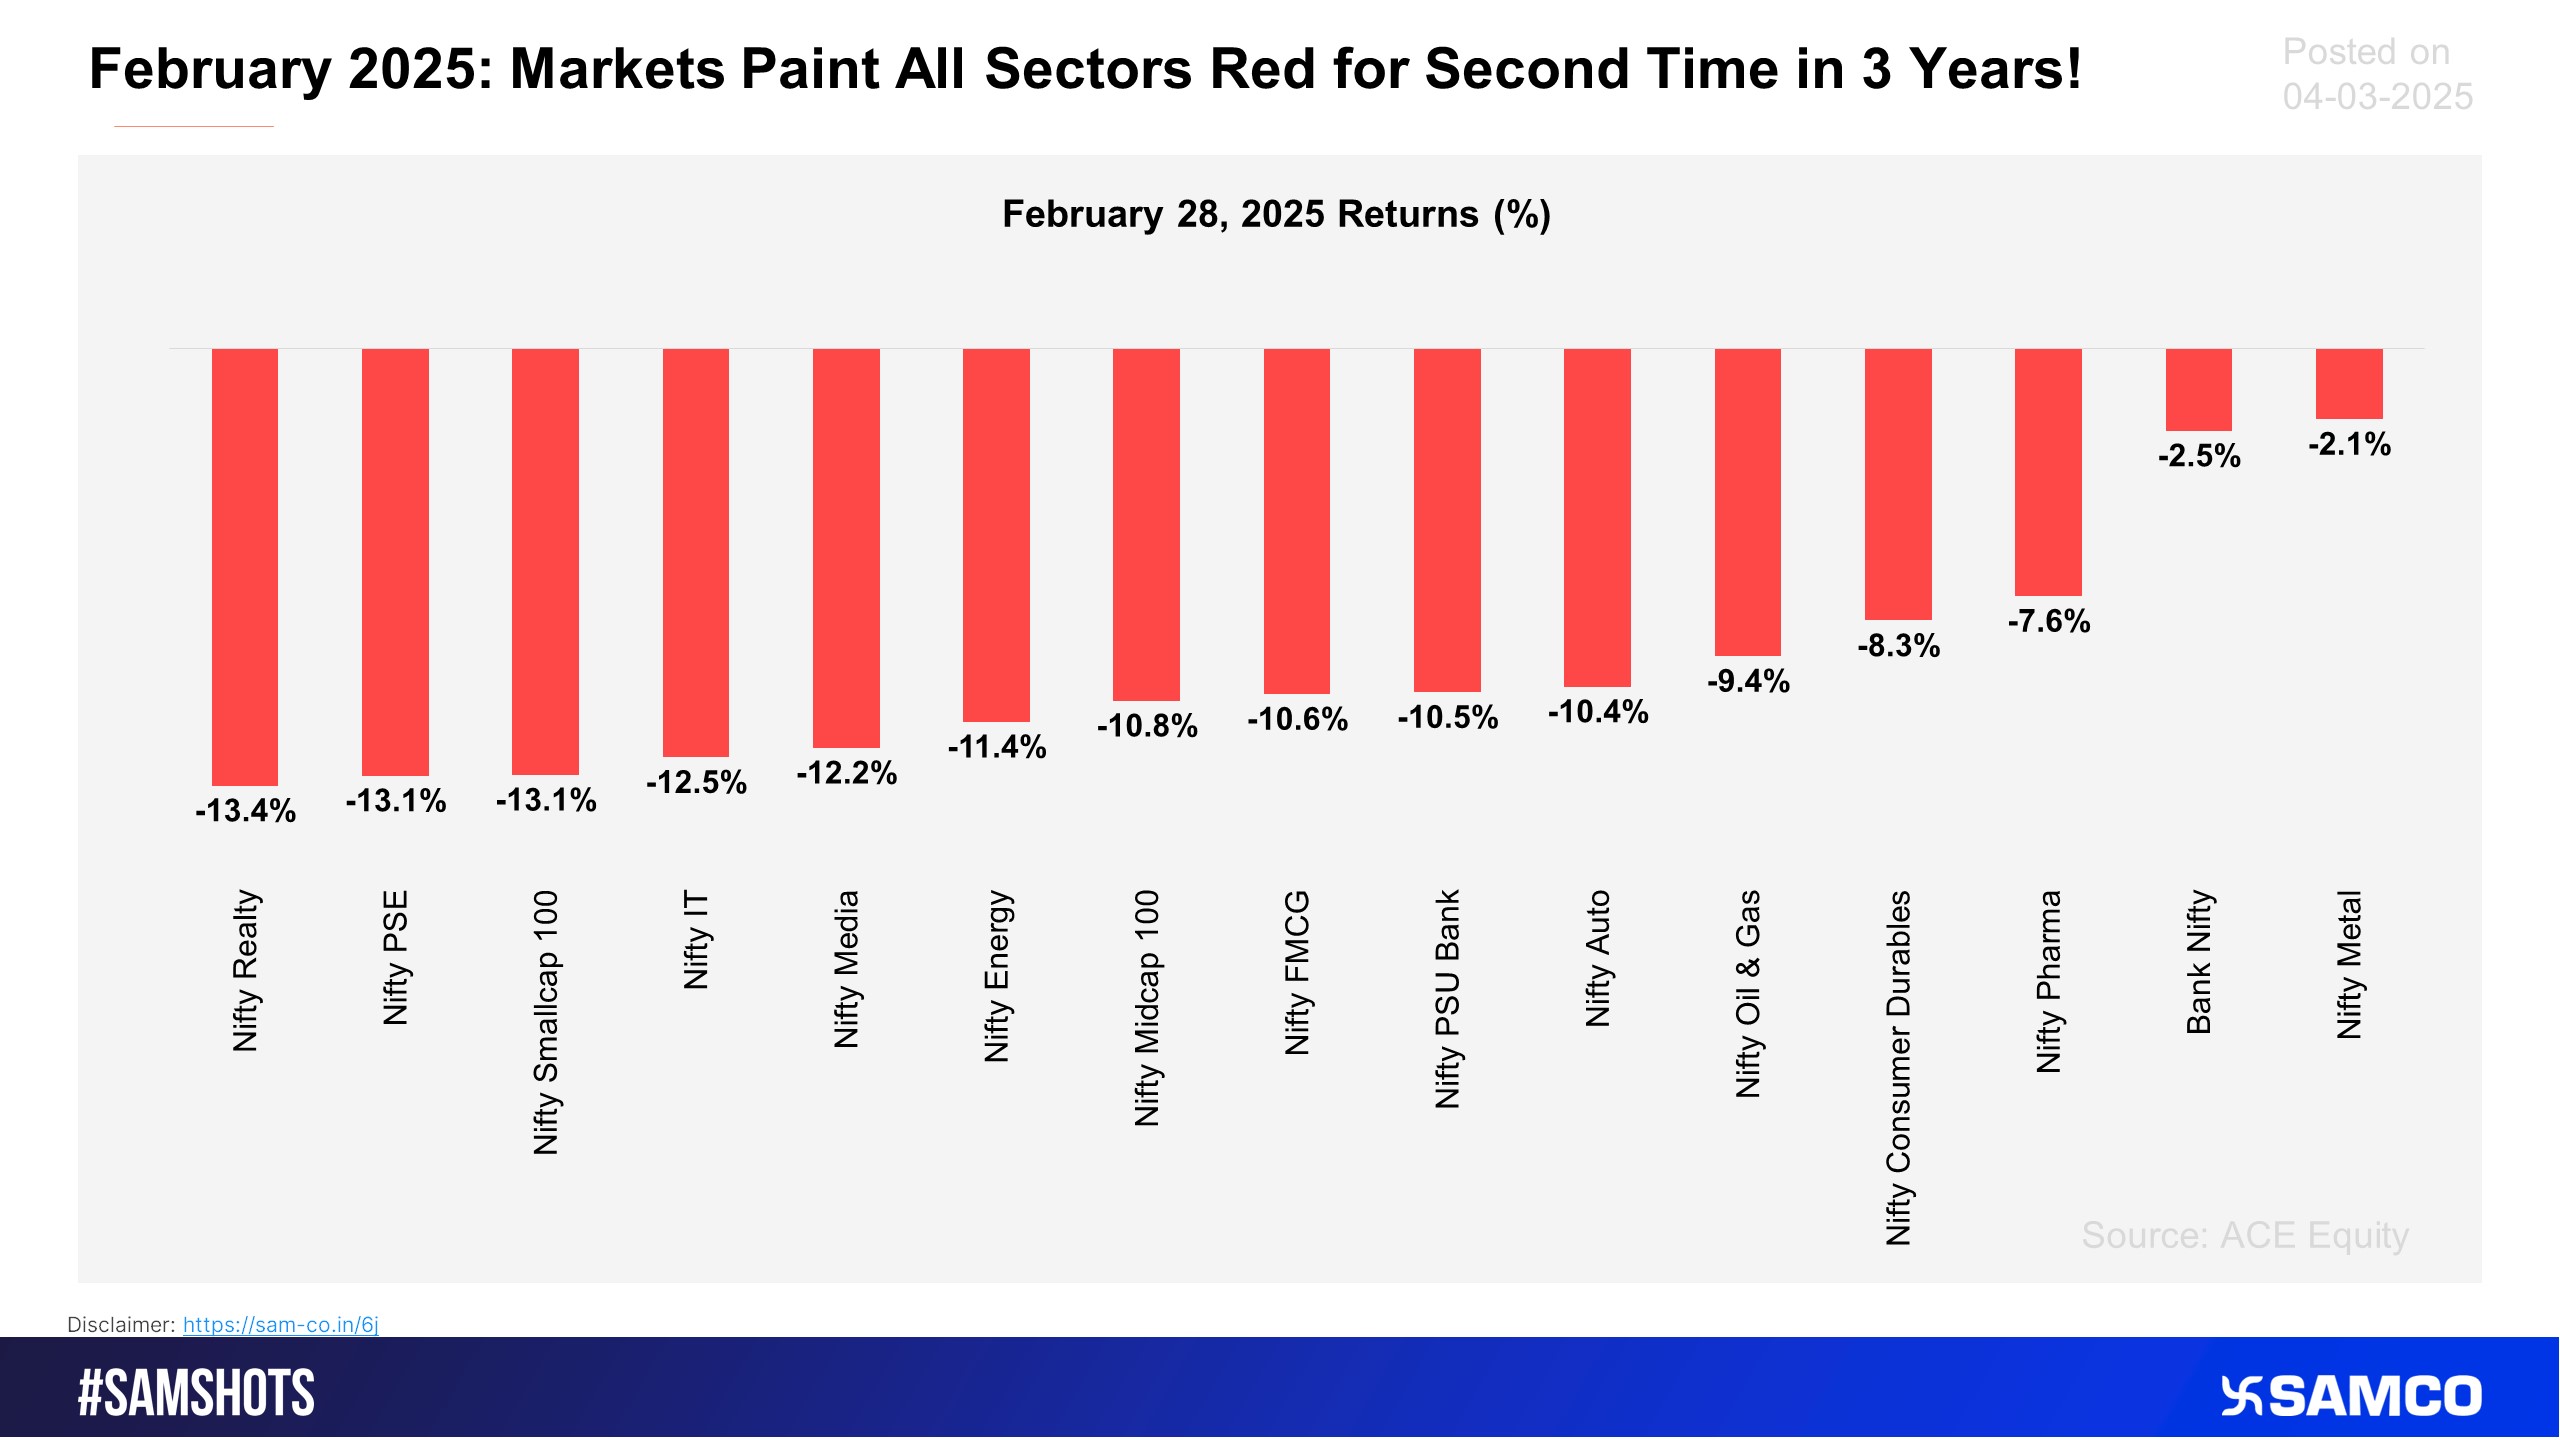
The chart shows that all major Nifty sectoral indices ended in negative territory in February 2025 - the second such instance since November 2021, after October 2024. Nifty Realty was the worst performer with a sharp fall of 13.4%, followed by Nifty PSE a
All sectoral indices have closed in green this week, the Metal sector tops the list
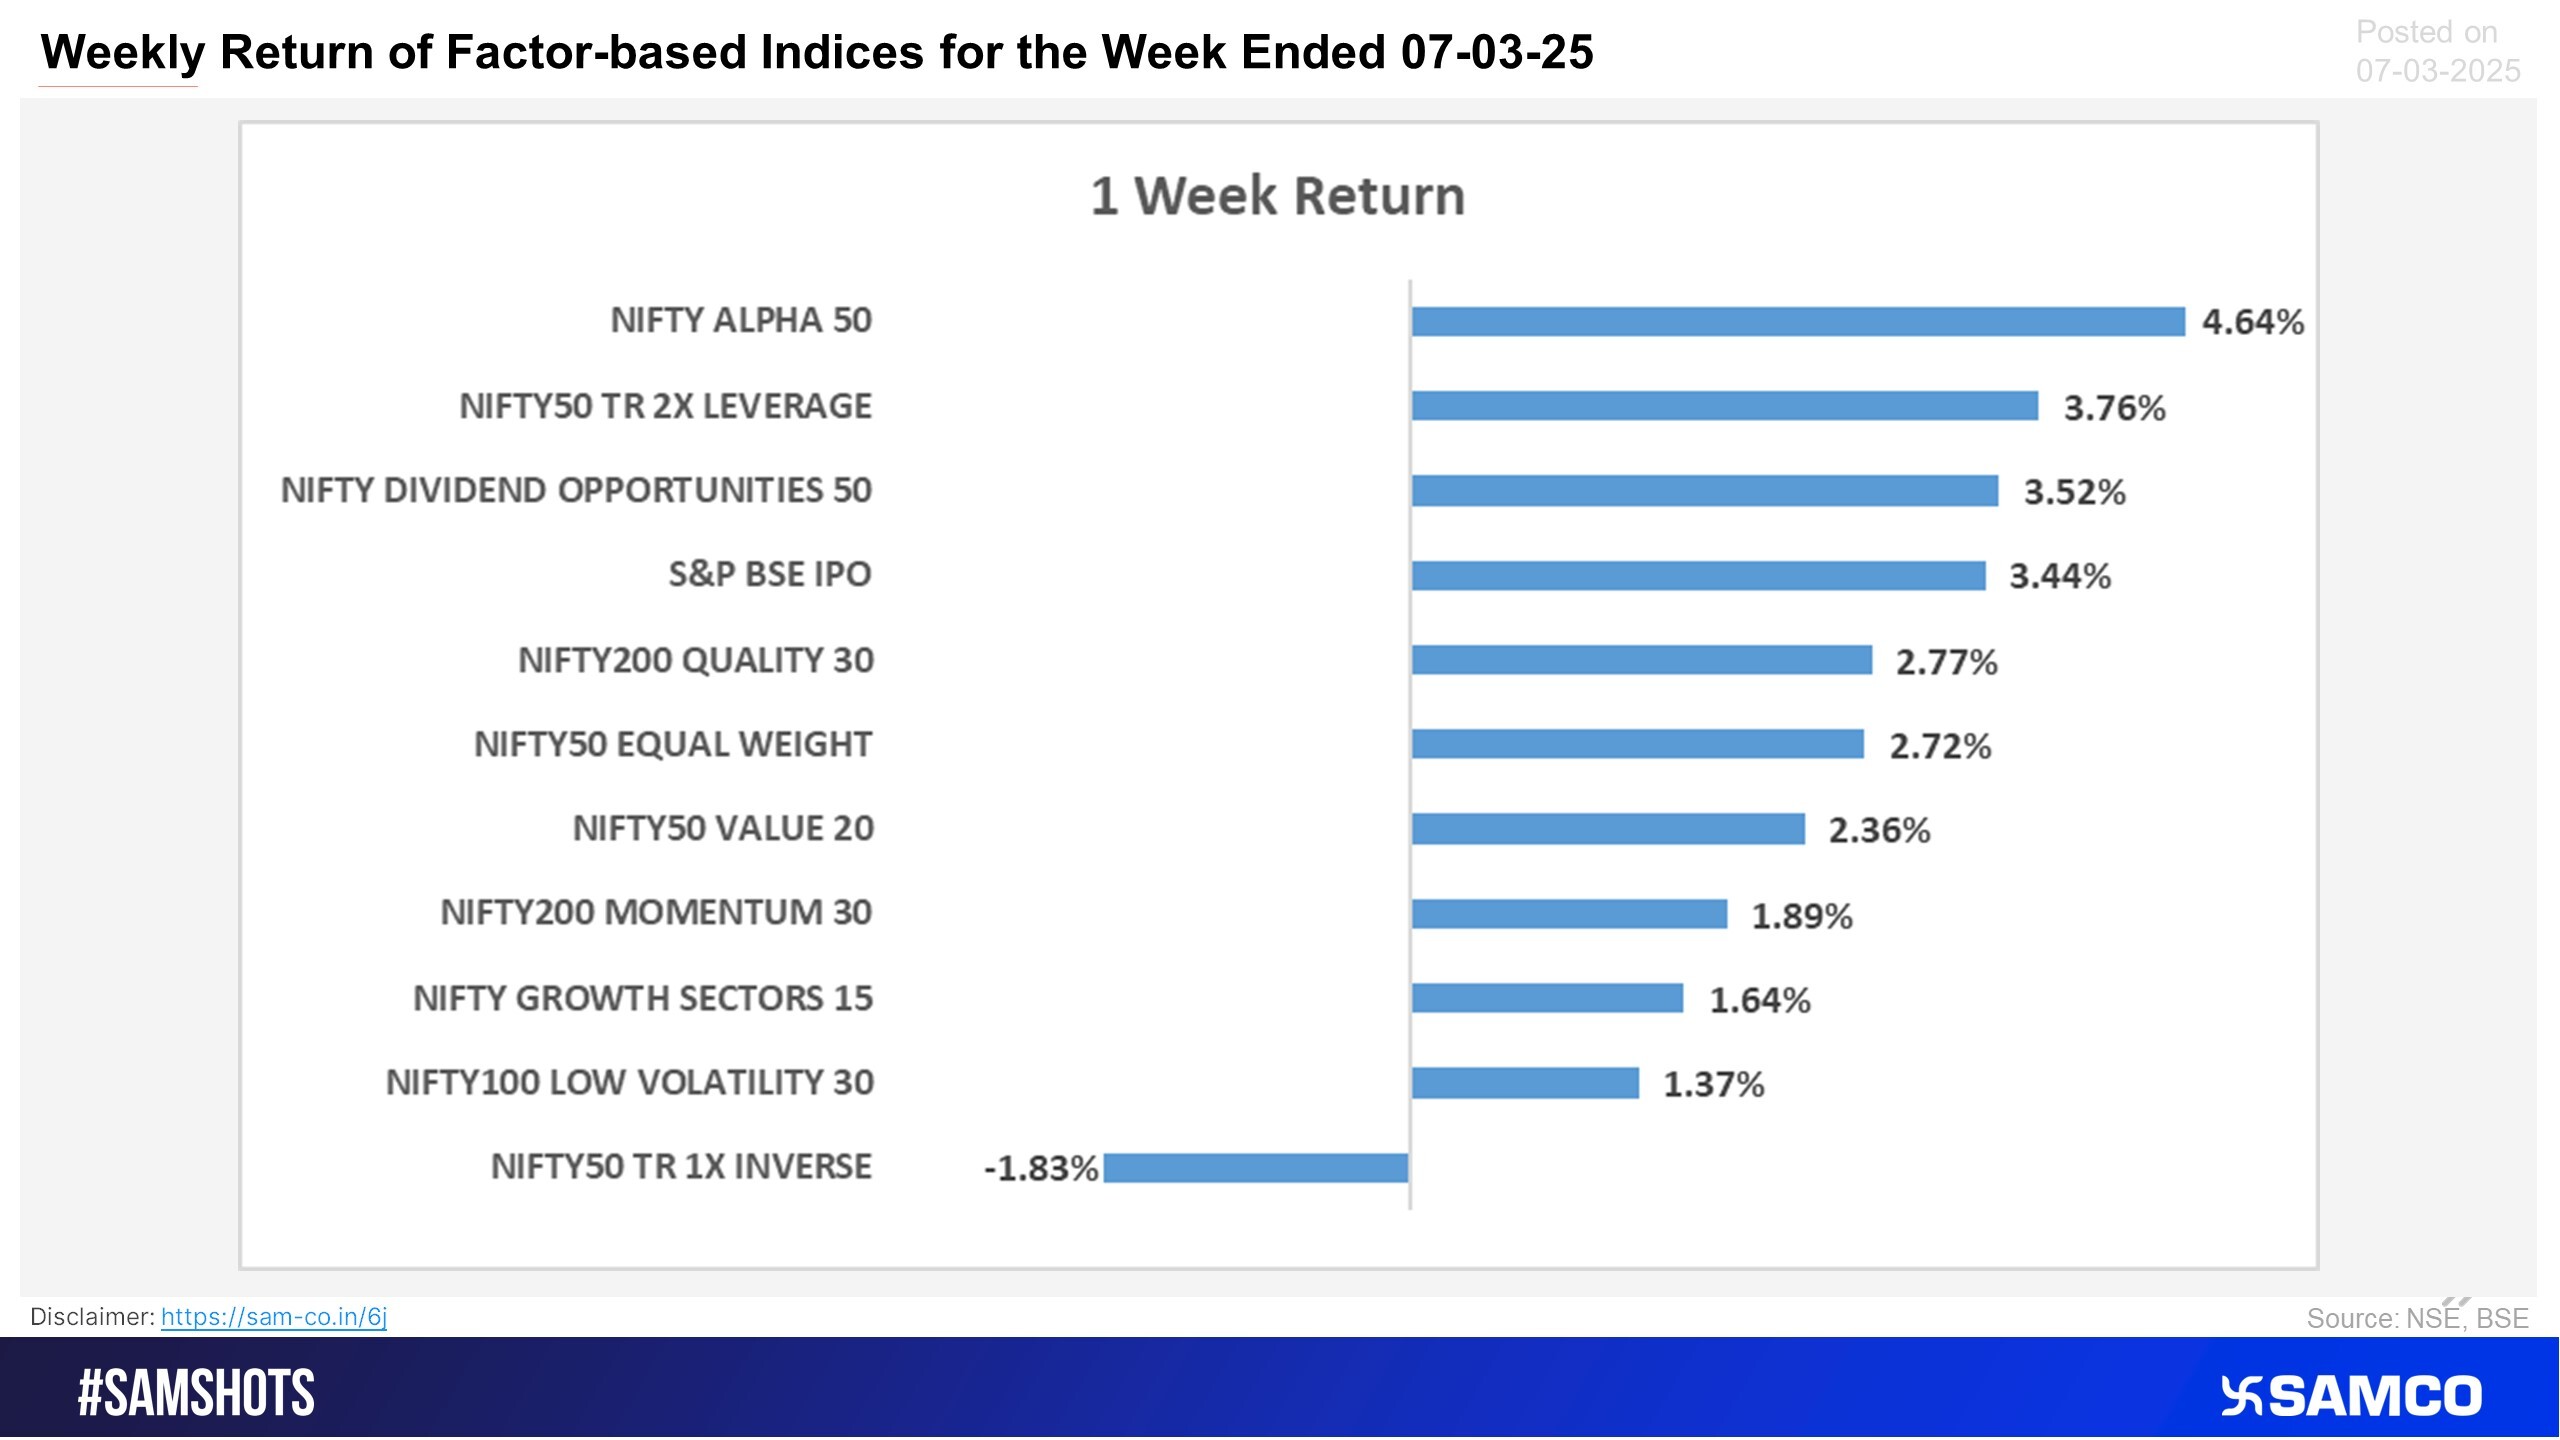
All positive factors have gained this week as the broader market moved upwards, Alpha factor leads
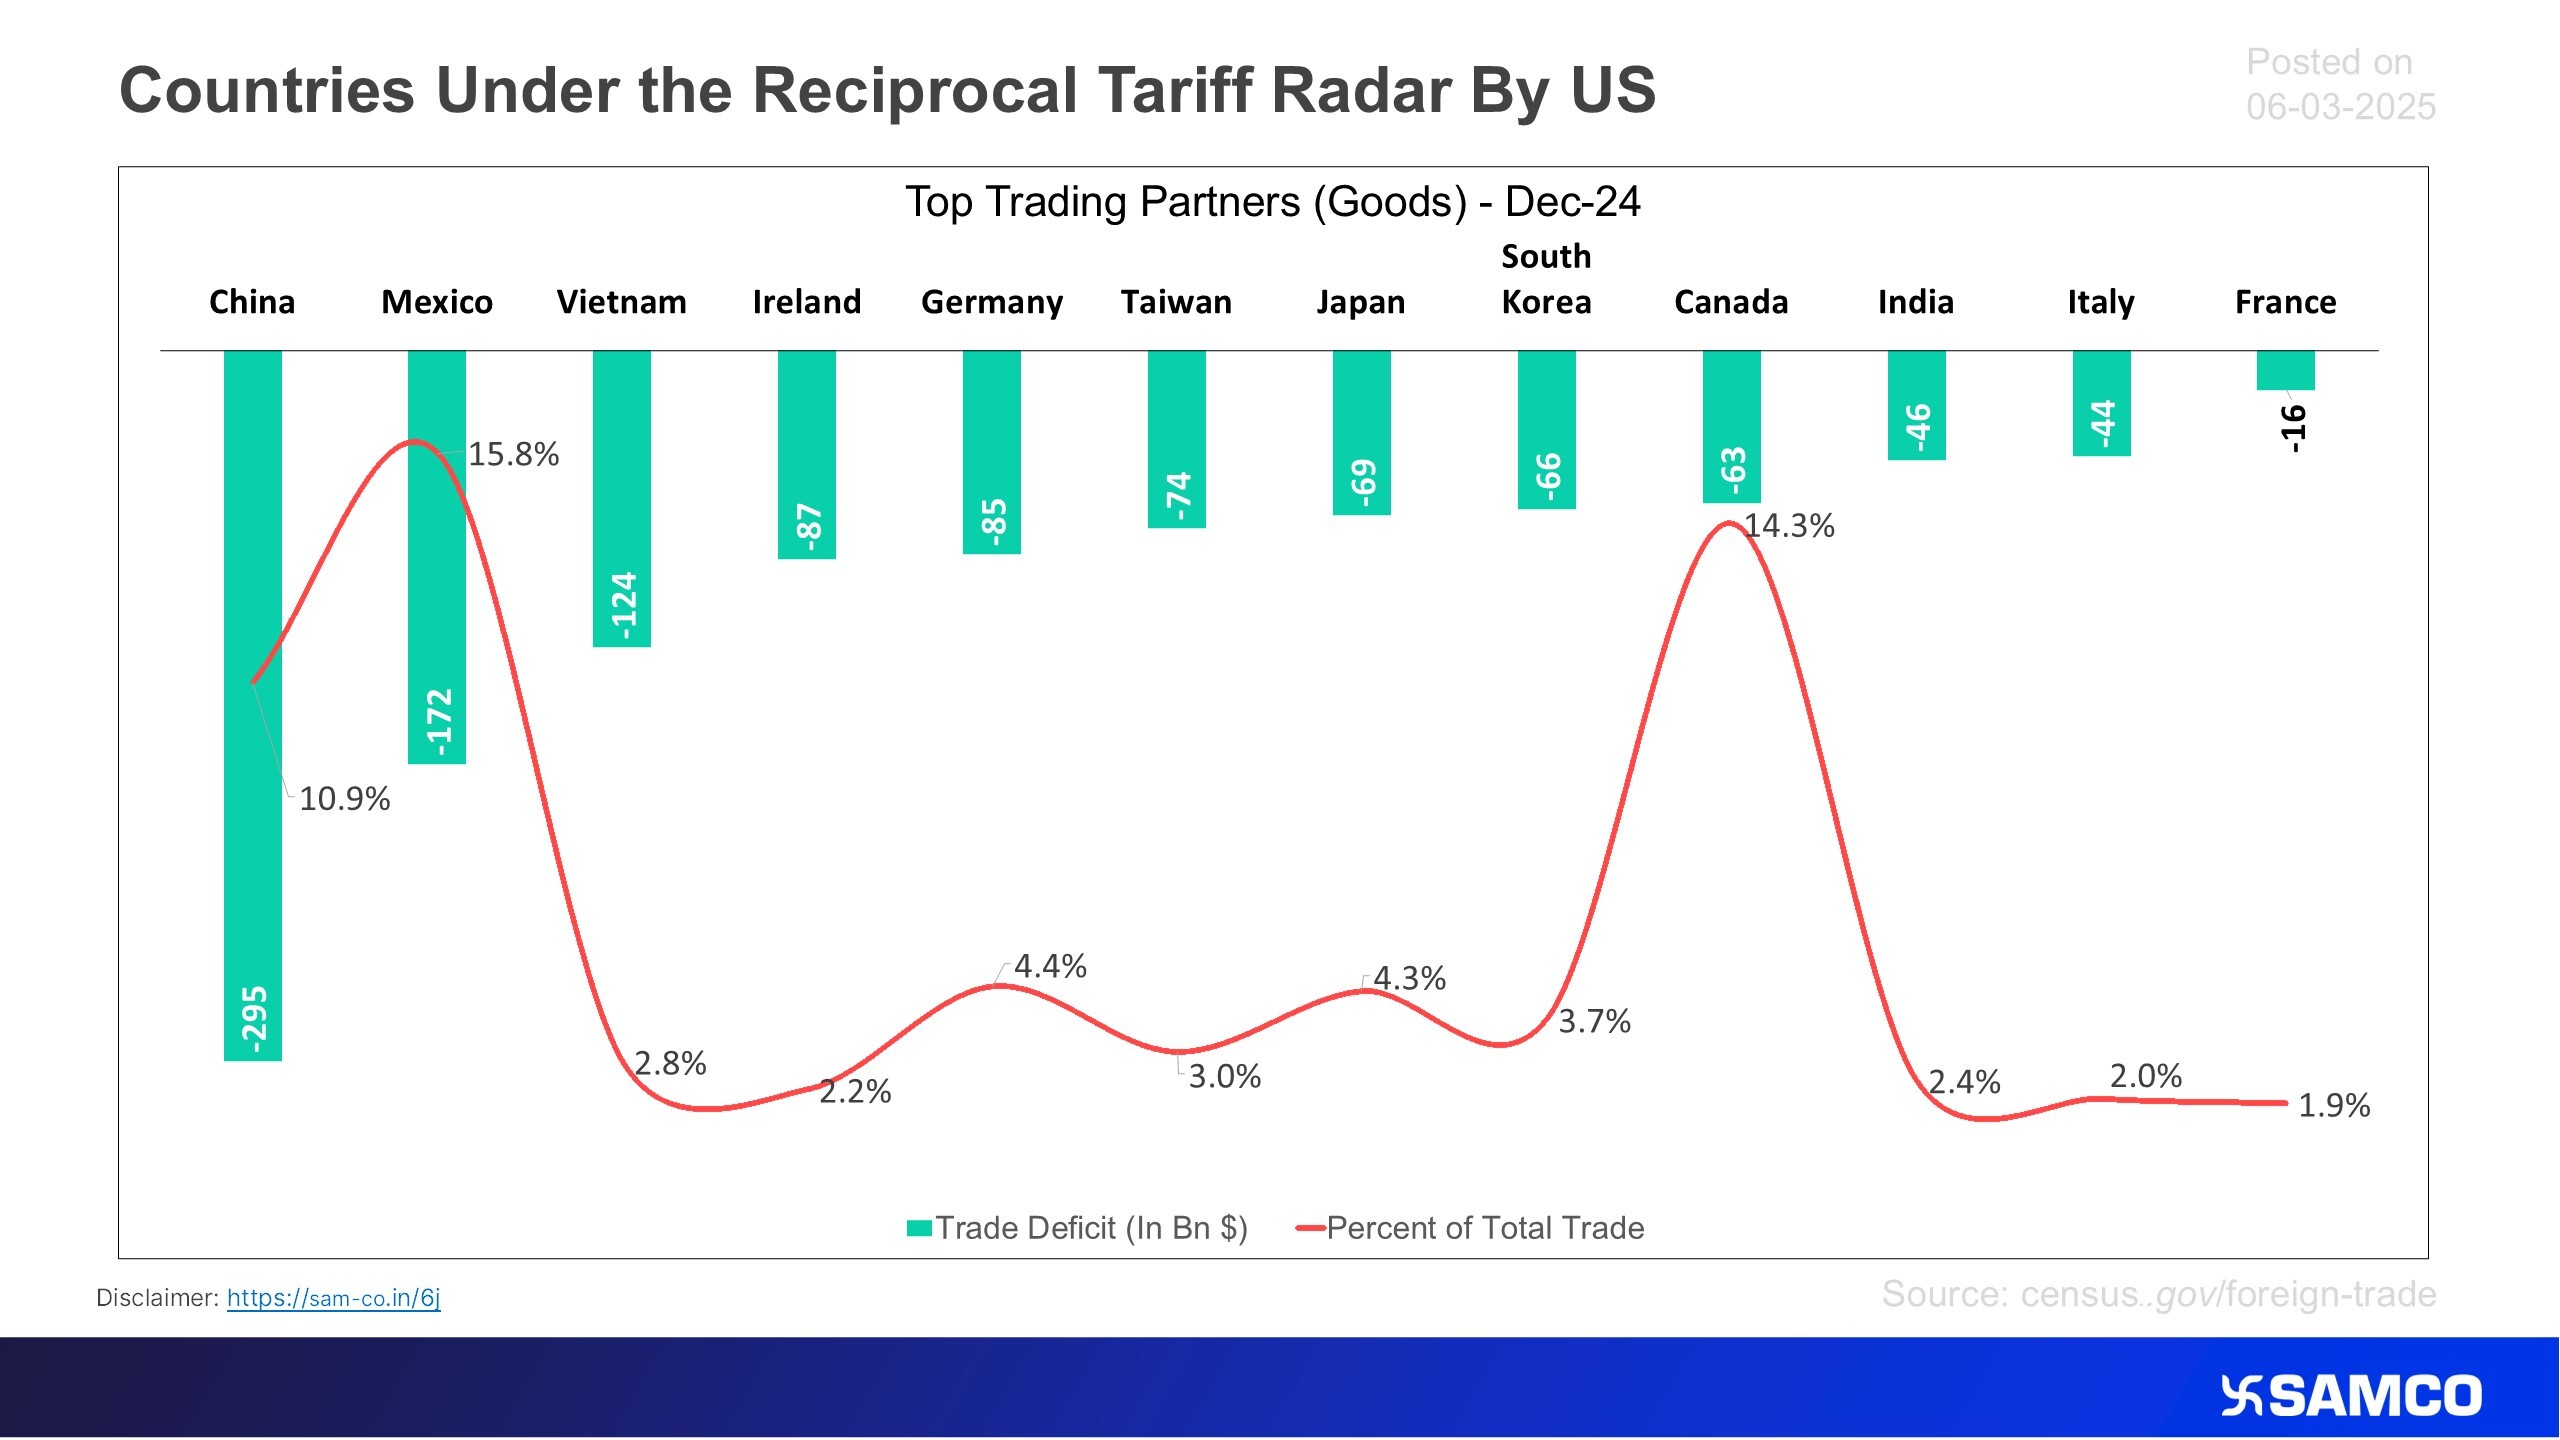
Here’s the list of countries that are under reciprocal tariff radar under Trump administration.
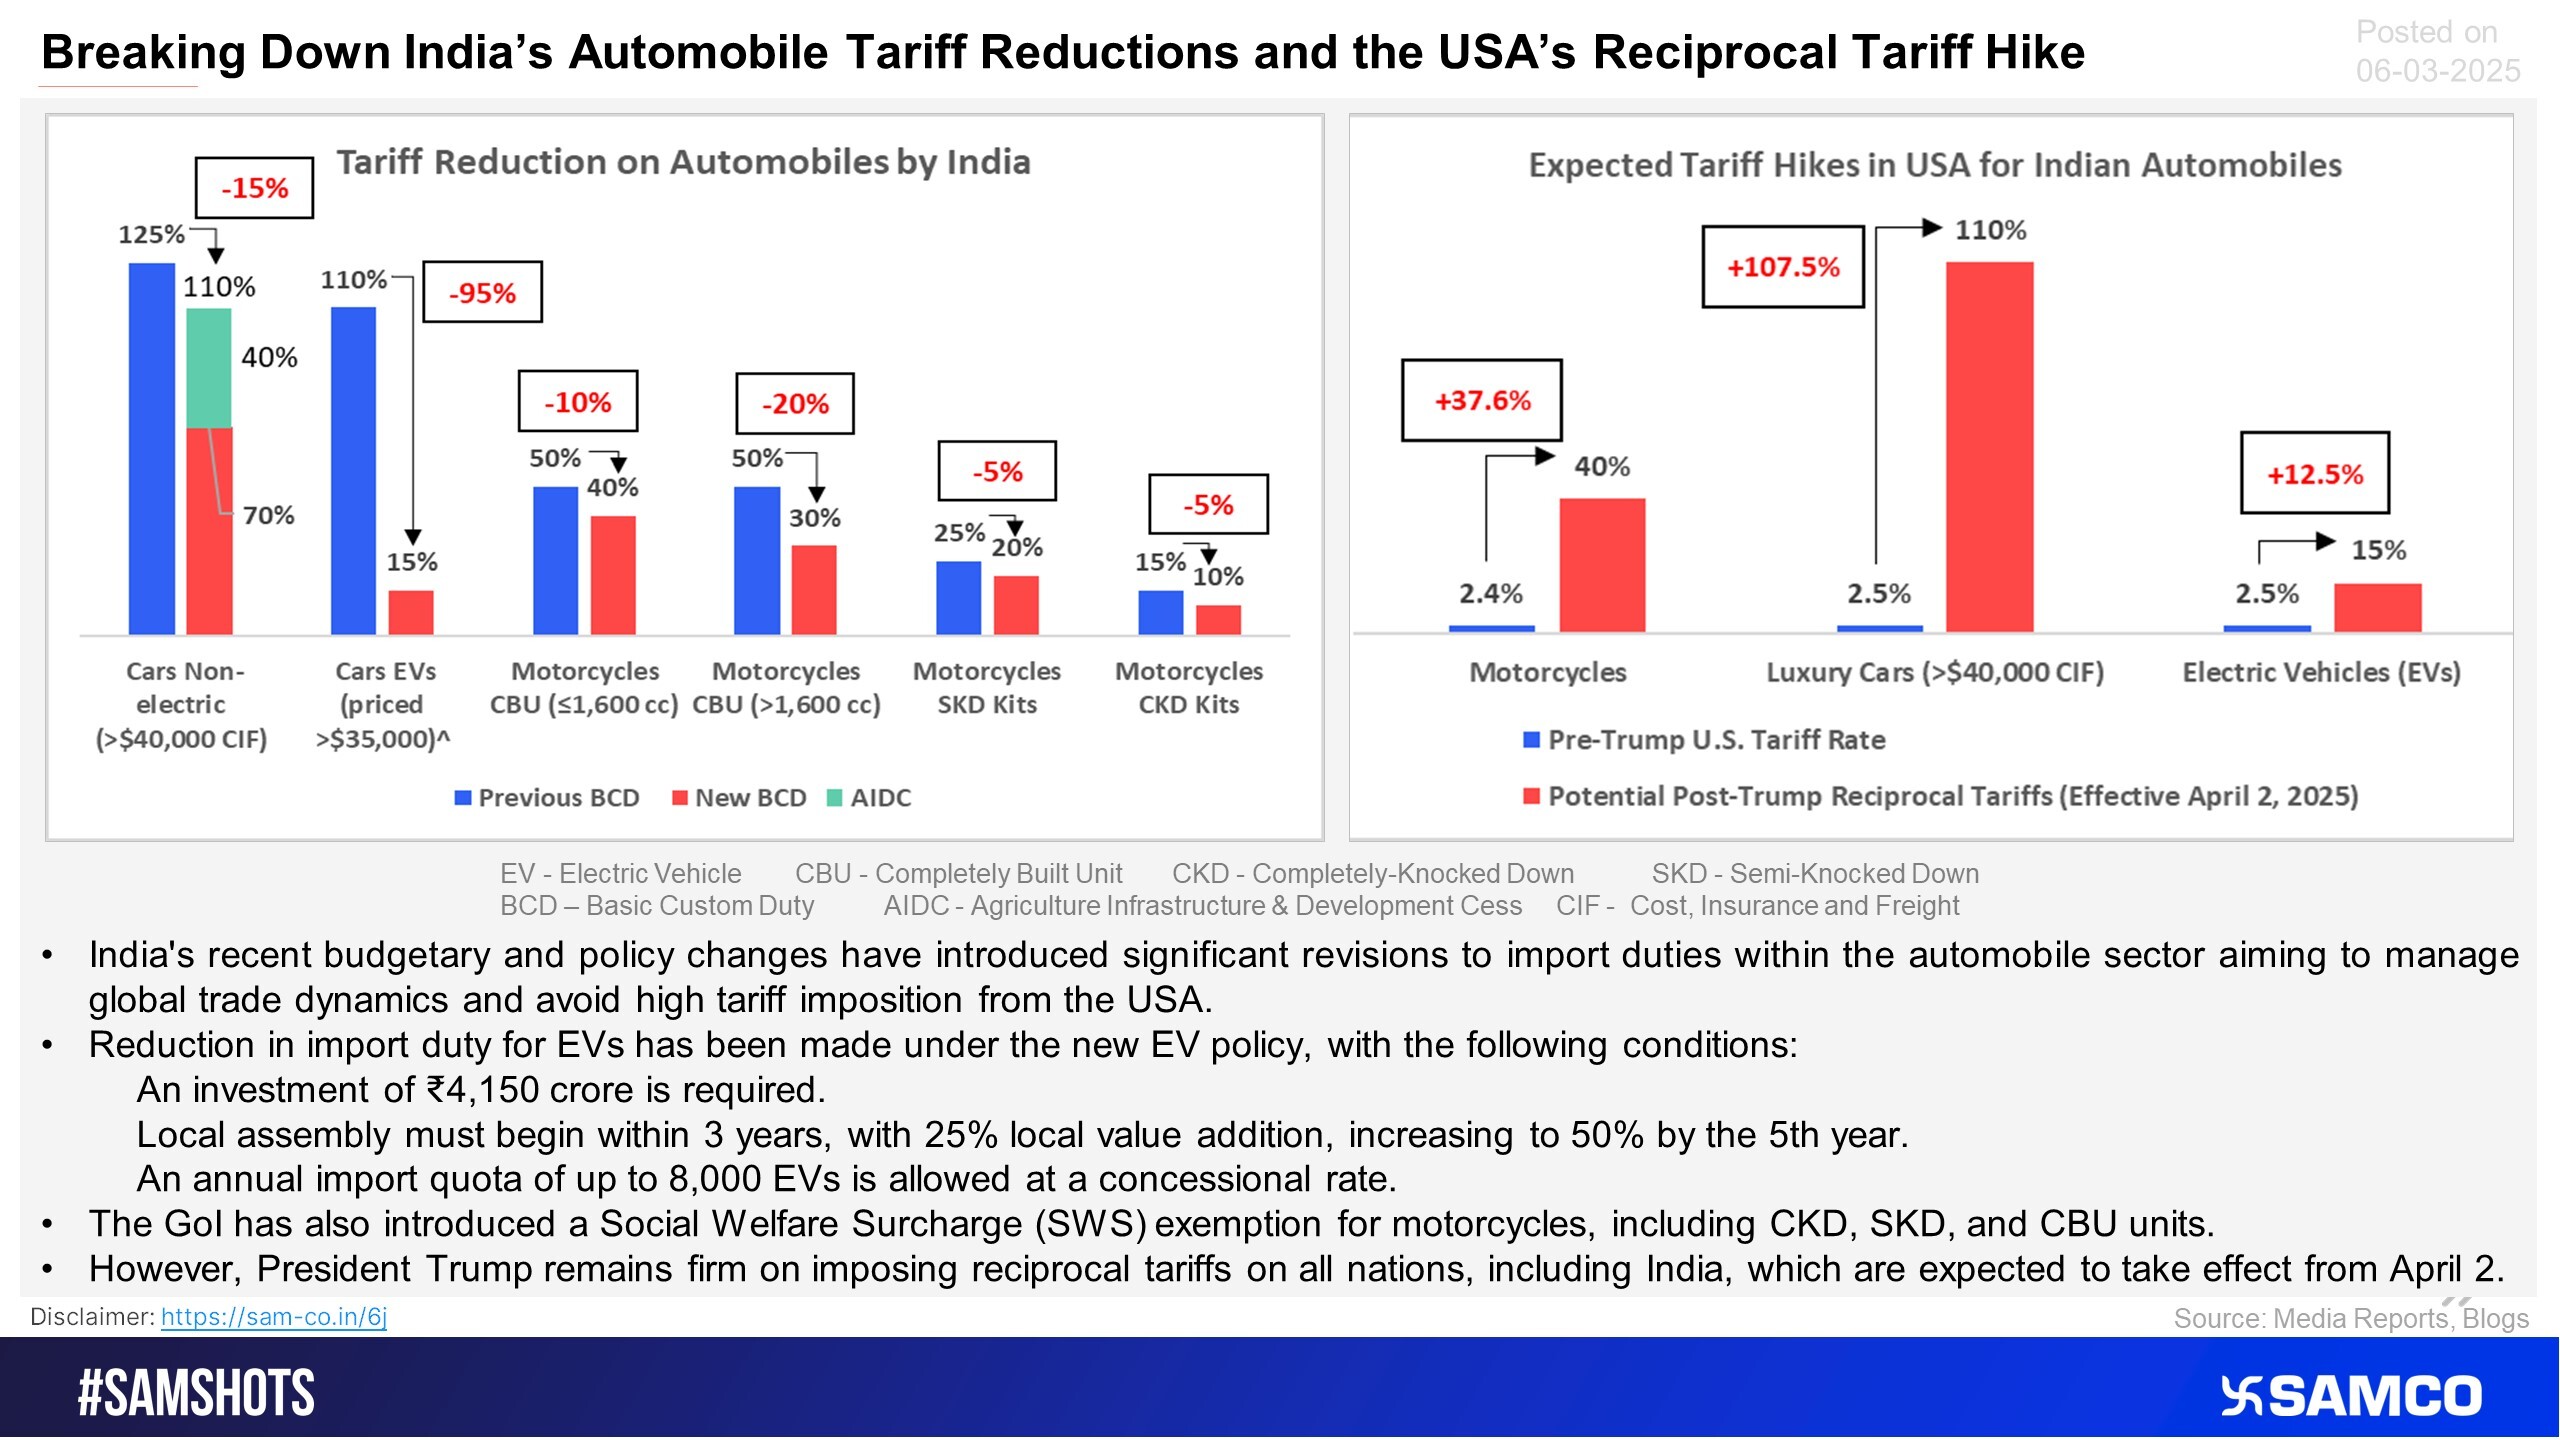
Here’s a glimpse of changing dynamics in tariffs on Automobiles in India & USA.
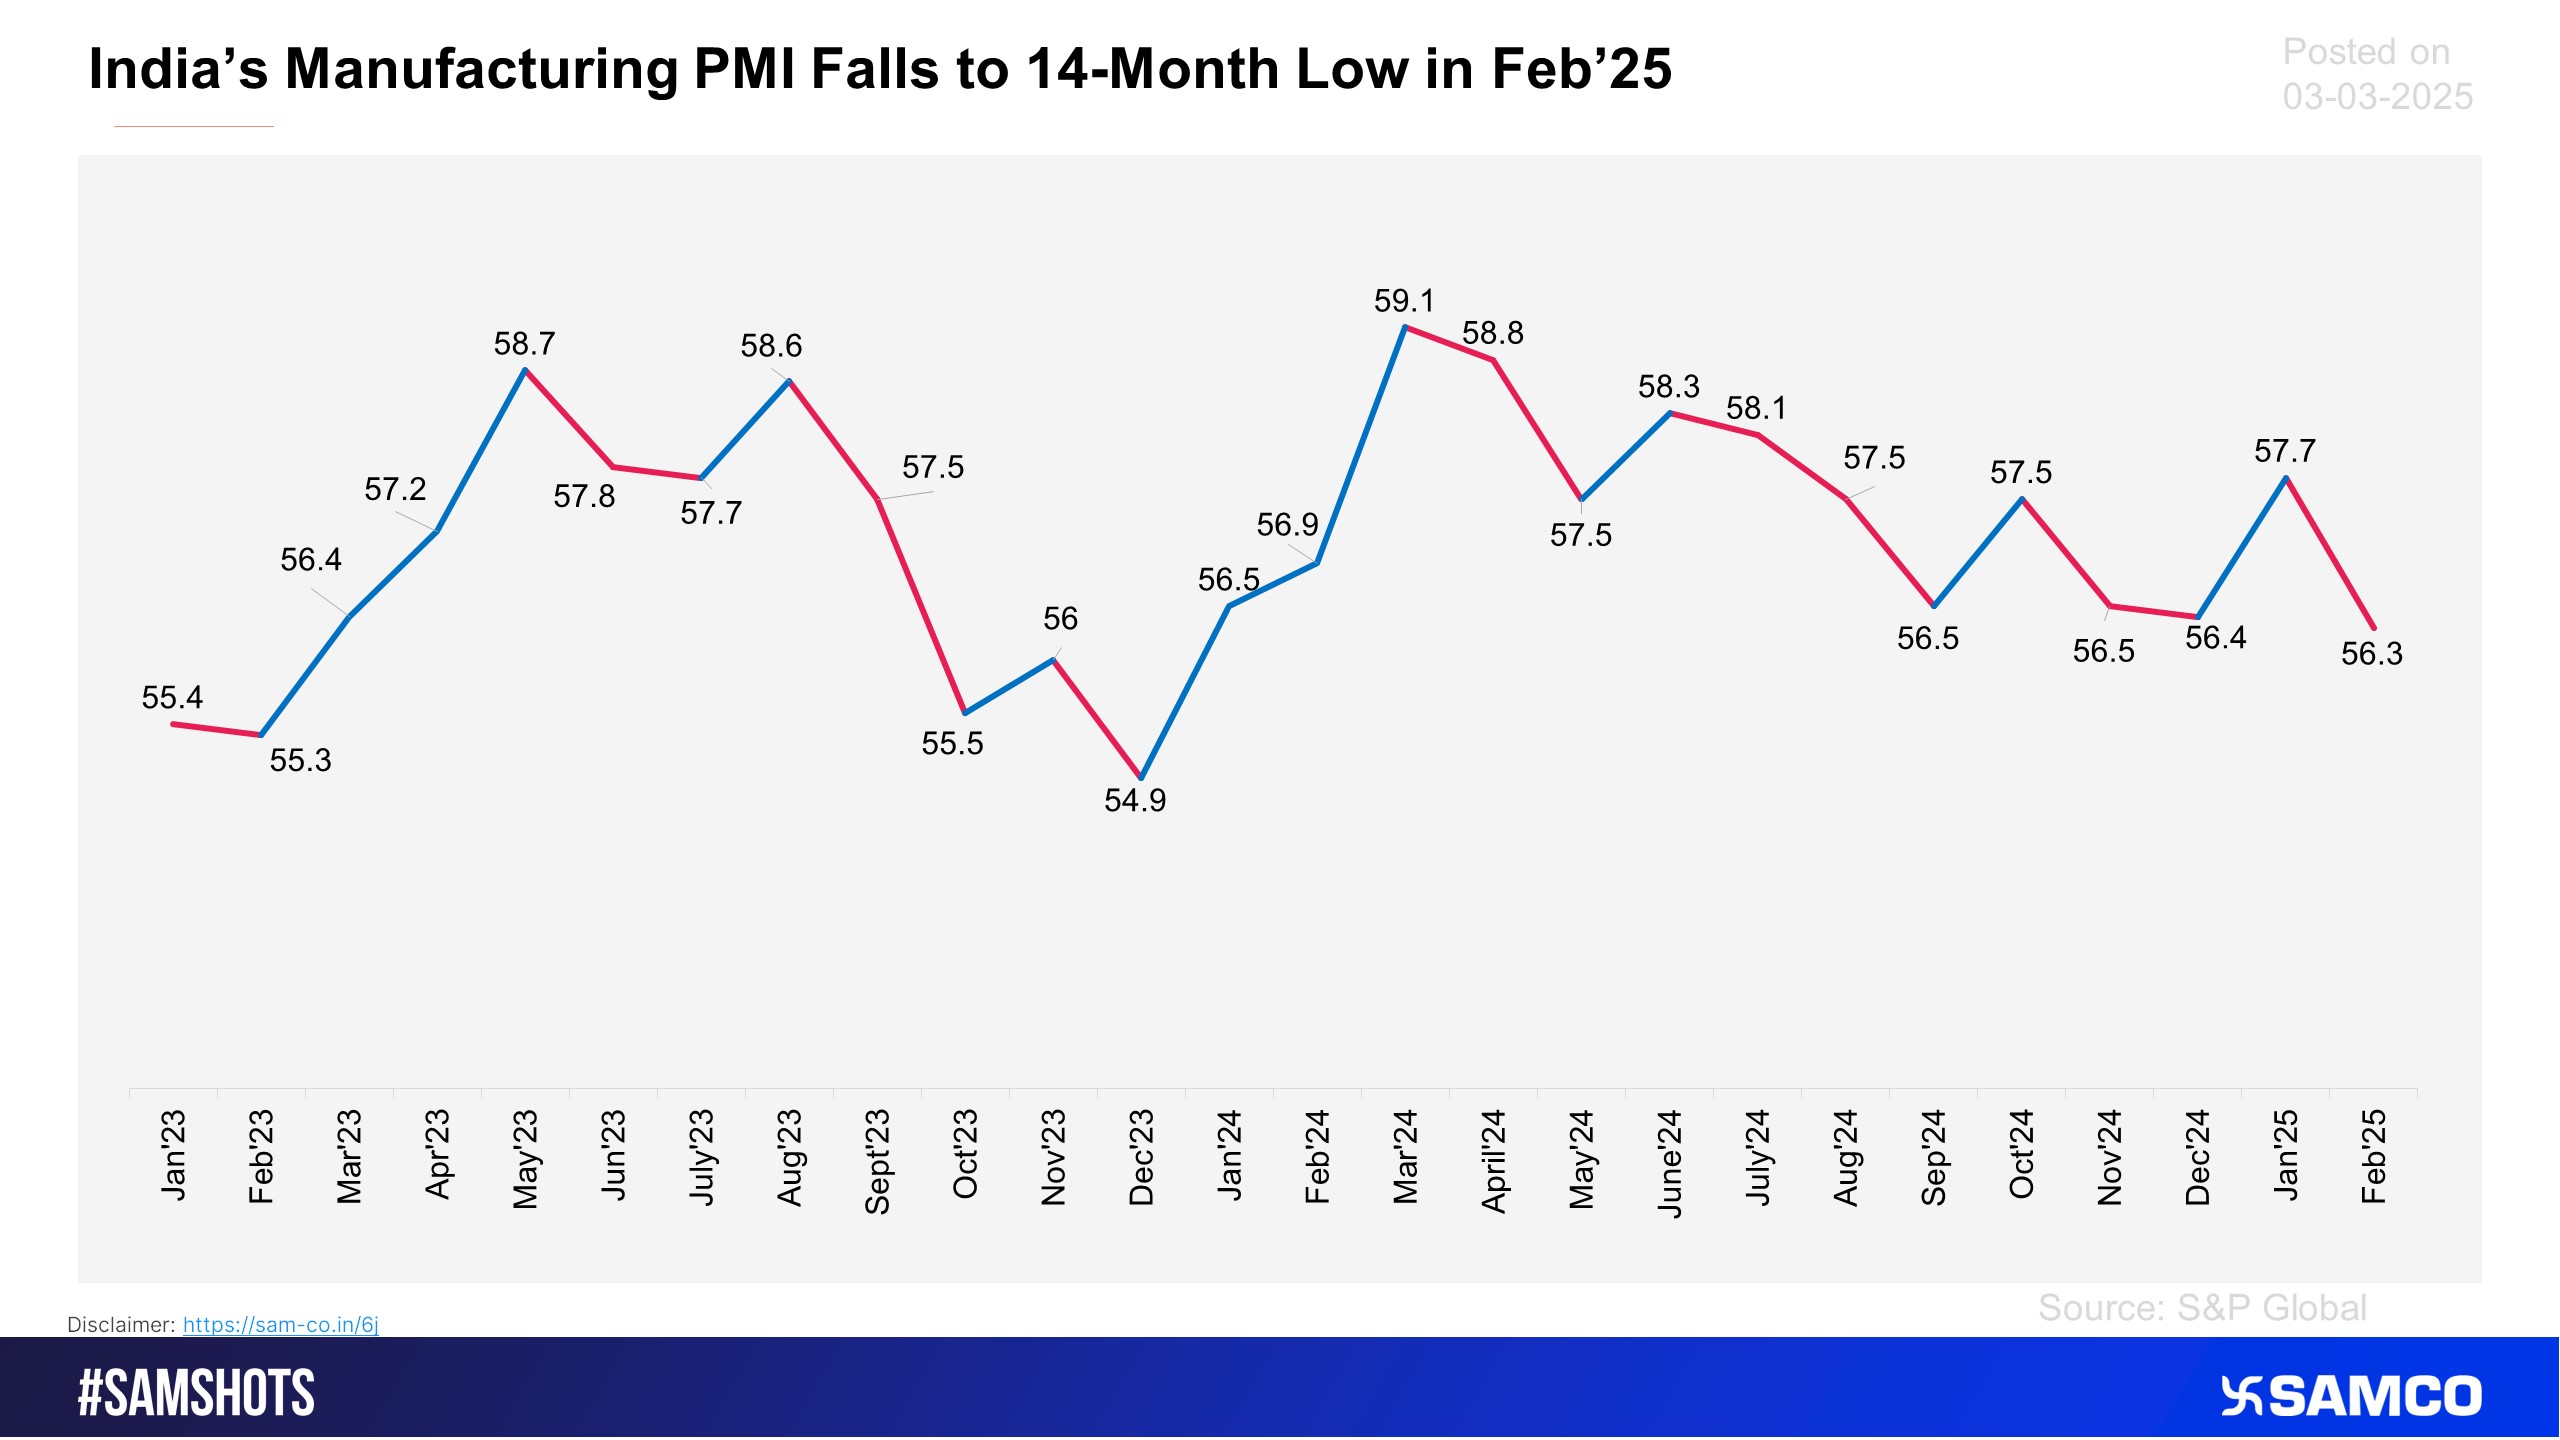
Although the pace of expansion was the slowest since December 2023, operating conditions remained strong. Business confidence remained upbeat, with nearly one-third of respondents anticipating increased output in the coming year.
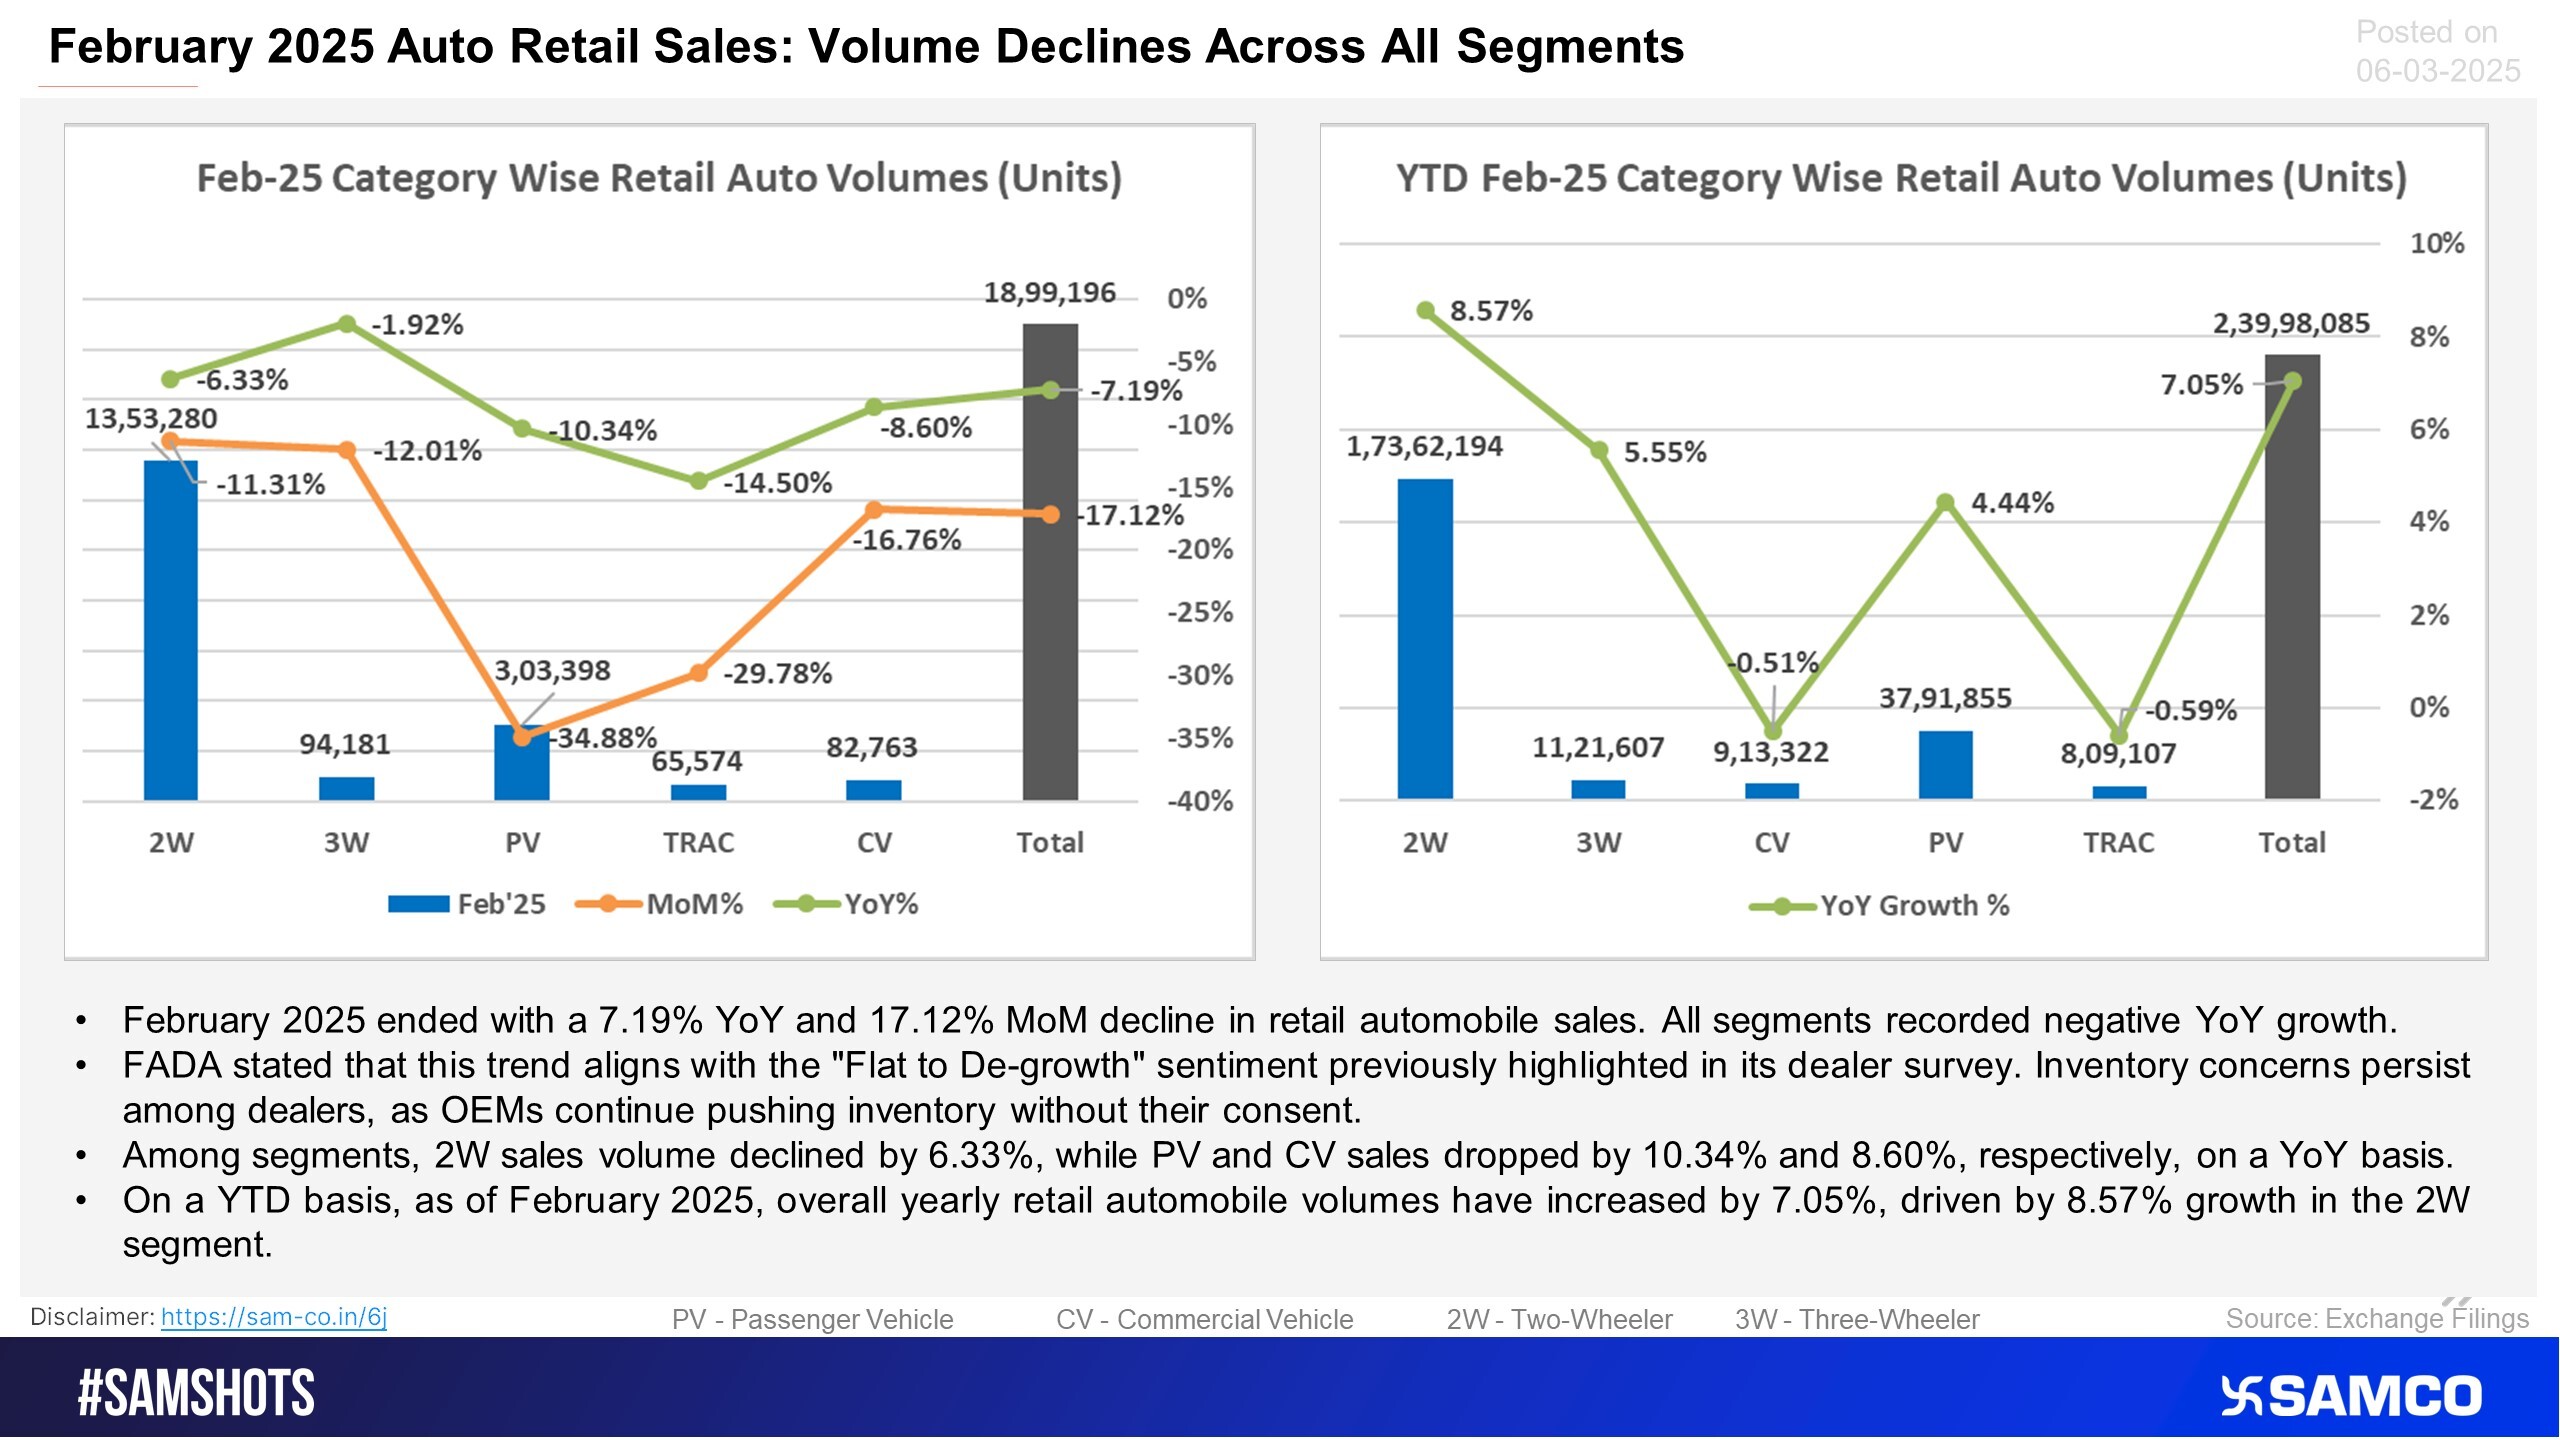
Vehicle segment wise retail volumes for February are summarised below:
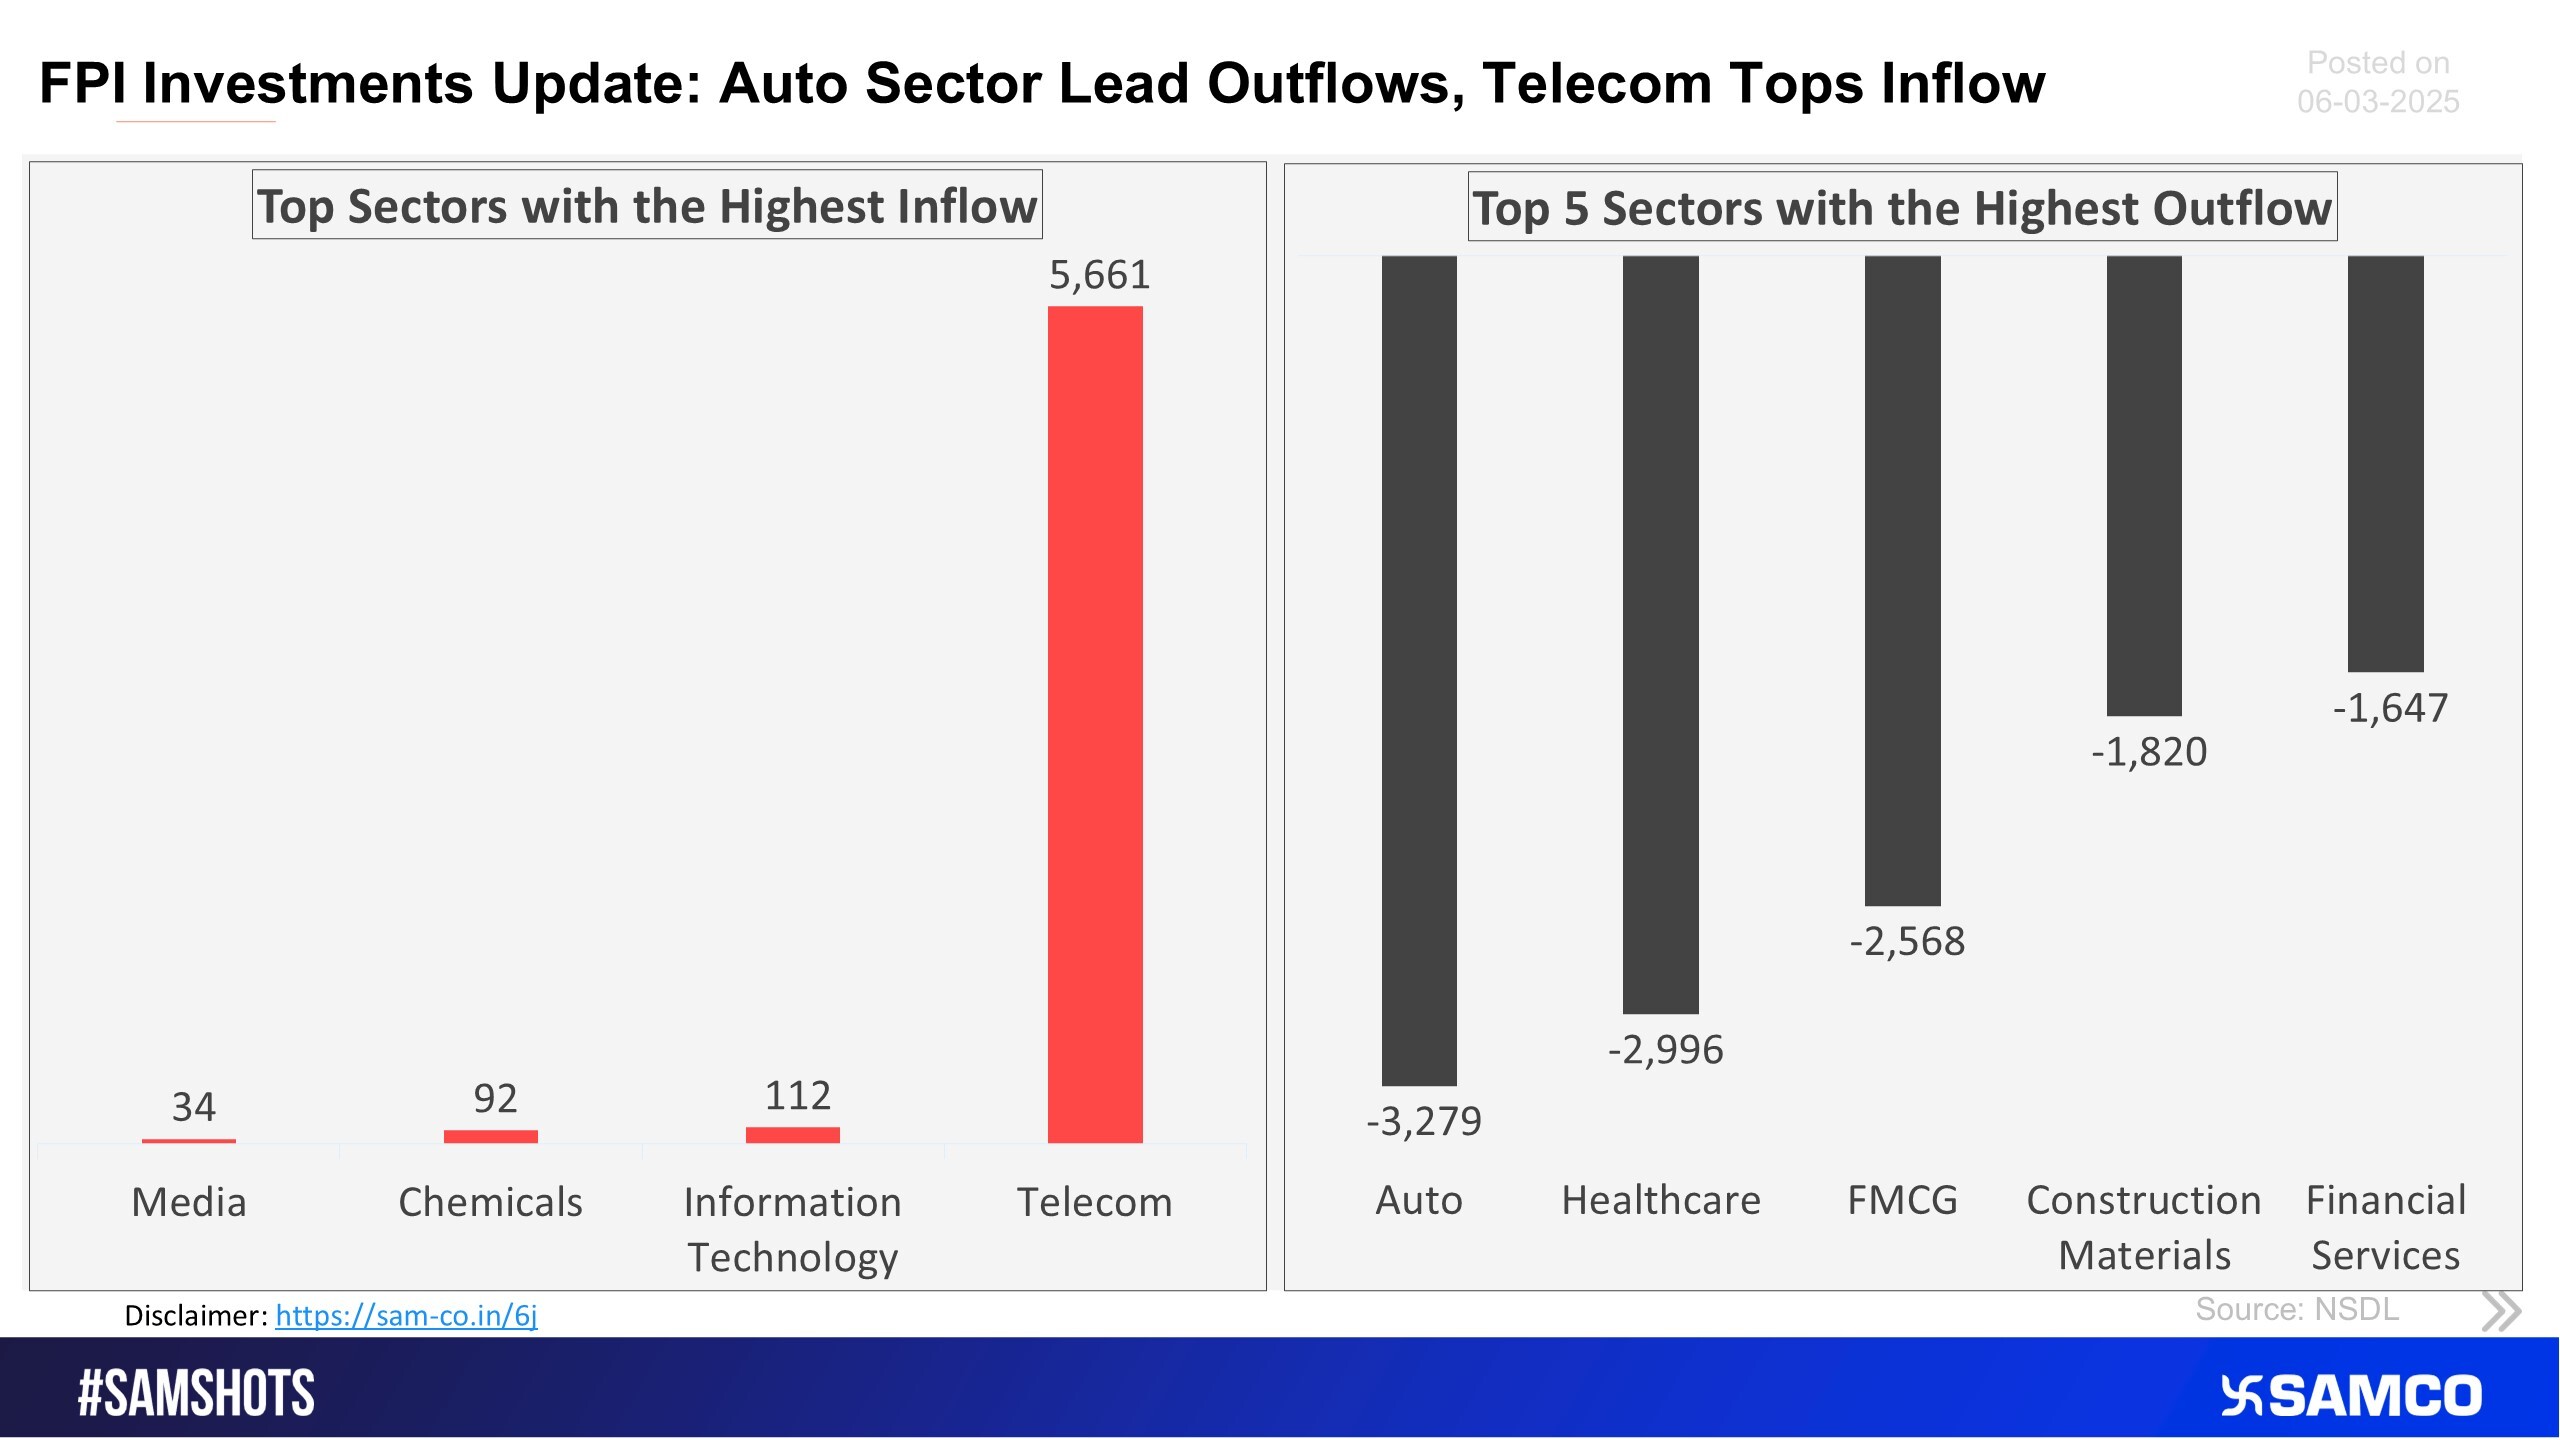
The chart shows the top 5 sectors that witnessed FPI’s highest inflow and outflow in the latest quarter.
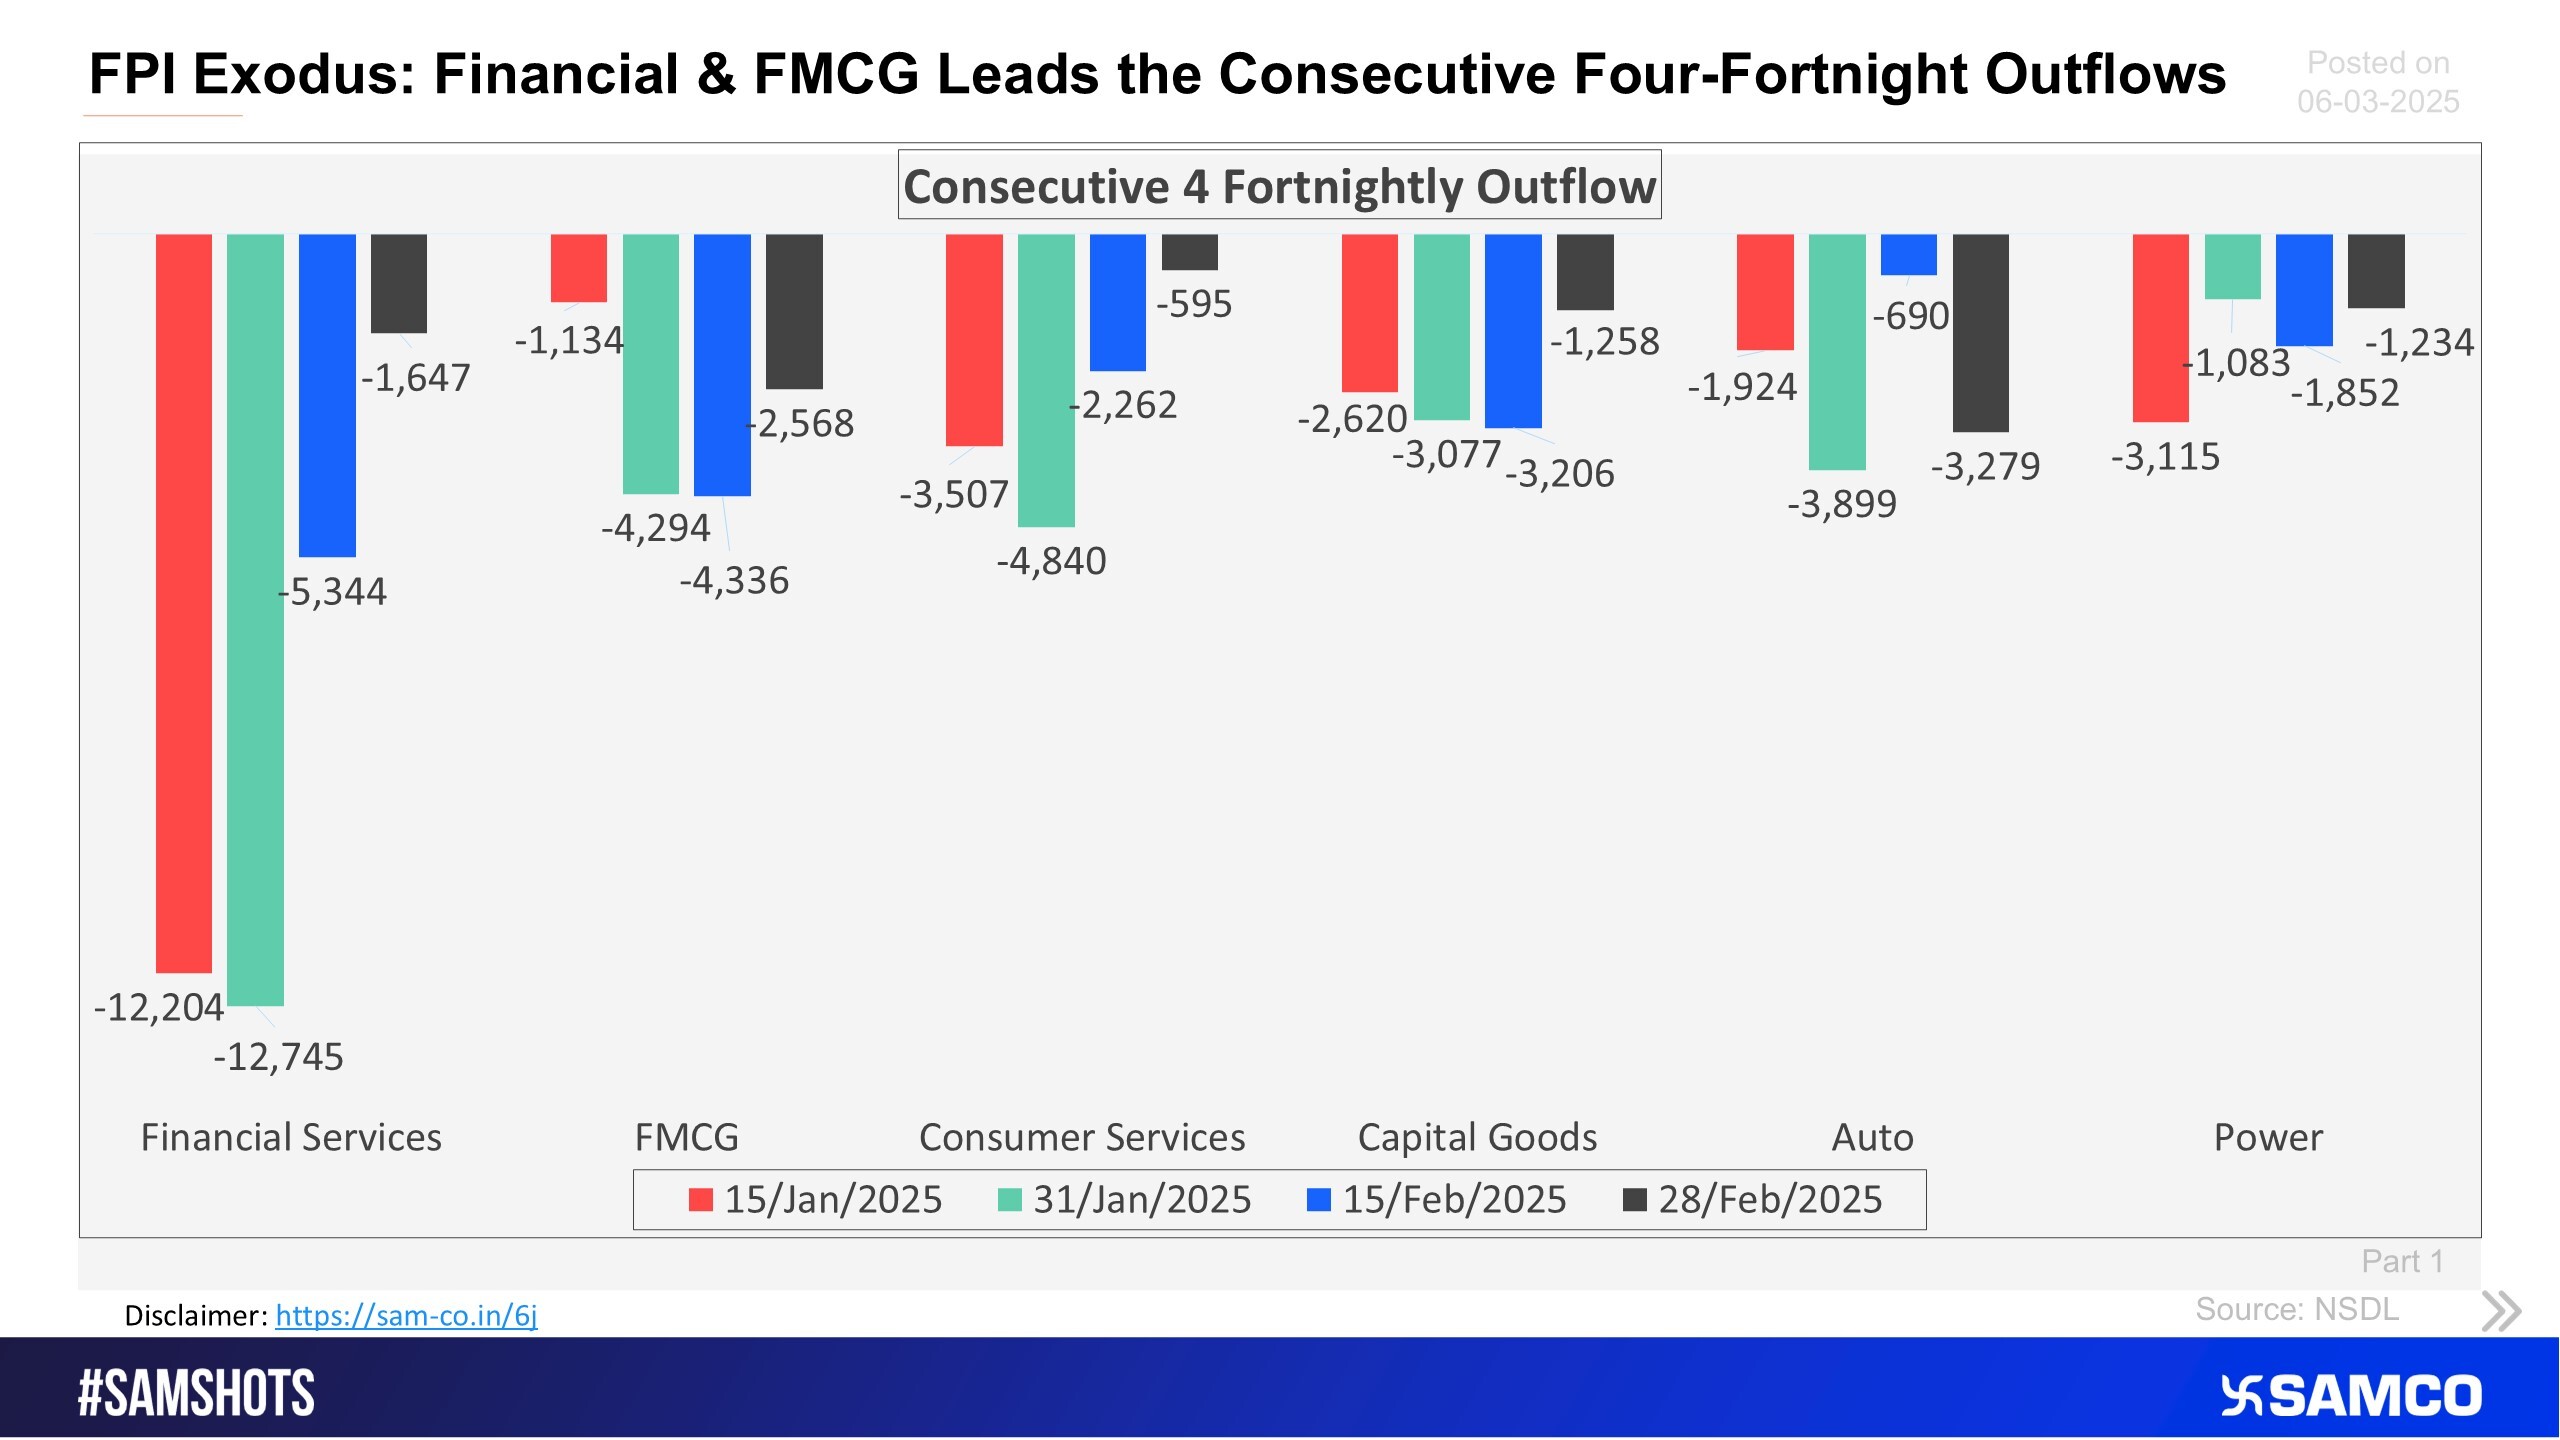
The sectors shown in the chart have witnessed consecutive 4 fortnightly outflows of FPI money (Part 1).
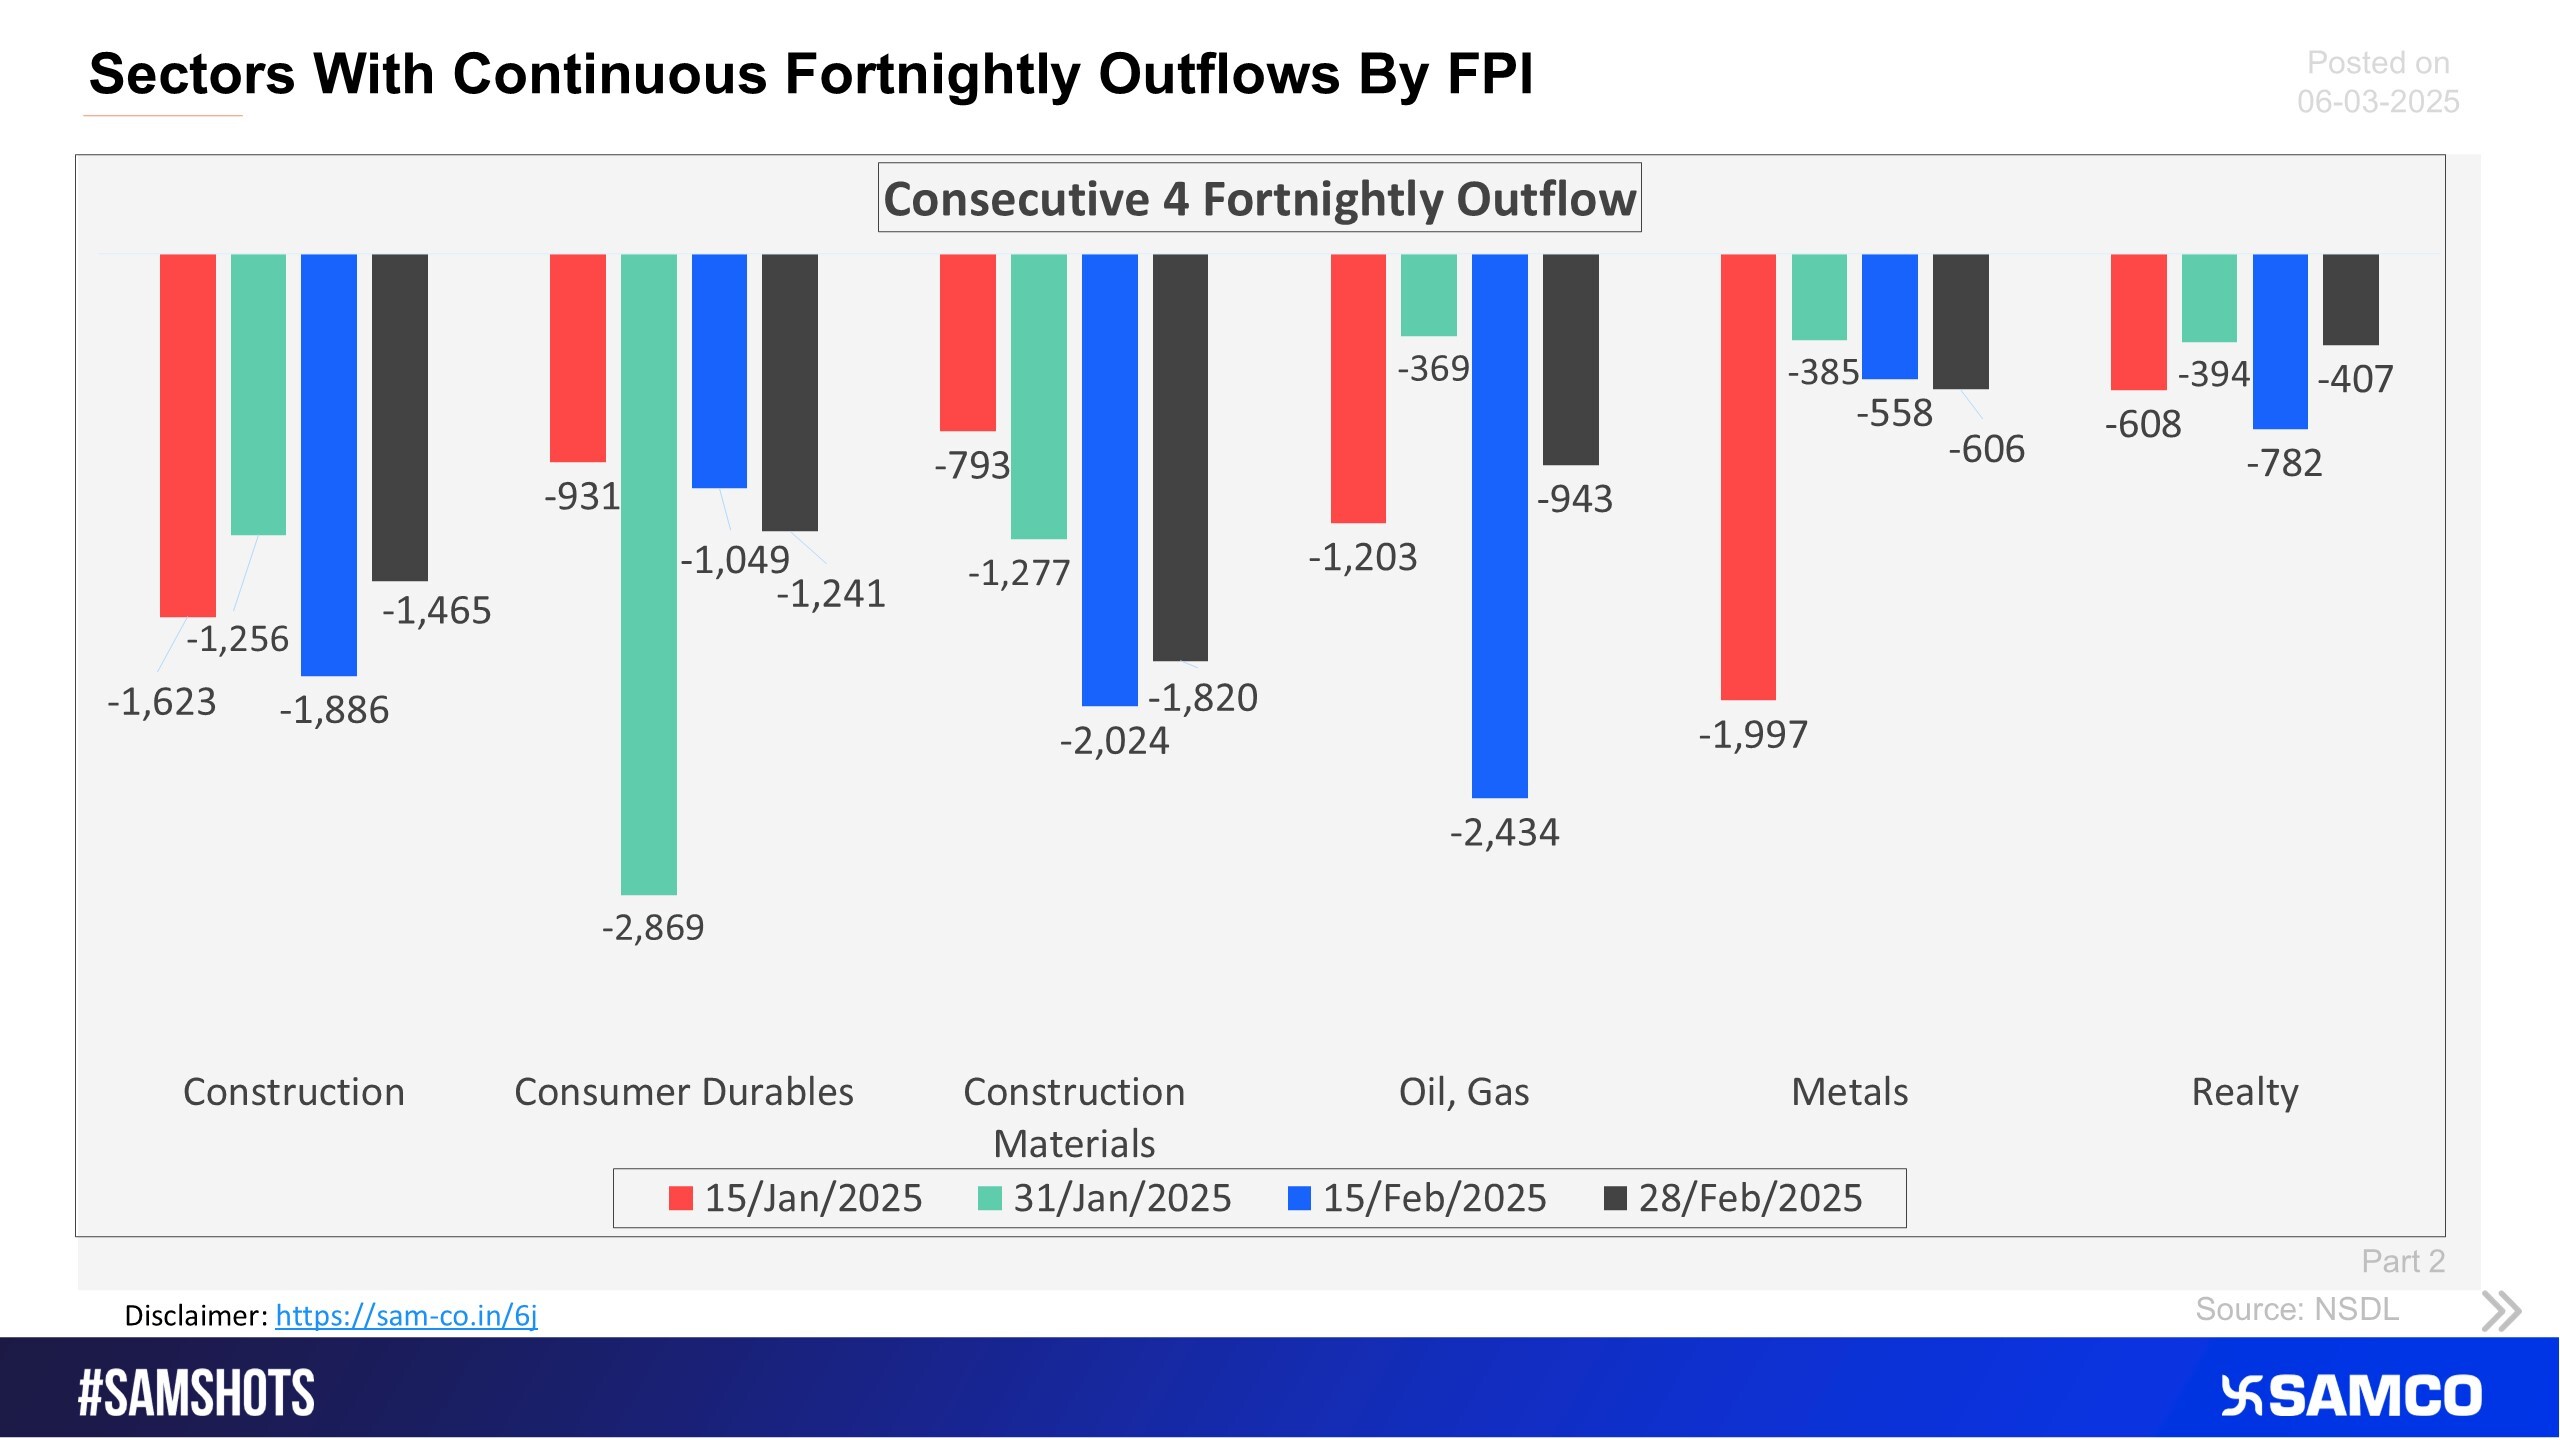
The sectors shown in the chart have witnessed consecutive 4 fortnightly outflows of FPI money (Part 2).
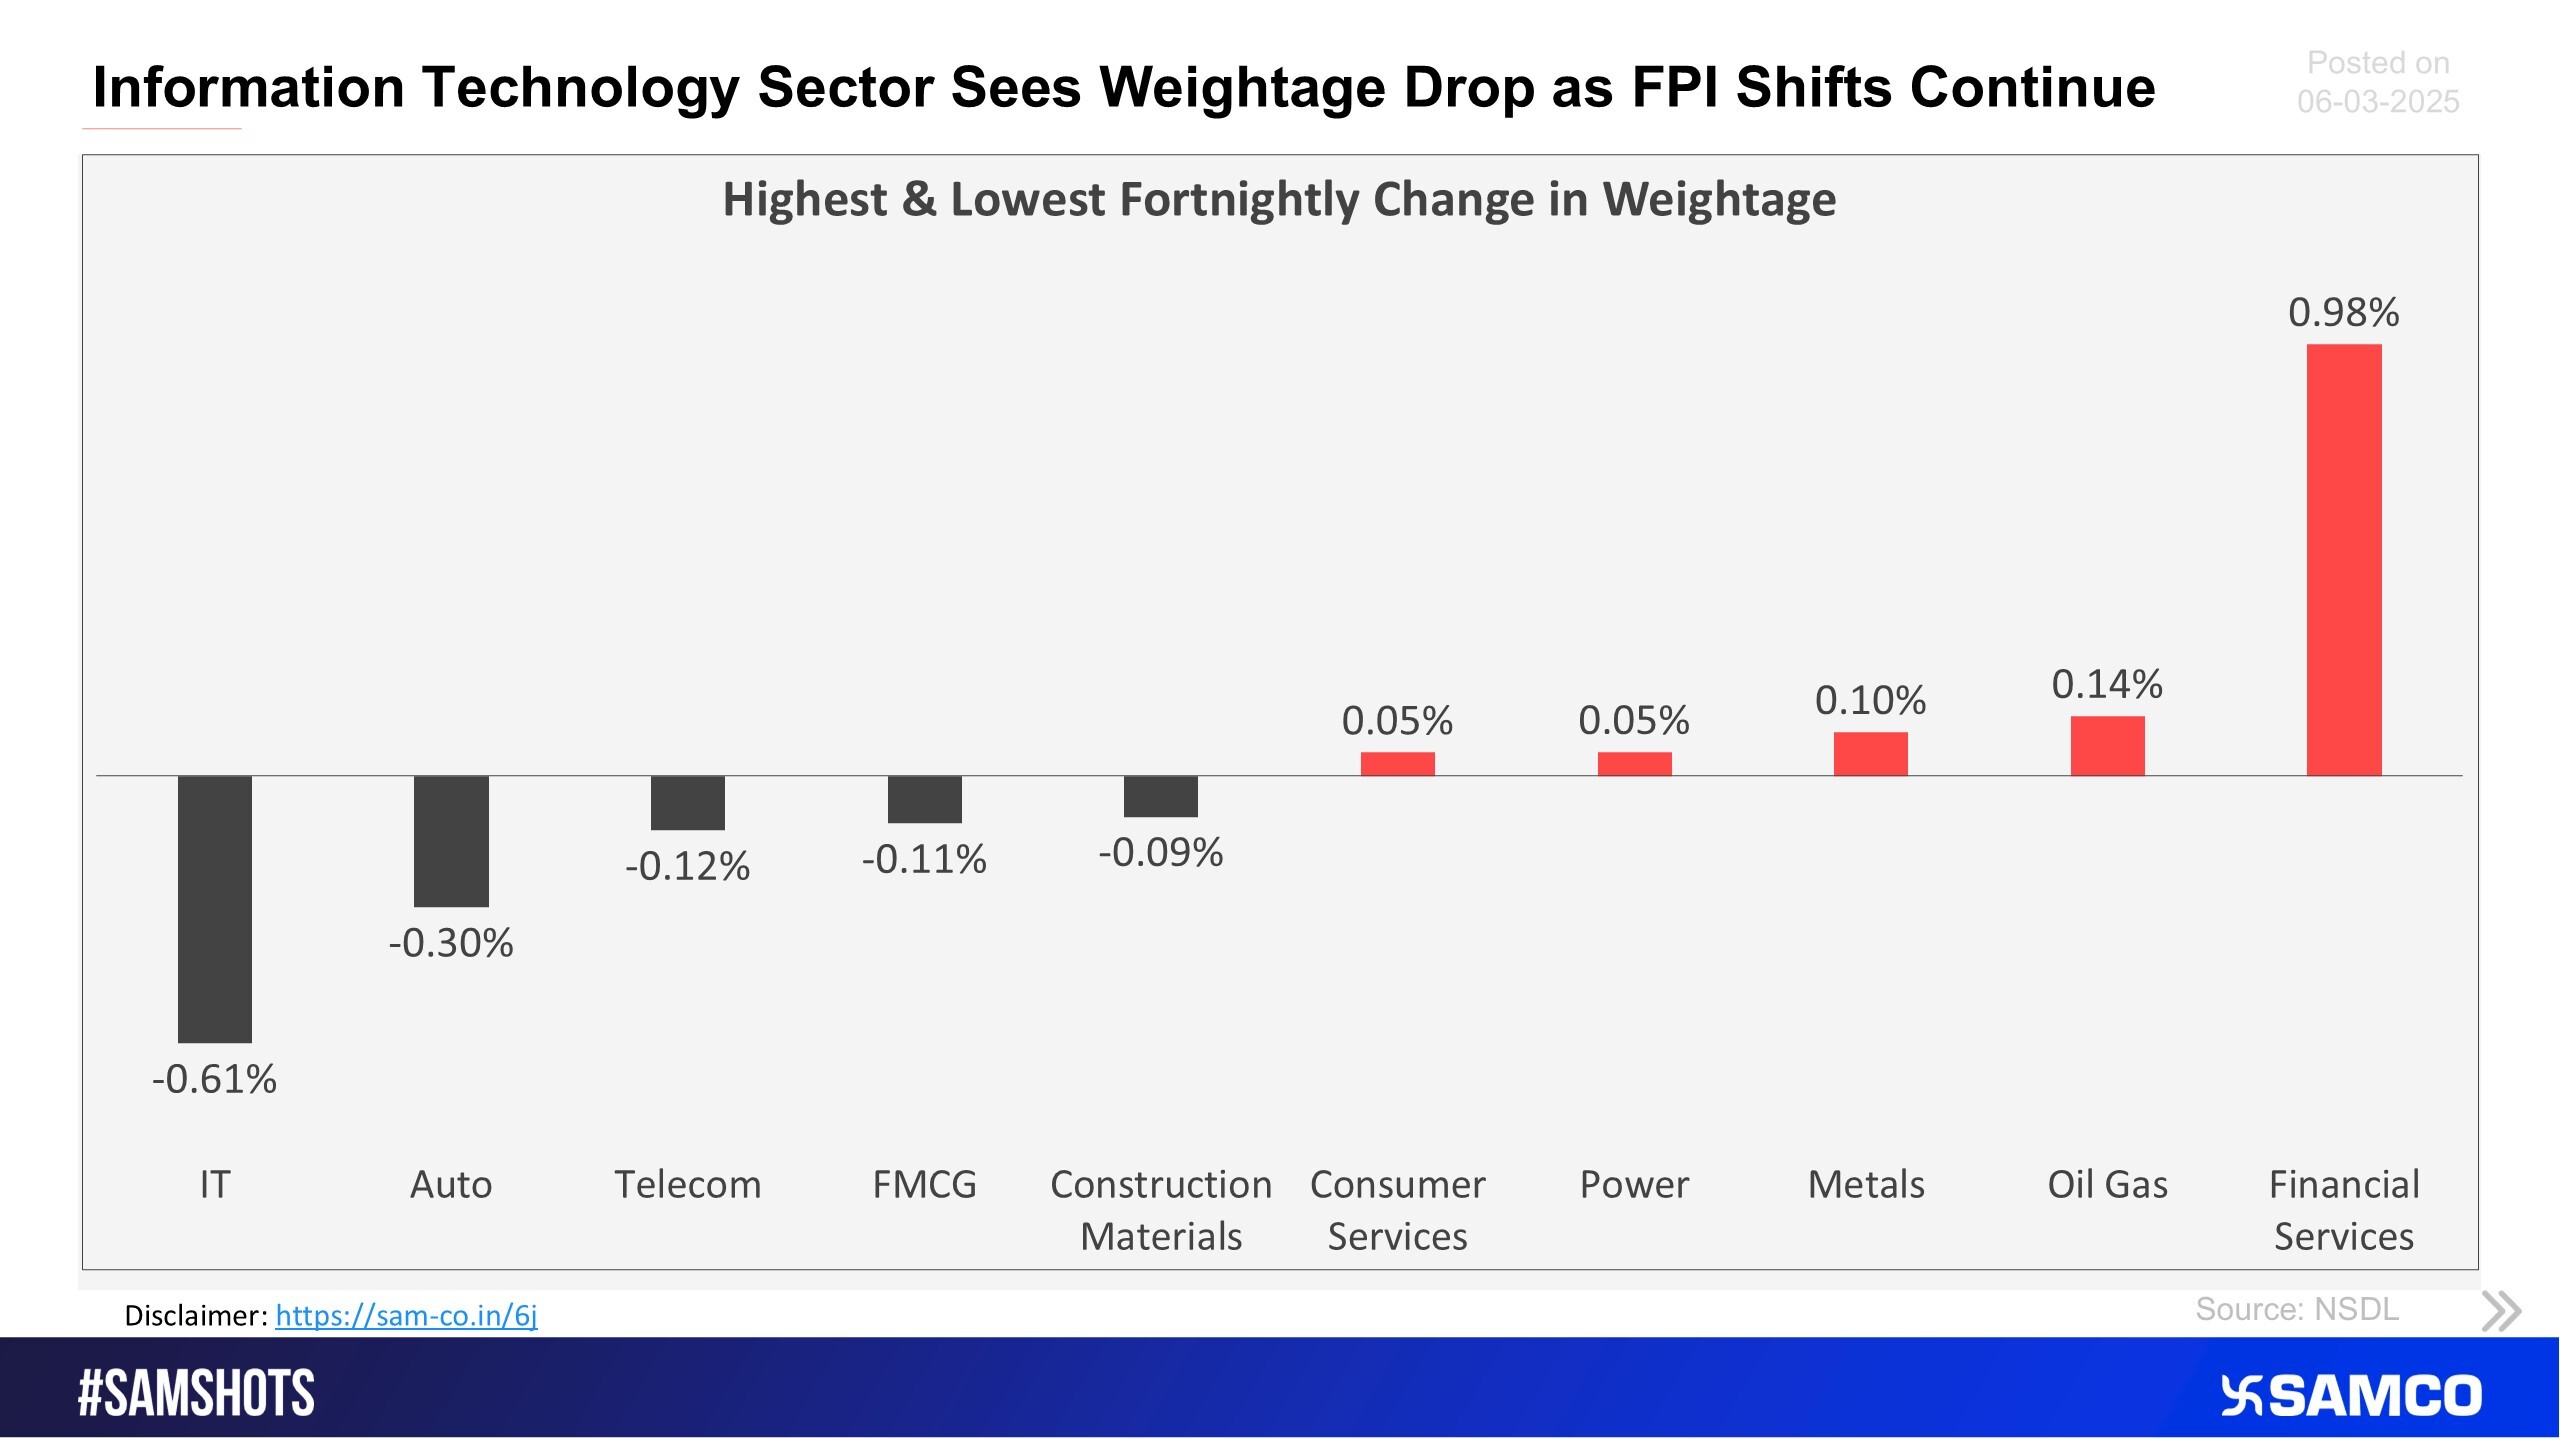
The chart below displays sectors that witnessed the highest and lowest change in the weightage of sectoral FPI holdings to the total FPI holdings compared to the previous fortnight.
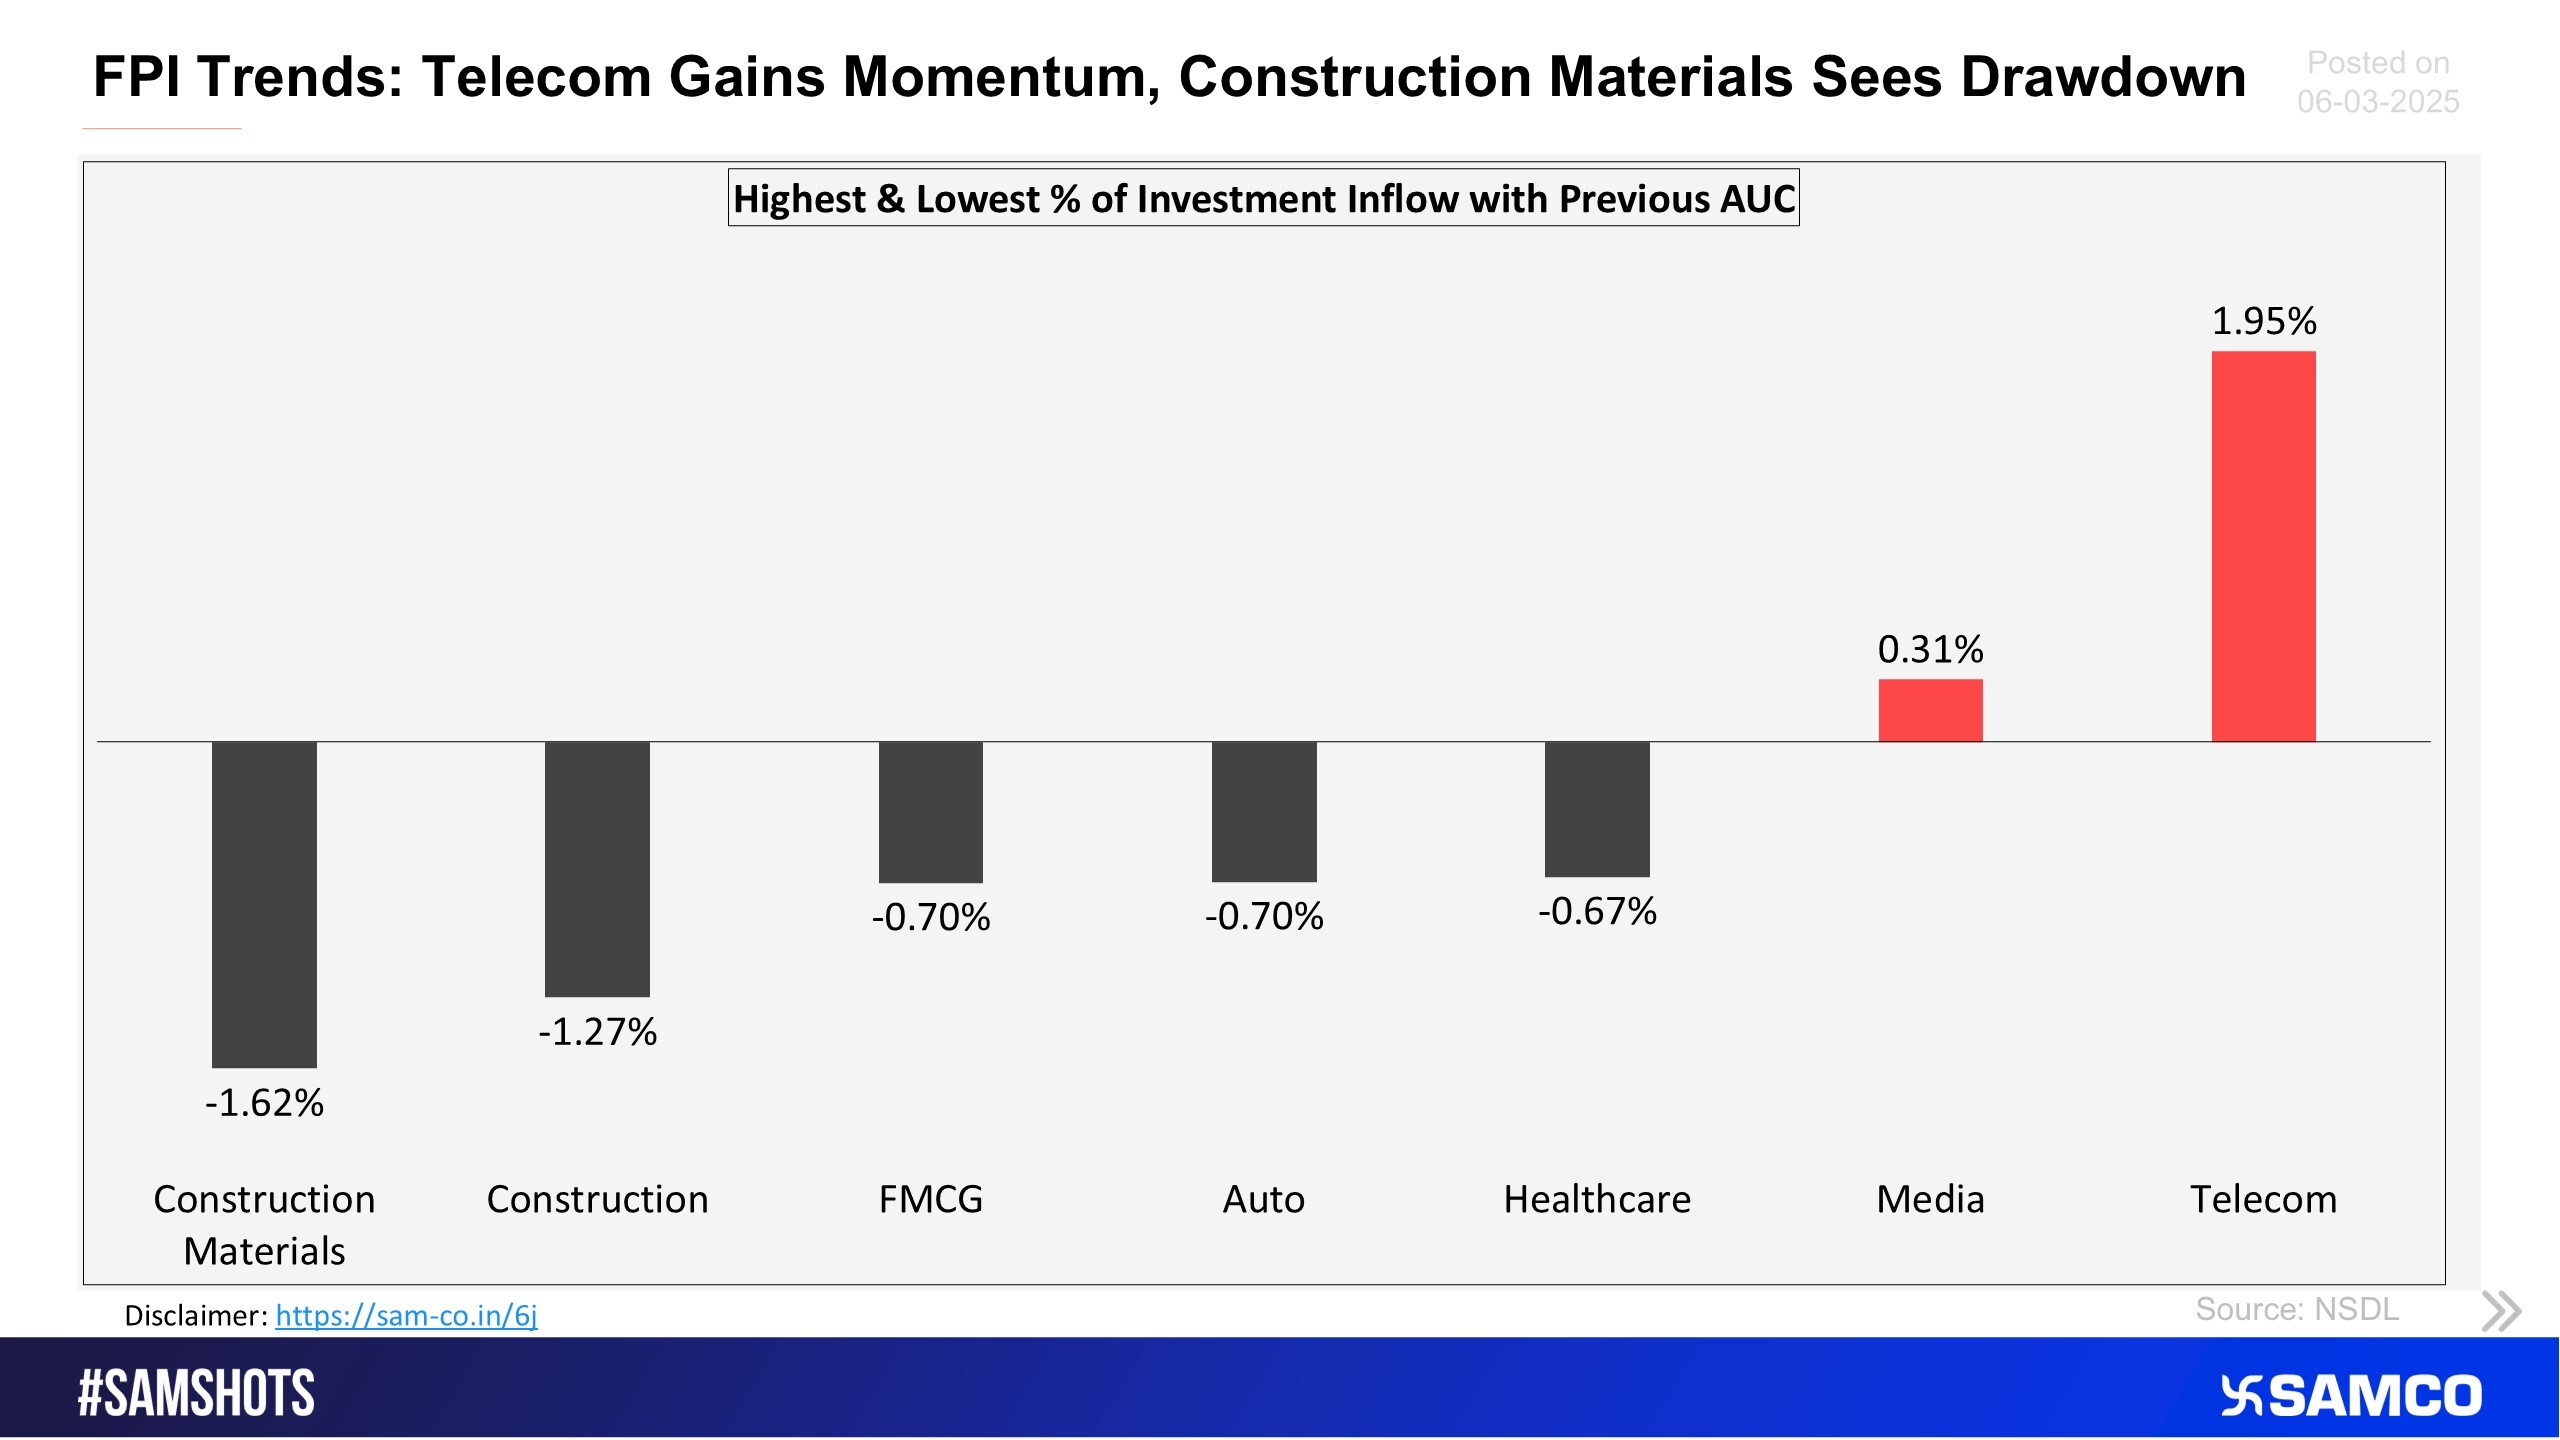
The below chart presents the highest & lowest percentage inflow of investment in the latest fortnight compared to the previous period AUC (Asset Under Custody) of FPI.
Reliance Industries Shows Strength; Current Setup Resembles Earlier Bullish Phases.
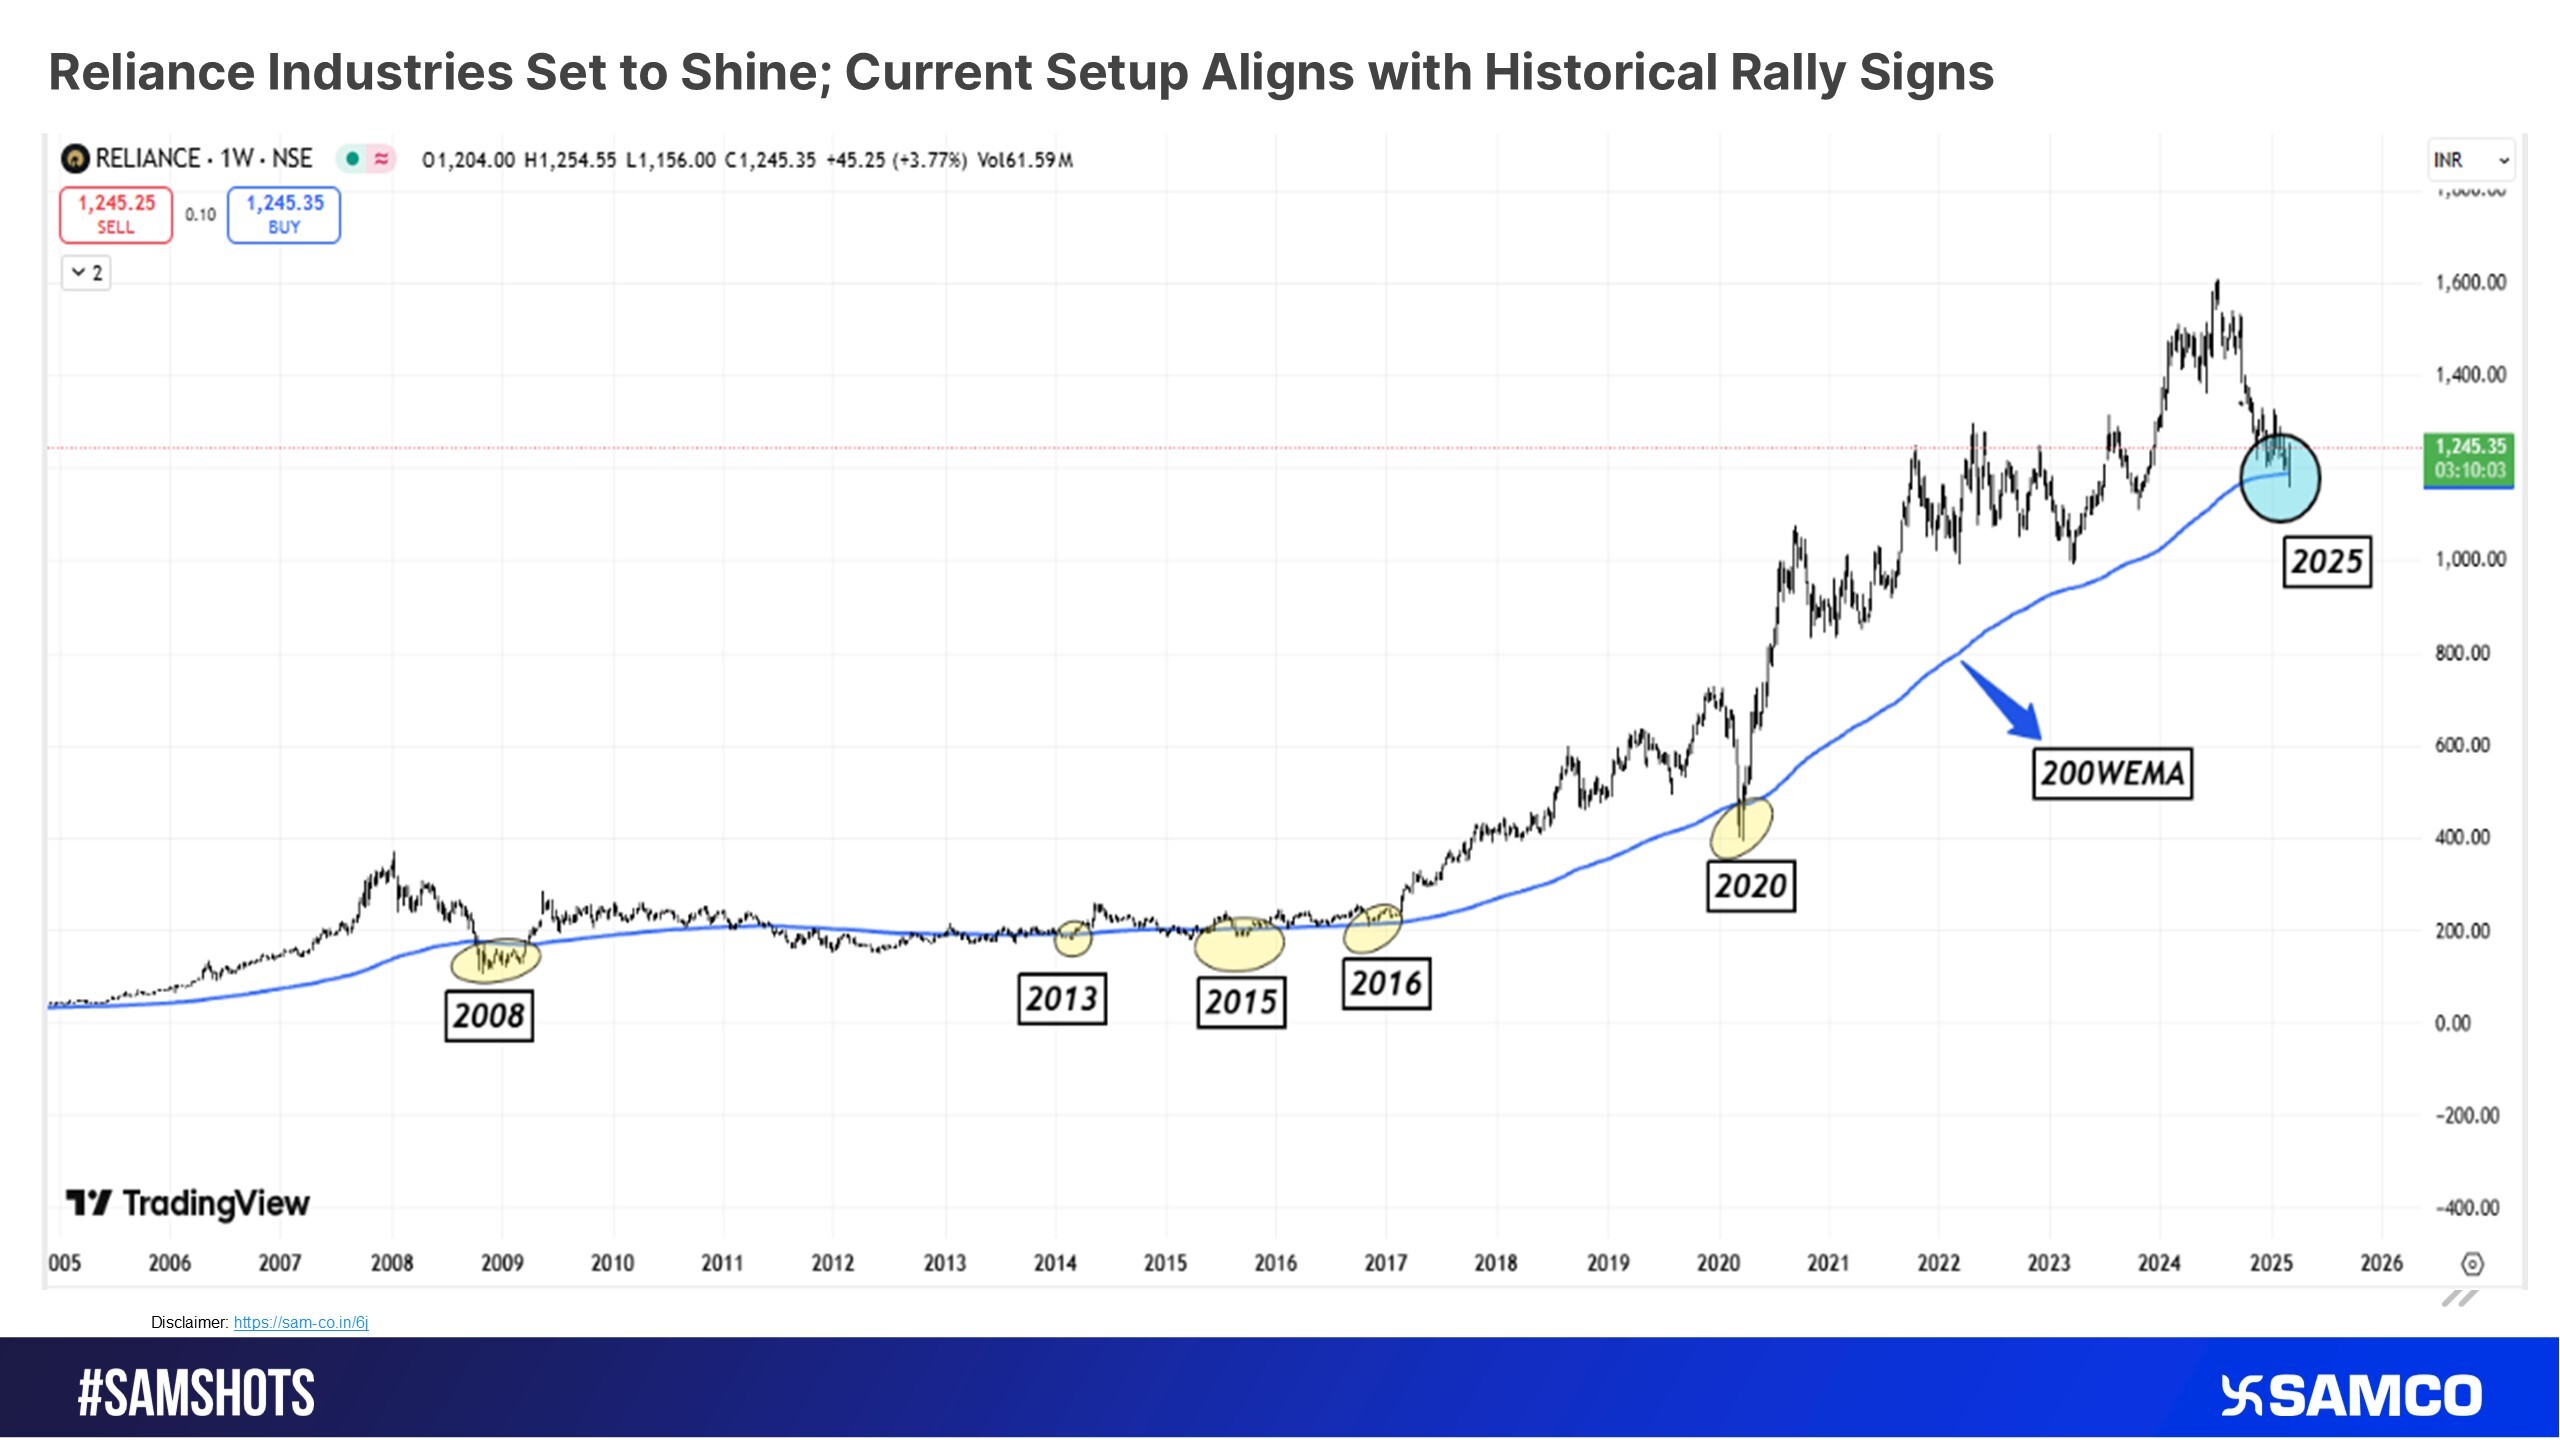
Image Source: @VisualCap (Twitter)
 Easy & quick
1. Register on SCORES portal
2. Mandatory details for filling complaints on SCORES
Name | PAN | Address | Mobile | Number | E-mail ID
3. Benefits
Effective Communication
Speedy redressal of the grievances
