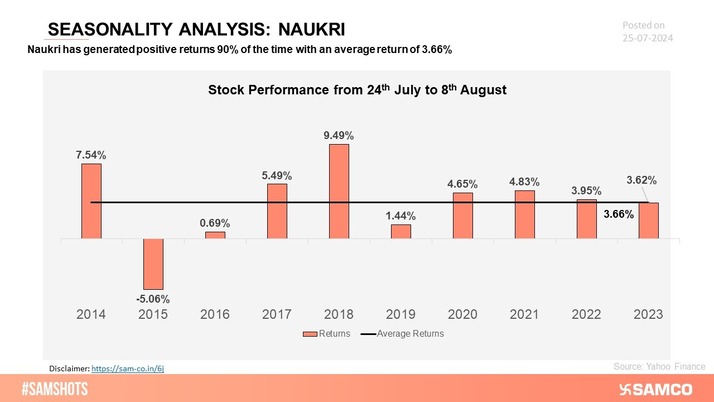
The Union Budget 2024 made for an eventful week in the Indian markets. Market heavyweights Reliance Industries took a hit, while HDFC Bank surged on Monday after announcing their Q1FY25 results, balancing the scales and keeping the market steady. Tuesday brought the much-anticipated budget announcement, which fell short of expectations and caused the Nifty 50 to drop to a low of 24,074 before recovering by the end of the day. As the week progressed, defensive sectors like Pharma, IT, and FMCG continued to attract attention. Meanwhile, India VIX touched a 3-month low, indicating reduced market uncertainty. By Friday, the optimism was back with the Nifty 50 hitting a new all-time high for the tenth week in a row. The index ended the week 1.24% higher at 24,835. Nifty Pharma and Nifty Media surged the most with gains of 5.77%, and 5.74% respectively. Scroll down to understand more of such market news and perspectives for the week gone by in easily understandable charts. Don’t miss our new insights on seasonality. Seasonality is the tendency for stocks to perform better during some periods of the year. Here we have presented stocks that have shown positive performance during the next few days each time in the last 10 years. The bars represent the percentage gains from the date mentioned on their respective chart
The chart analyzes the seasonality of Naukri over the past 10 years to identify recurring patterns and trends in their performance.


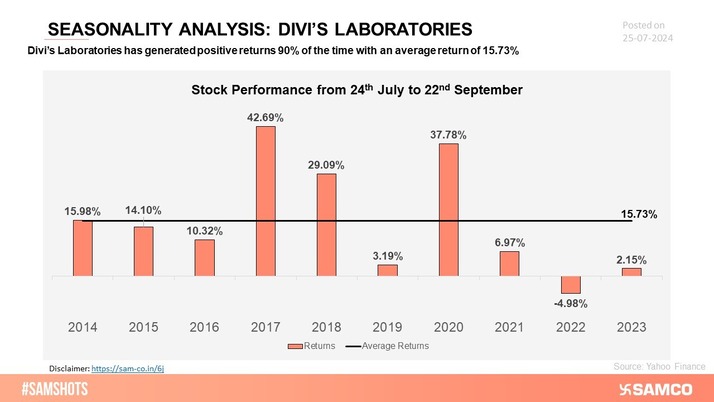
The chart analyzes the seasonality of Divi's Labs over the past 10 years to identify recurring patterns and trends in their performance.
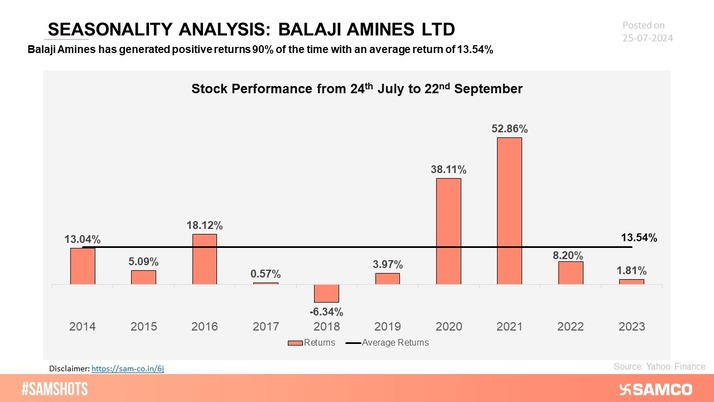
The chart analyzes the seasonality of Balaji Amines over the past 10 years to identify recurring patterns and trends in their performance.
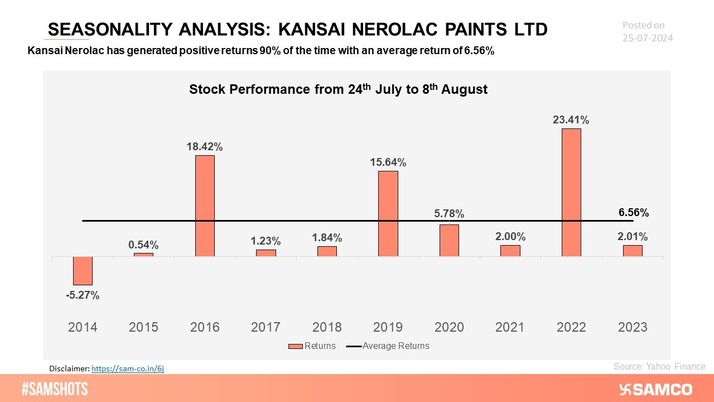
The chart analyzes the seasonality of Kansai Nerolac Paints over the past 10 years to identify recurring patterns and trends in their performance.
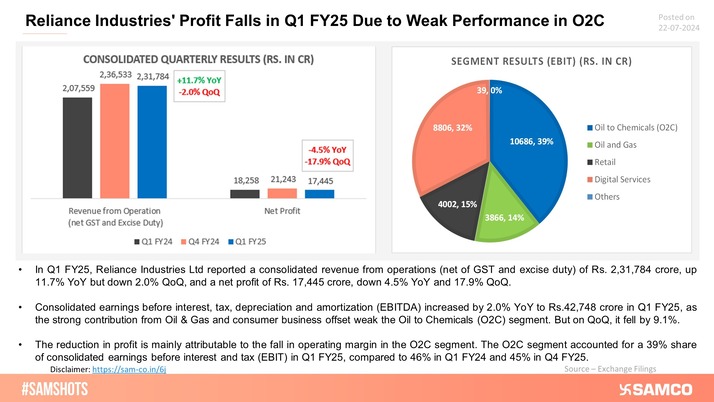
Here’s the snapshot of Reliance Industries Q1FY25 result!
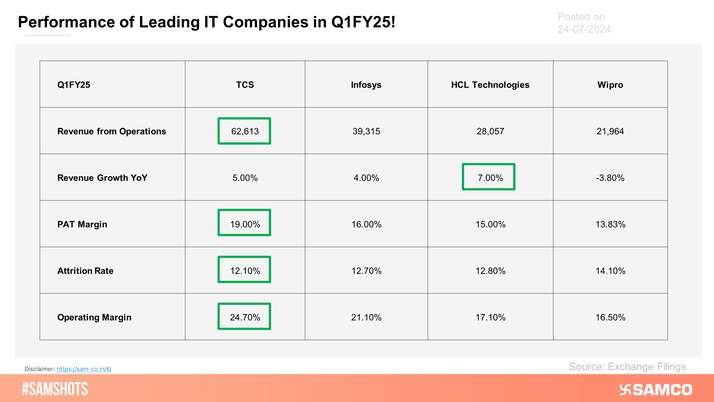
Leading firms like TCS, Infosys, and HCL Technologies have exceeded market expectations, indicating robust performance and sequential growth across major markets.
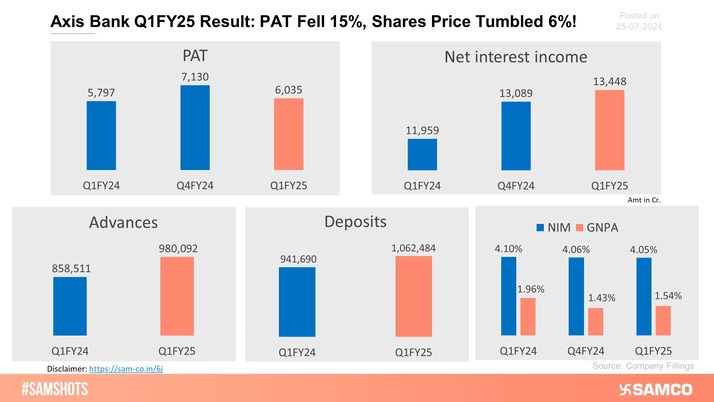
Axis Bank disappoints its stakeholders after showing negative growth in its Q1FY25 PAT.
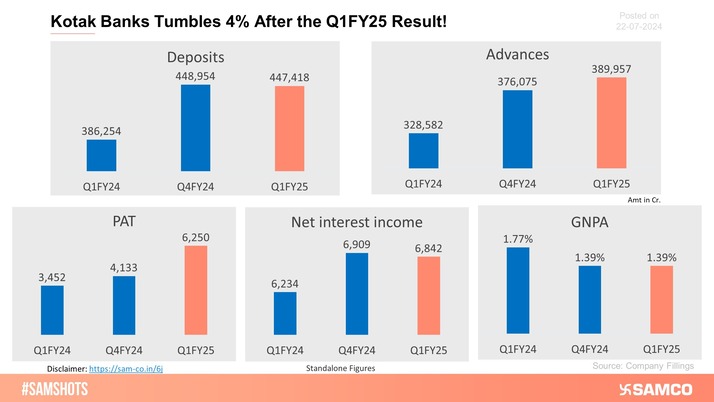
The shares of Kotak Bank declined on 22nd July after it failed to meet investors’ expectations in the Q1FY25 result.
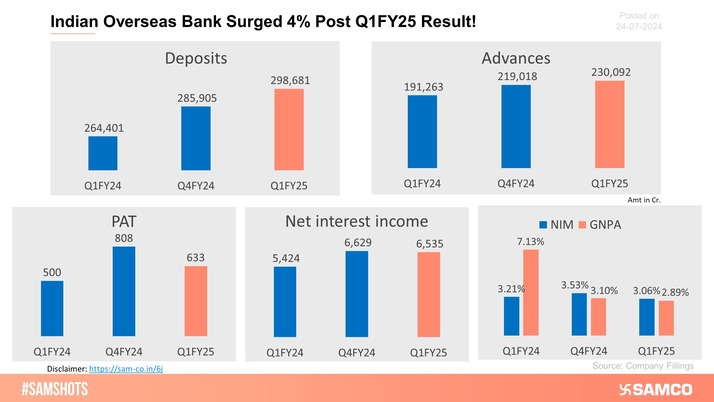
The below chart presents the Q1FY25 performance of Indian Overseas Bank Ltd.
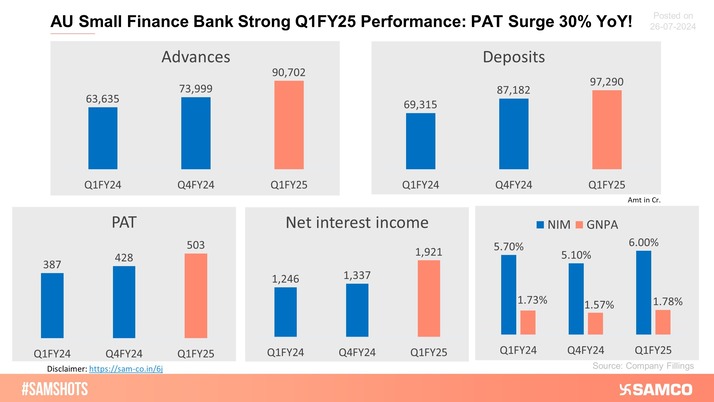
Here’s how AU Small Finance Bank performed in Q1FY25.
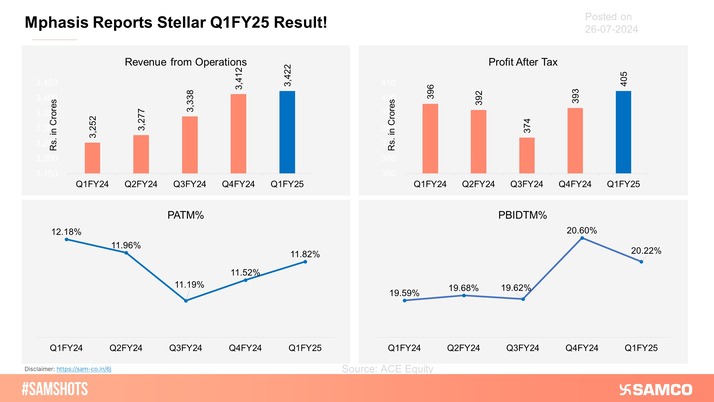
Mphasis surged by over 7% on Friday on account of strong Q1FY25 result.
Tech Mahindra reported muted revenue growth and margin expansion in Q1 FY25, despite it being a seasonally weak quarter.

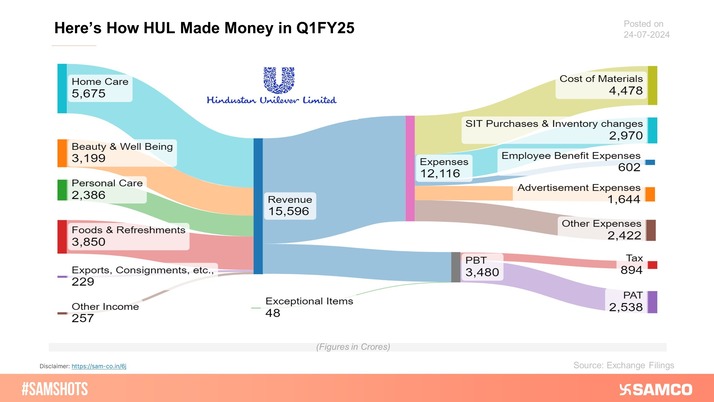
Here's the breakup of HUL’s Income Statement for the quarter ending Jun-24.
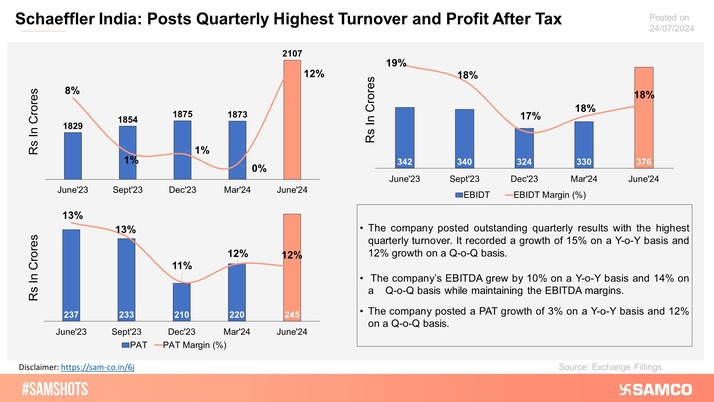
The chart displays the record-breaking performance of Schaeffler India.
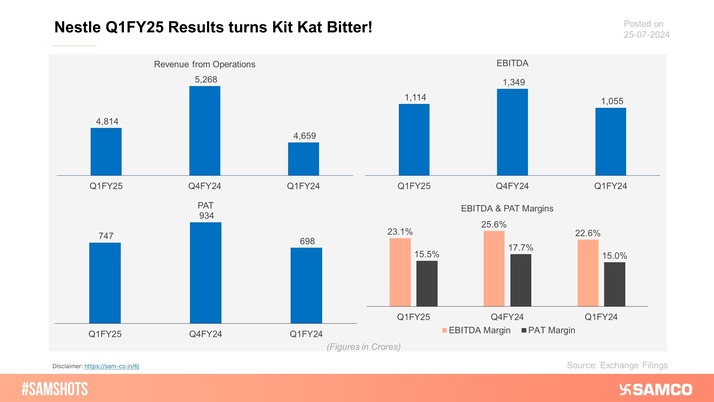
The accompanying chart presents the performance of Nestle India in Q1FY25.
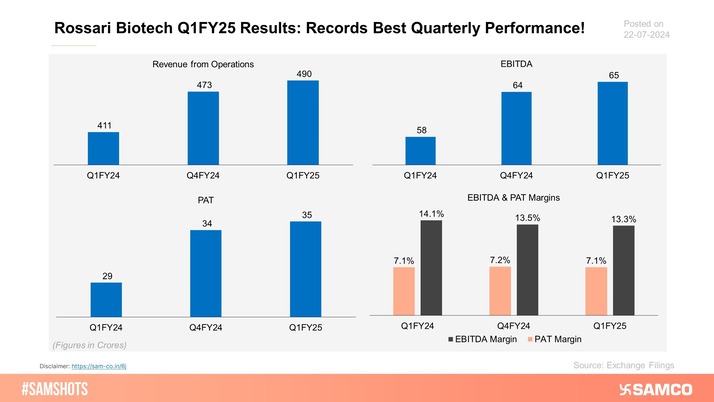
Below is the chart of Rossari Biotech’s Q1FY25 results.
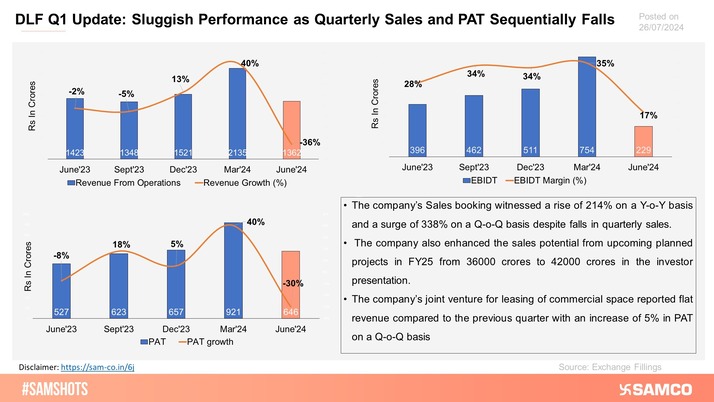
Here's how DLF performed during Q1FY25!
Here’s how AU Small Finance Bank performed in Q1FY25.
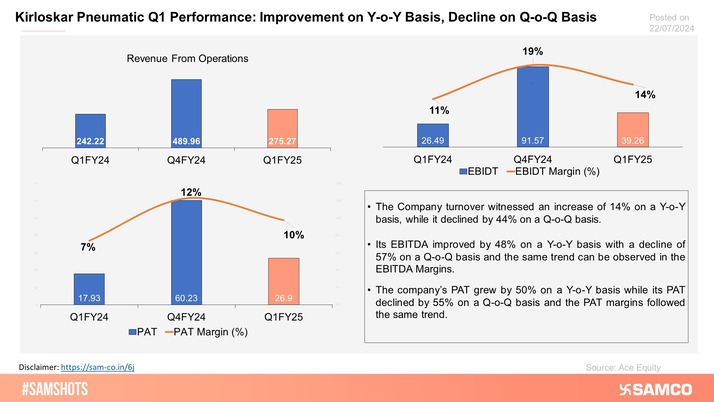
The graph displays the financial performance of Kirloskar Pneumatic for Q1FY25.
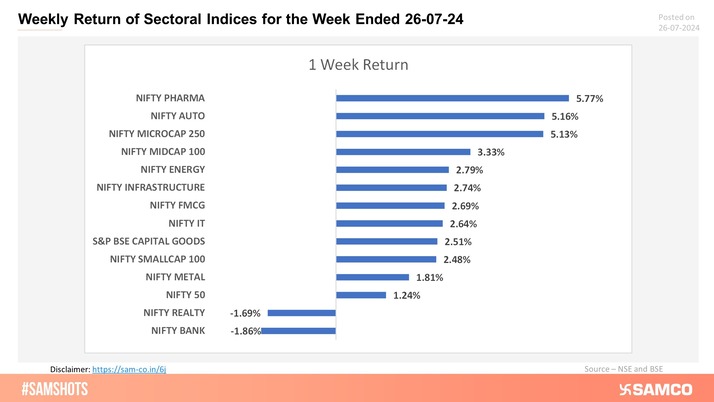
The weekly return of sectoral indices are presented below:
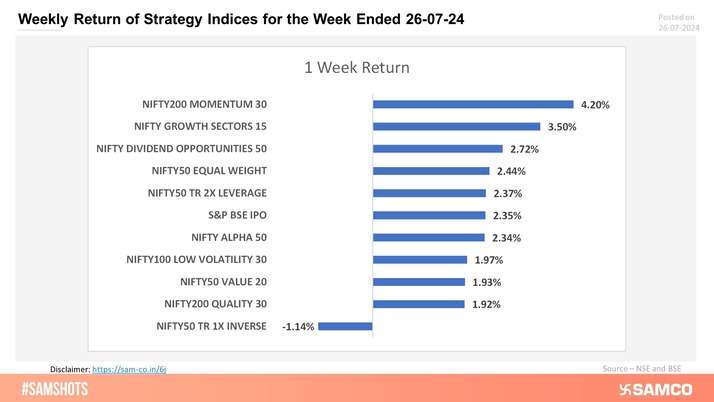
The weekly return of strategy indices are presented below:
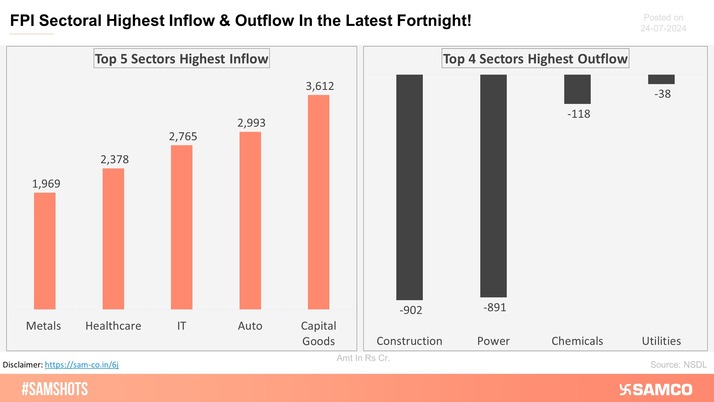
The below chart shows the highest & lowest sectoral investment made by FPI in the latest fortnight
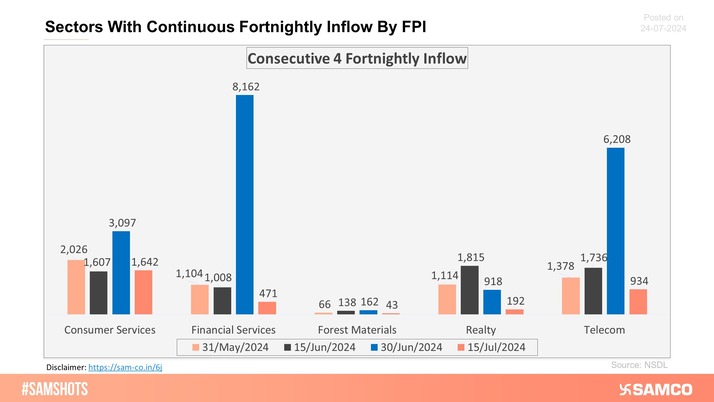
The sectors shown in the chart have witnessed consecutive 4 fortnightly inflows of FPI money.
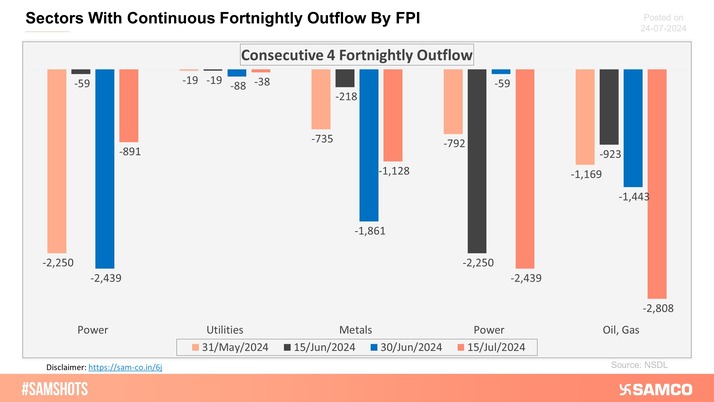
The sectors shown in the chart have witnessed consecutive 4 fortnightly outflows of FPI money.
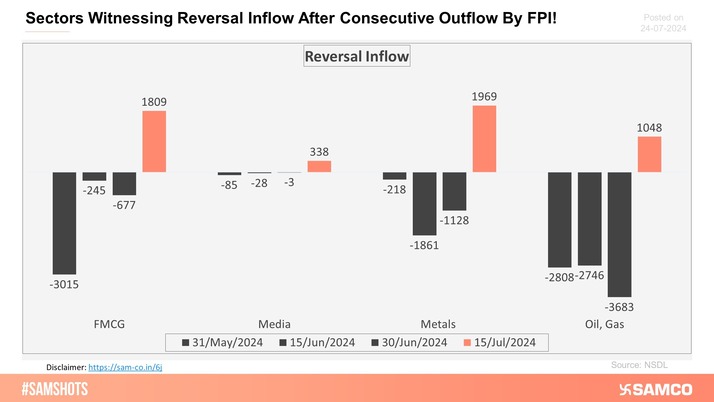
The sectors mentioned in the chart have witnessed an inflow of FPI funds after consecutive 3 fortnightly outflows.
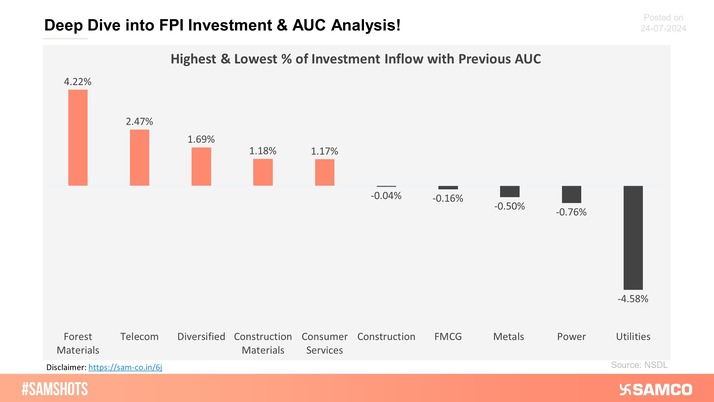
The below chart presents the highest & lowest percentage of investment in the latest fortnight compared to the previous period AUC (Asset Under Custody) of FPI.
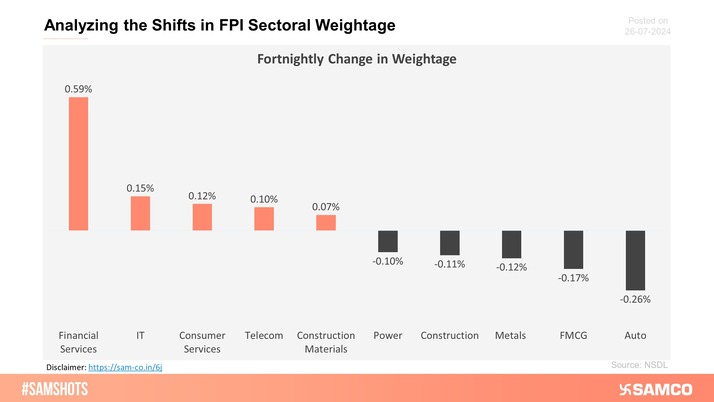
The below chart shows the highest & lowest sectoral change in weight of FPI holding.
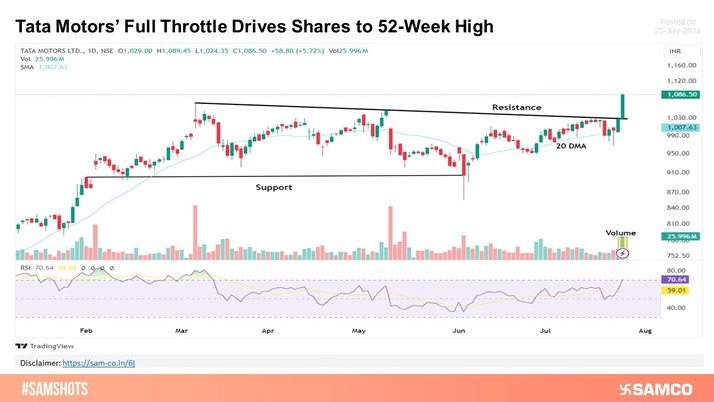
Tata Motors marks new 52 week high
Ipcalab inches higher following the neckline breakout of the inverse head and shoulders pattern.
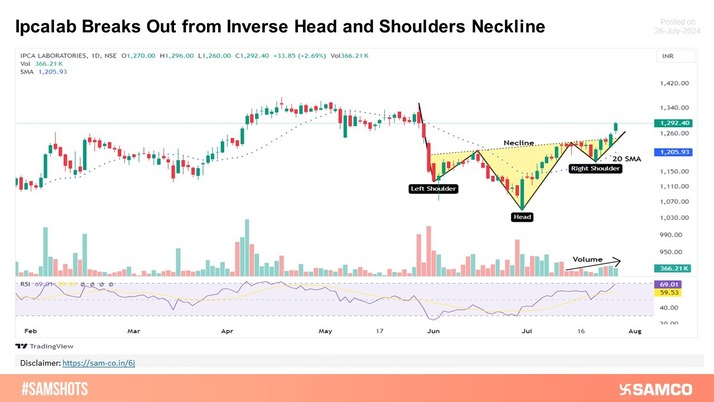
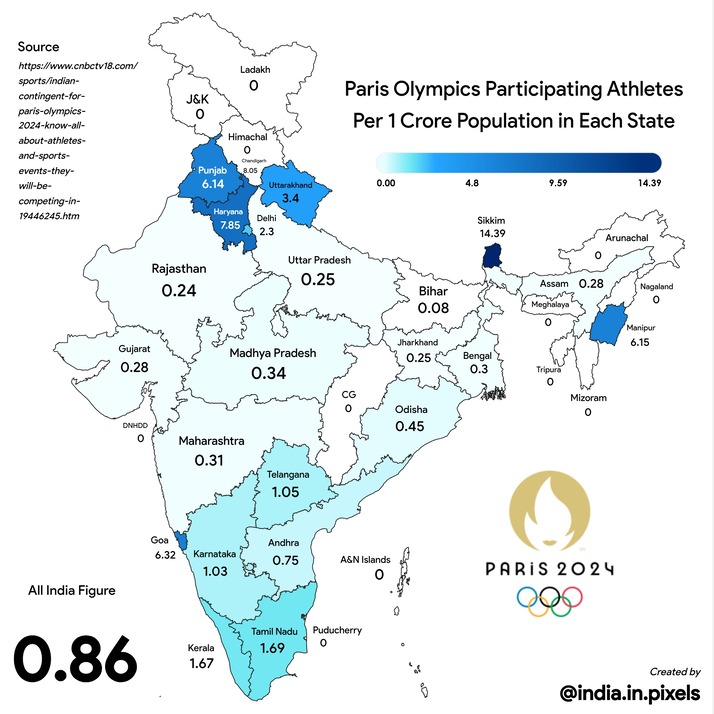
Image Source: @indiainpixels (Twitter)
 Easy & quick
1. Register on SCORES portal
2. Mandatory details for filling complaints on SCORES
Name | PAN | Address | Mobile | Number | E-mail ID
3. Benefits
Effective Communication
Speedy redressal of the grievances
