The past week witnessed a volatile market, driven by expectations and responses to the Q3 FY25 results. Overall, the market experienced a widespread decline across large-cap, mid-cap, and small-cap stocks. The benchmark, Nifty 50 has fallen by 0.48% this week. Consistent selling pressure from FIIs throughout the week has hindered the market’s ability to reverse its direction. However, the IT sector’s Q3 results and outlook for future quarters have remained positive, particularly in the mid- and small-cap segments. Nifty IT index has gained 3.55% this week.
During the week, Donald Trump joined the Oval office. While his tariff plans for solar imports could impact Indian solar energy exporters, proposed tariffs on countries like Mexico, Canada, and China may create opportunities in other industries, such as automobiles and ancillary sectors. The Bharat Auto Mobility Expo concluded, dominated by a showcase of new EV models by OEMs, signalling a firm shift toward electrification. Meanwhile, world leaders convened at Davos to address economic challenges and develop strategies for sustainable growth.
Looking ahead, the next major event in India is the Union Budget. This will be followed by the RBI’s February MPC meeting, which could potentially result in a rate cut. How these events will shape the market’s trajectory in the coming weeks remains to be seen.
Scroll down to understand more of such market news and perspectives for the week gone by in easily understandable charts.
In this email, we bring together a few of our most popular Samshots published during the last week. To View the detailed compilation, click here!
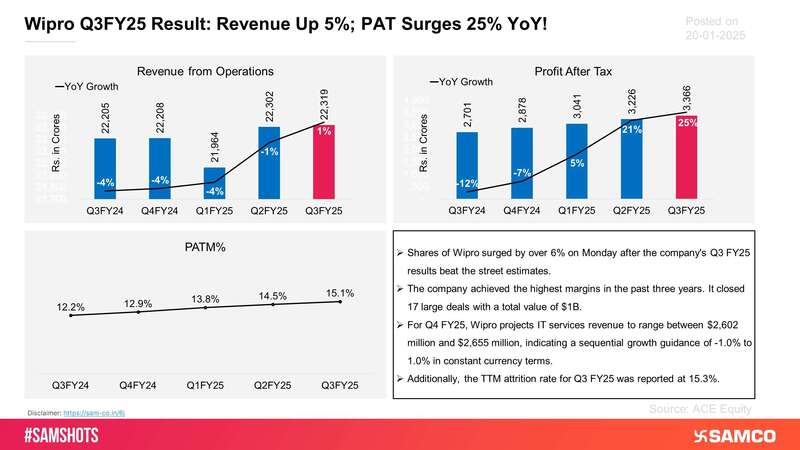
Highlights of Wipro’s Q3FY25 results are presented below


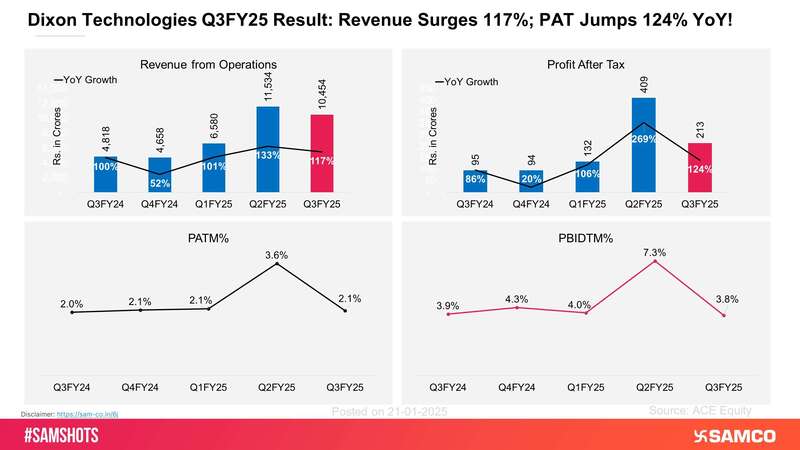
A glimpse of Dixon Technologies’ quarterly financial performance is outlined below
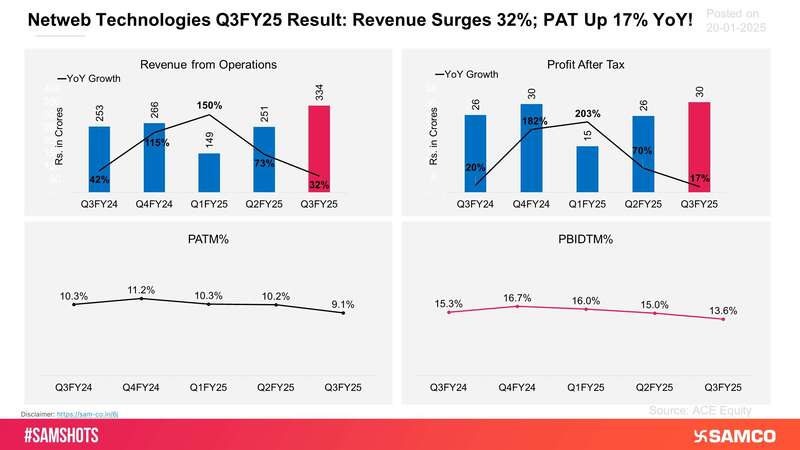
A trend analysis of Netweb Technologies’ quarterly results
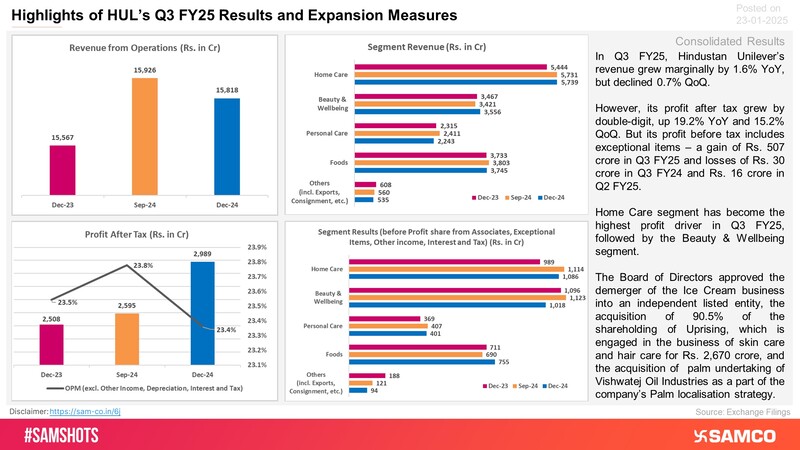
HUL’s Q3 FY25 results with segment breakup is outlined below
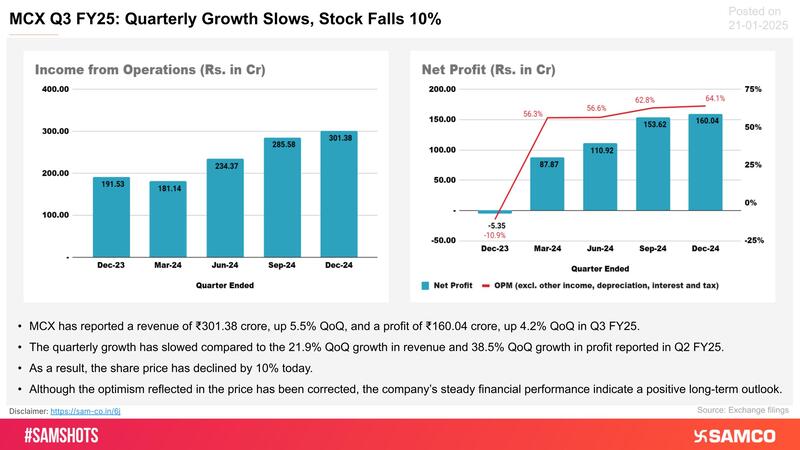
The financial performance of MCX during Q3 FY25 is presented below
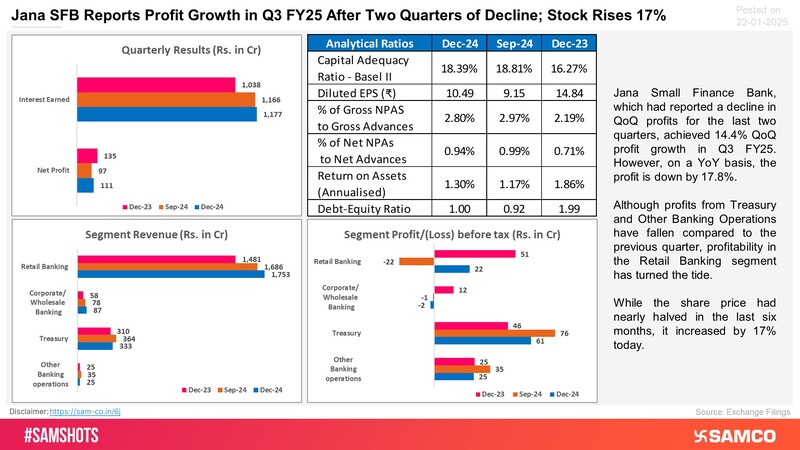
Let’s break down Jana SFB’s Q3 results to analyze the rally in its stock price
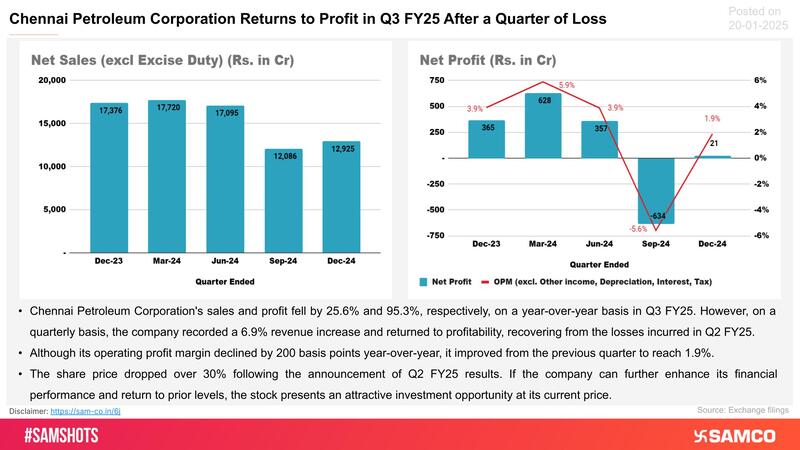
Highlights of CPCL’s Q3 FY25 results are presented below
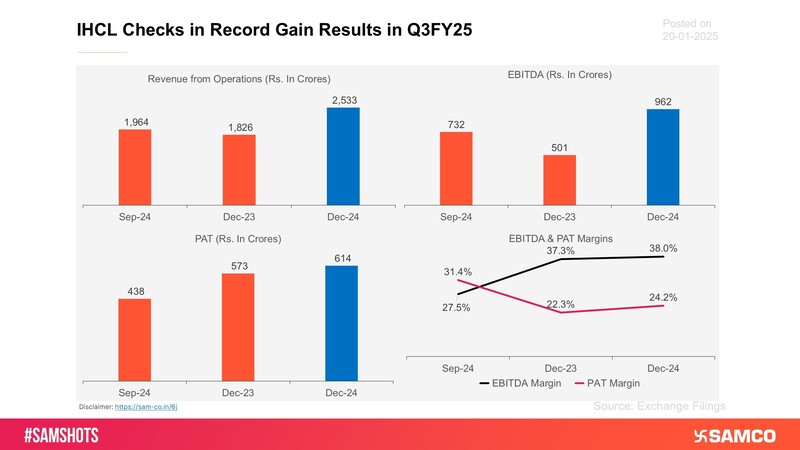
Here’s how Indian Hotels performed during the quarter ending Dec 24
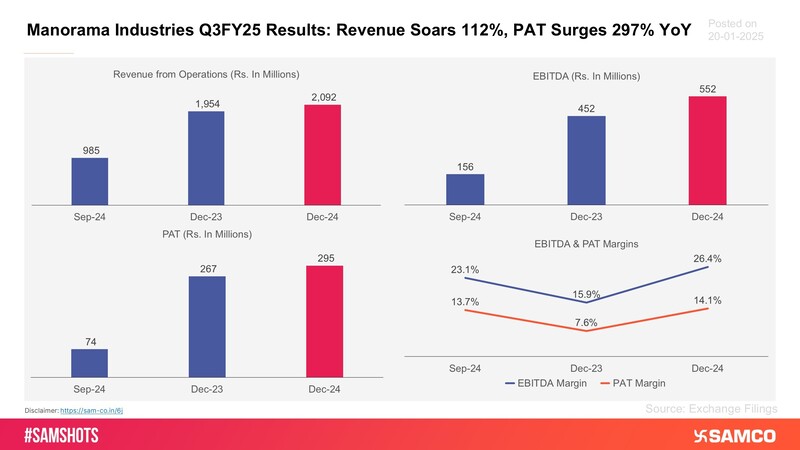
Here’s the financial performance of Manorama Industries for the quarter ending Dec-24
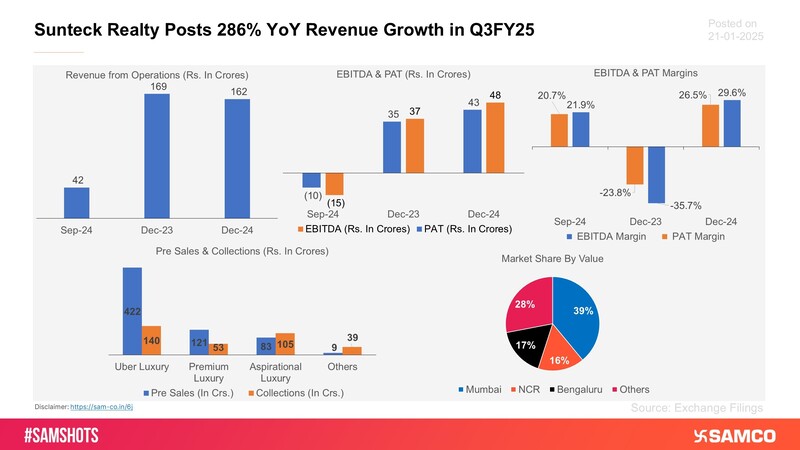
The below charts presents how Sunteck Realty performed during Q3FY25.
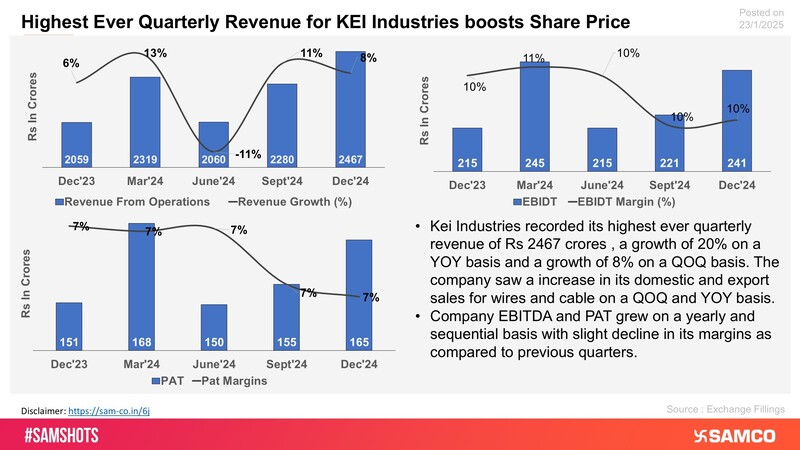
The chart displays the financial performance of KEI Industries for Q3FY25
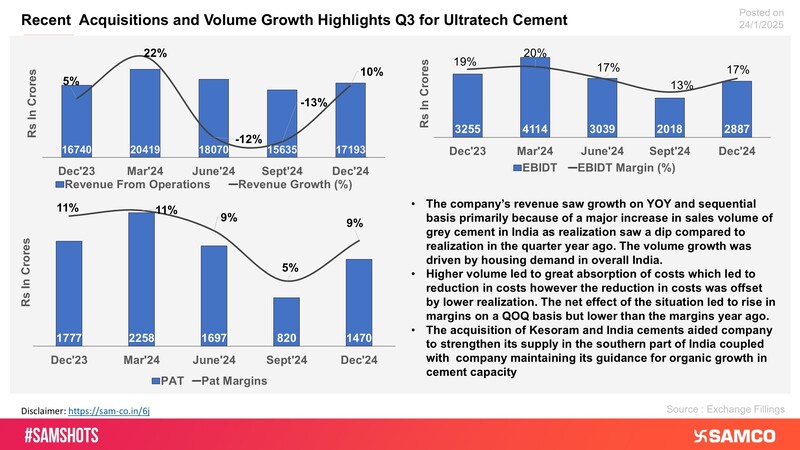
The chart evaluates the reason for rise in stock price of Ultratech Cement
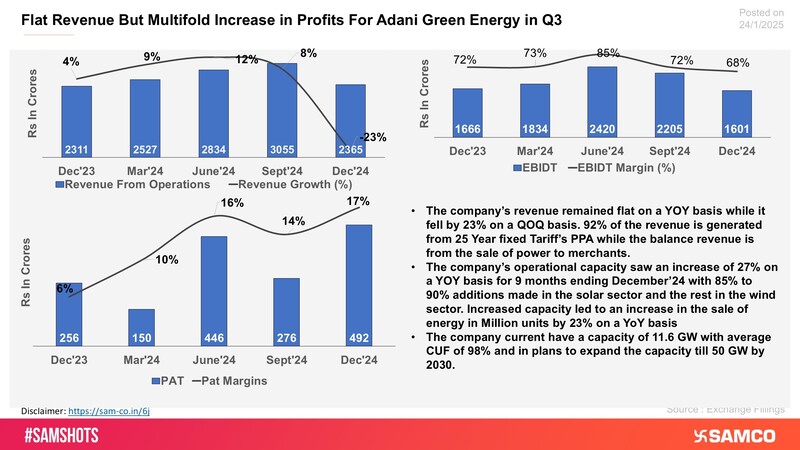
The chart evaluates the performance of Adani Green Energy for Q3FY25 on various financial parameters
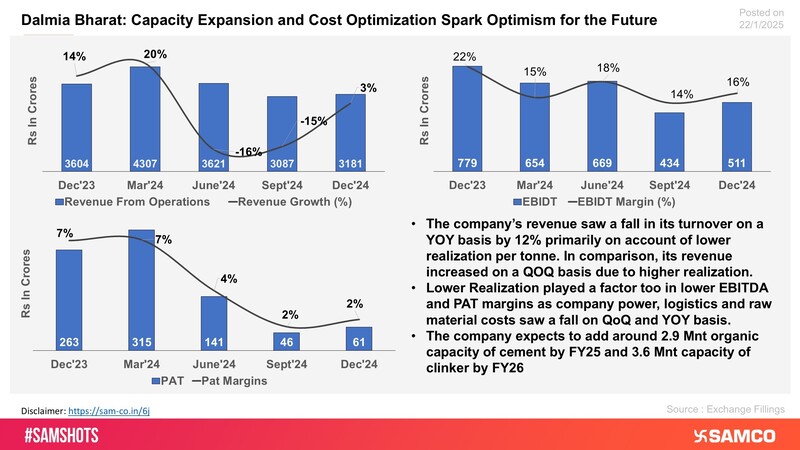
The chart displays the financial highlights of Dalmia Bharat for Q3FY25
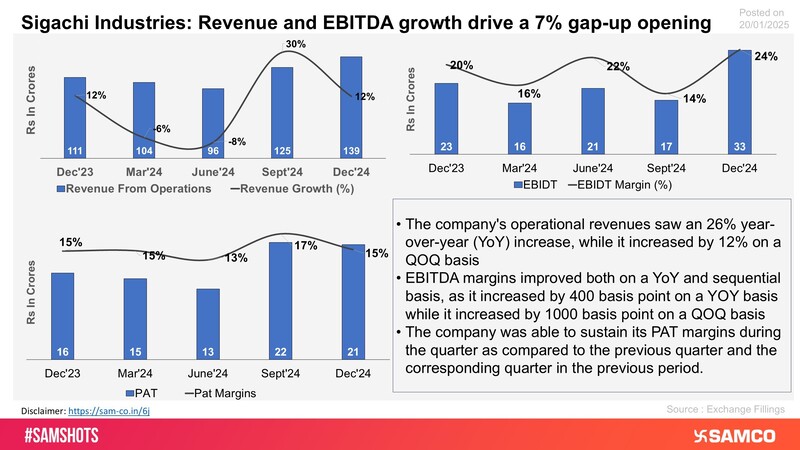
The chart displays the outstanding performance of Sigachi Industries for Q3FY25
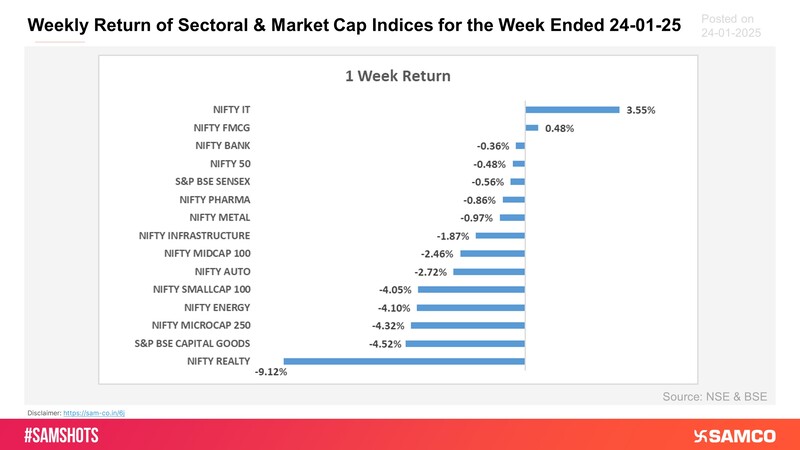
Presented below are this week’s returns of sectoral and market cap based indices. Nifty IT was the only sectoral index that kept its head above water.
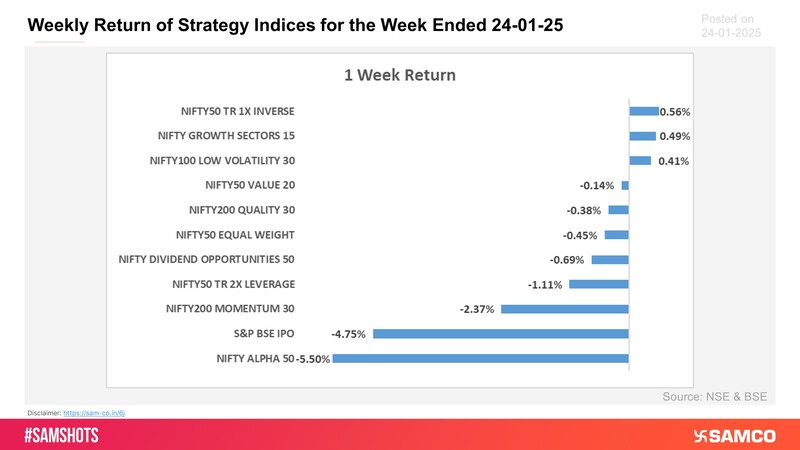
Growth and low volatility outperformed while Alpha and IPO index took a beating
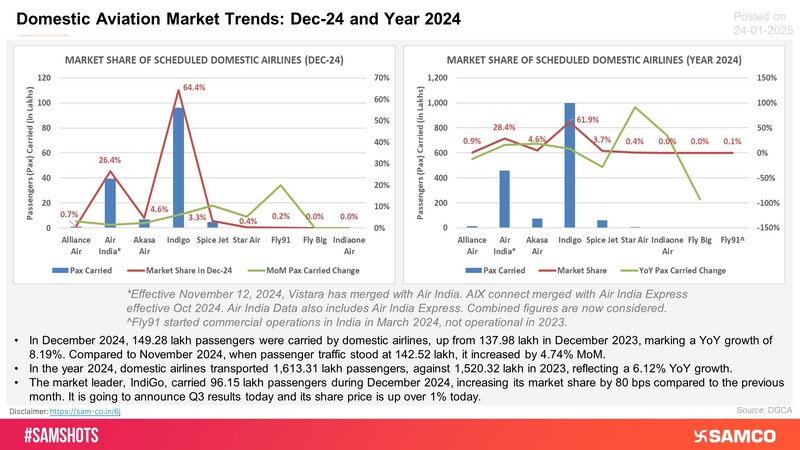
Take a look at how the domestic aviation industry in India performed in the recent month and year
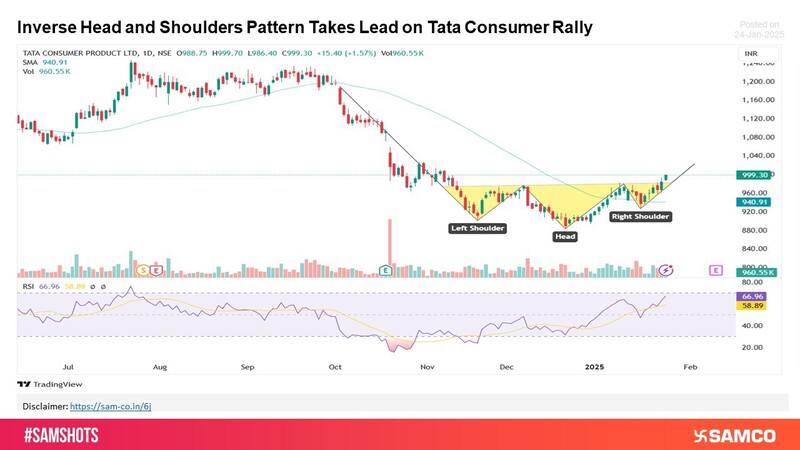
Inverse Head and Shoulders Drives Momentum in Tata Consumer
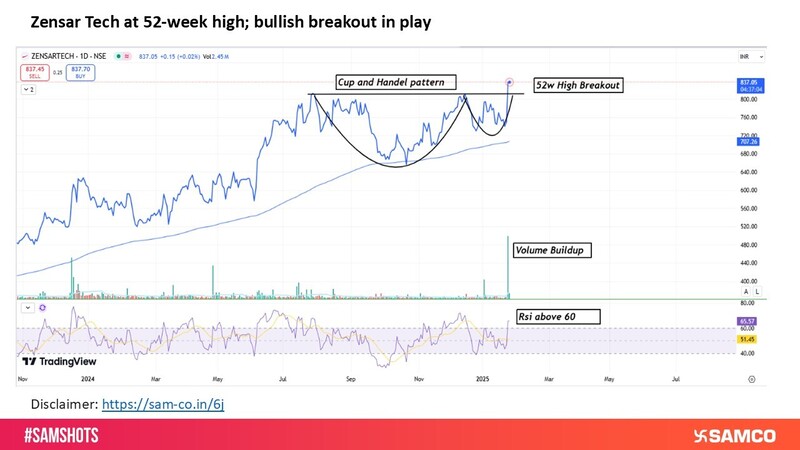
Zensar Tech soars to 52-week high with bullish momentum
 Easy & quick
1. Register on SCORES portal
2. Mandatory details for filling complaints on SCORES
Name | PAN | Address | Mobile | Number | E-mail ID
3. Benefits
Effective Communication
Speedy redressal of the grievances
